ERS Charts of Note
Subscribe to get highlights from our current and past research, Monday through Friday, or see our privacy policy.
Get the latest charts via email, or on our mobile app for  and
and 
Friday, October 26, 2018
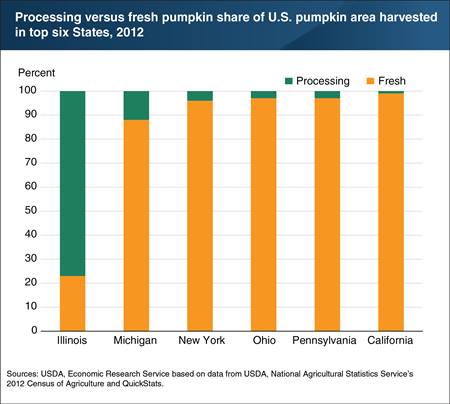
In advance of National Pumpkin Day on October 26 and Halloween on October 31, many Americans will have spent time searching for the perfect pumpkins for their jack-o’-lanterns. Although all U.S. States produce some pumpkins, the U.S. Census of Agriculture reports that six States contained about one-half of all pumpkin acres in 2012. Illinois has consistently been the Nation’s largest pumpkin producer, but most of Illinois’s pumpkins, nearly 80 percent, are processed for pie filling or other uses—compared to a little over 10 percent processed in Michigan. Fresh pumpkin supplies from most States are targeted toward the seasonal market for ornamental uses and home processing. Growers mainly produce jack-o'-lantern type pumpkins (like the Howden variety), but demand for specialty pumpkins (like White Howden, Blue, Cinderella, and Fairytale) continues to expand as consumers look for new and interesting varieties. Initial reports for 2018 pumpkin production indicate healthy crops in Illinois and California. However, some reports from Michigan indicate a challenging year for pumpkins due to early drought, recent downpours, and disease. This chart appears in the ERS Pumpkins: Background & Statistics topic page, updated in October 2018.
Tuesday, August 21, 2018
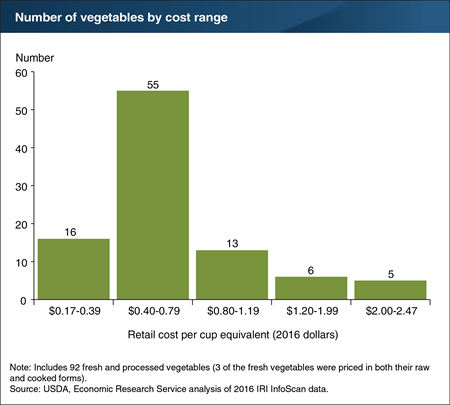
“Add More Vegetables to Your Day” and “Vary Your Veggies” are among USDA’s key messages about how Americans can achieve healthier diets. However, many Americans still consume an insufficient quantity and variety of vegetables. One reason may be a lingering perception that vegetables are expensive. To address this perception, ERS recently estimated average retail prices paid in 2016 for 92 fresh and processed vegetables (including legumes), measured in cup equivalents. A cup equivalent is the edible portion that will generally fit in a 1-cup measuring cup; 2 cups for lettuce and other raw leafy greens. ERS researchers found that iceberg lettuce, fresh whole carrots, canned green beans, and 13 other products cost less than 40 cents per cup equivalent, while 55 vegetables, including baby carrots, frozen mixed vegetables, and canned tomatoes, cost between 40 and 79 cents per cup equivalent. Fresh asparagus, at $2.47 per cup equivalent, is the priciest of these 92 vegetables, and dried pinto beans at $0.17 are the least expensive. The data in this chart are from ERS's Fruit and Vegetable Prices data product, updated July 11, 2018.
Thursday, August 9, 2018
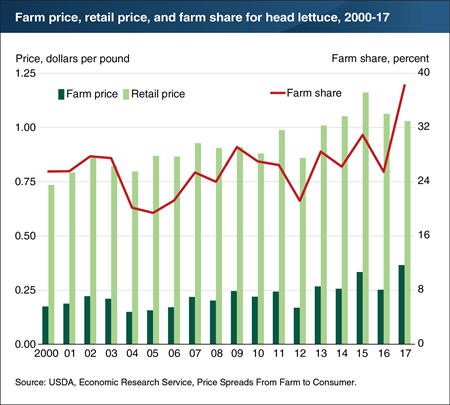
The farm share of the retail price of head lettuce—the ratio of what farmers received to what consumers paid per pound in grocery stores—was 38 percent in 2017, the highest farm share since the 1990s. In 2017, while the national, monthly average price of head lettuce at grocery stores fell 3 cents to $1.03 per pound, the monthly average price received by farmers rose 12 cents to $0.37 per pound. ERS’s calculation of the farm share for head lettuce takes into account loss that occurs in grocery stores from spoilage and trimming by assuming that farmers supply a little less than 1.1 pounds for each pound sold at retail. Farm prices for head lettuce were particularly high during the first half of 2017. Flooding in California, brought on by heavy rains early in the year, delayed the planting and harvesting of head lettuce. California accounts for close to three-fourths of head lettuce production. Reduced supplies of head lettuce pushed farm prices higher, but had only a short-lived impact on retail prices. This chart appears in “Monitoring Trends in Retail Prices and Farm Shares of Food Products” in the August 2018 issue of ERS’s Amber Waves magazine.
Thursday, May 31, 2018
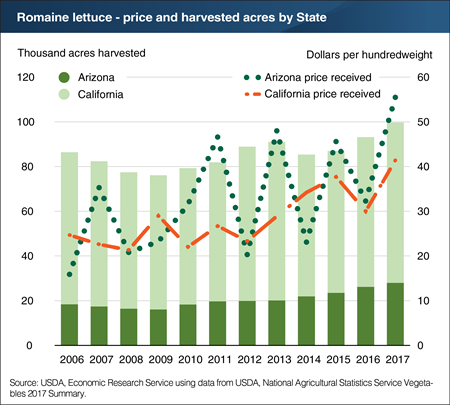
The two top States for production of romaine lettuce are California and Arizona, with Arizona comprising about a quarter of total harvested acreage in recent years. Since 2010, Arizona’s harvested area of romaine lettuce has been growing steadily at about 7 percent annually. Over the same period, prices received by producers in Arizona have been somewhat higher, although more variable, than prices in California. Seasonally, the Arizona romaine crop is typically harvested from early November to late April and satisfies demand when the dominant California crop has not yet reached maturity for harvest. The recent outbreak of E. coli O157:H7 tied to romaine lettuce was reported at the end of the Arizona harvest season, so romaine lettuce is no longer being harvested and shipped from this region. Following the outbreak, average retail prices of romaine lettuce have declined somewhat compared to the same period a year ago, possibly reflecting curtailed demand. This chart is drawn from data discussed in the ERS Vegetables and Pulses Outlook released in April 2018.
Wednesday, May 16, 2018
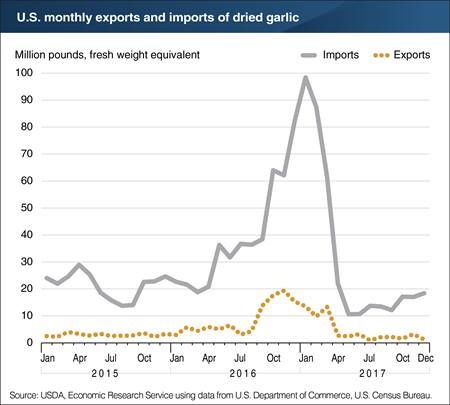
In late 2016 to early 2017, the amount of dried garlic imported to and exported from the United States rose above historical levels. The spike in U.S. garlic trade was precipitated by events in China, the world’s largest producer of garlic. Relatively low supply and high fresh garlic prices in 2016 incentivized Chinese farmers to increase production in 2017, ultimately leading to excess supply and a decline in global fresh garlic prices. This oversupply also impacted the market for dried garlic, viewed as a high value-added outlet for fresh garlic, and international prices for dried garlic fell as well. U.S. imports began to climb around May 2016 and peaked in January 2017 at approximately 98 million pounds. Before and during this period, China accounted for over 95 percent of all dried garlic imported into the United States. U.S. exports of dried garlic also rose during this period. Much of the growth in U.S. dried garlic shipments was to markets such as Peru, India, Portugal, and Greece, where U.S. exports were previously limited due to typically high competition from China. As global prices rose back to normal levels by mid-2017, U.S. dried garlic trade returned to historical levels. This chart appears in the ERS Vegetables and Pulses Outlook newsletter released in April 2018.
Monday, November 27, 2017
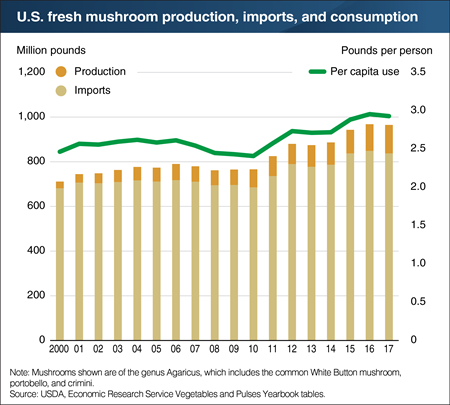
Over 97 percent of the mushrooms produced in the United States fall under the genus known as Agaricus, which includes the common White Button mushrooms, often seen in grocery stores and salad bars, as well as portobello and crimini mushrooms. While some mushrooms are grown for processing uses (canned, dried, and frozen), 88 percent are sold in the fresh market. On average, Americans consume roughly 3 pounds of fresh Agaricus mushrooms each year. Of the amount consumed, 87 percent is produced domestically in States like California and Pennsylvania. A growing share is imported, moving from 4 percent of domestic consumption in 2000 to 13 percent in 2017. Mushroom consumption increased each year since 2013, but fell slightly in 2017, with domestic production falling by just over 1 percent. Even with that decline, however, per capita consumption of Agaricus mushrooms increased by nearly 22 percent since 2010. Additionally, modest increases in wholesale prices since 2016 resulted in increased value to producers despite the reduced output. This chart appears in the ERS Vegetables and Pulses Outlook newsletter, released in October 2017.
Monday, October 30, 2017
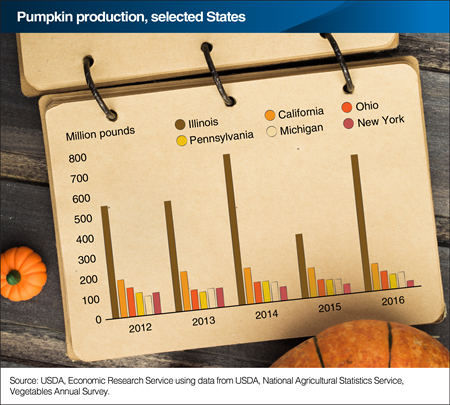
With Halloween soon approaching, many consumers spent the weekend searching for pumpkins at the nearest pumpkin patch. Pumpkin production is widely dispersed throughout the United States. All U.S. States produce some pumpkins, but according to the 2012 U.S. Census of Agriculture, about one-half of pumpkin acres were grown in six States. Illinois is consistently the Nation’s largest pumpkin producer, the majority of which are used for pies and other processed foods. Record rainfall devastated the State’s pumpkin crop in 2015, but Illinois production rebounded in 2016. All other reported States produce primarily decorative (or carving) pumpkins, and all but New York saw around 20 percent decreases in production during 2012-16. New York production stands out, however, having dropped 50 percent over the time period. While 2017 production has not yet been surveyed, media reports indicate a strong Midwest crop but challenges for some growers in New York and Pennsylvania who were hit with cold, wet weather that is less optimal for pumpkin growth. This chart is drawn from data presented in the ERS Pumpkins: Background & Statistics page.
Friday, September 8, 2017
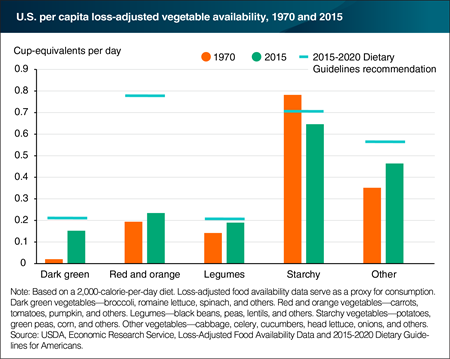
The 2015-2020 Dietary Guidelines for Americans recommend that people on a 2,000 calorie-per-day diet consume 2½ cup-equivalents (cup-eq) of vegetables per day. A cup-eq of vegetables is generally equal to 1 cup of raw or cooked vegetables or vegetable juice, or 2 cups of raw leafy greens. The Guidelines include recommended amounts of five vegetable subgroups (dark green, red and orange, legumes, starchy, and other) and advise Americans to consume a variety of vegetables from each subgroup. According to ERS’s loss-adjusted food availability data (a proxy for consumption), the average American consumed 1.72 cup-eq of vegetables and legumes per day in 2015—69 percent of the daily recommendation for a 2,000 calorie-per-day-diet—and up from 1.49 cup eq in 1970. While starchy vegetable consumption declined by 17 percent (mostly due to drops in fresh potatoes and canned corn), daily dark green vegetable consumption grew from 0.02 cup-eq in 1970 to 0.15 cup-eq in 2015. Romaine and leaf lettuce and fresh broccoli were the largest contributors, reflecting the growing demand for salads and fresh vegetables. Consumption of legumes and other vegetables increased, closing in on the Guidelines’ recommendations. Red and orange vegetable consumption grew to 0.23 cup-eq per day in 2015, but is still just 30 percent of the recommendation. The data for this chart are from ERS’s Food Availability (Per Capita) Data System, updated July 26, 2017.
Thursday, August 31, 2017
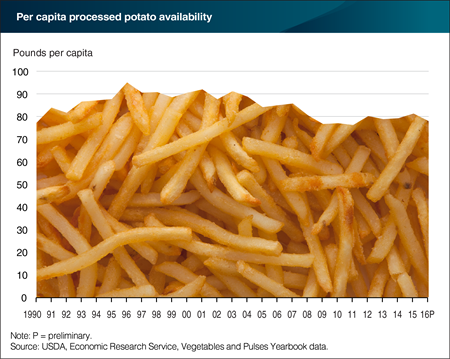
Processed vegetables make up roughly 44 percent of total per capita availability of vegetables in the United States. Potatoes (including frozen, chips, dehydrated, and canned) are the leading processed vegetable commodity available per capita. In 2016, there were over 75 pounds of processed potatoes available per capita. Since 1970, availability of processed potatoes has surpassed fresh potatoes in the United States. Spurred by the innovation of frozen French fry processing techniques in the 1950s and the increasing popularity of fast food chains, processed potatoes have composed 70 percent of total U.S. potato availability since 2010. The trend for processed potato availability has been sloping downward, however, since its peak in the mid to late 1990s. This gradual decline may indicate that Americans are shifting away from consuming processed vegetables in general. The 2015-2020 Dietary Guidelines for Americans cautions consumers from consuming excess saturated fats and sodium. This chart is adapted from a chart in the Amber Waves article, "Newly Updated ERS Data Shows 2016 Production, Trade Volume, and Per Capita Availability of Vegetables and Pulses," released in August 2017.
Tuesday, August 8, 2017
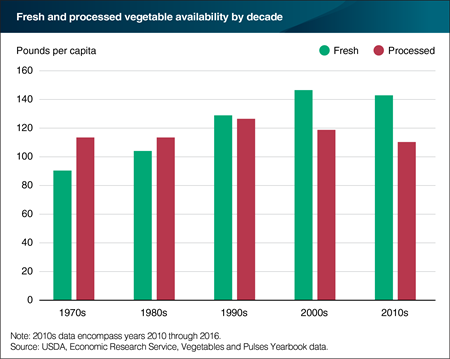
Decade averages of per capita availability of fresh and processed vegetables show that fresh vegetable availability increased from around 90 pounds per person in the 1970s to a high of almost 150 pounds per person in the 2000s. Although per capita fresh vegetable availability is down slightly in the current decade (data are through 2016), average availability is still well above the 1990s and earlier decades. Processed vegetable per capita availability tells a slightly different story; remaining relatively flat between 110 and 130 pounds per capita since the 1970s. Since the peak in the 1990s, processed vegetable availability has trended downwards. For both fresh and processed vegetable categories, tomatoes and potatoes are the most popular. In the processed category, tomato and potato use have declined steadily since the mid-1990s. Additionally, since 1990, the per capita availability of fresh tomatoes has been steadily increasing, which suggests that some people may be shifting from processed to fresh preparations. This chart appears in the Amber Waves article, "Newly Updated ERS Data Shows 2016 Production, Trade Volume, and Per Capita Availability of Vegetables and Pulses," released in August 2017.
Tuesday, May 16, 2017
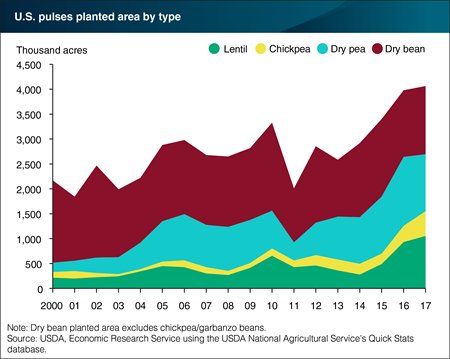
Led by expectations of surging seedings for lentils and chickpeas in 2017, aggregate U.S. area planted to pulse (the dry edible seed of a legume plant) crops is projected to reach a new record high of more than 4.06 million acres. Chickpea planted area is forecast to rise to nearly 500,000 acres, an increase of more than 53 percent compared to the prior year. This production growth is due to its sustained price strength and favorable returns relative to other crops such as wheat and corn. Lentil planted area is expected to expand by 13 percent to 1.055 million acres. In 10 years’ time, lentil planted area has more than tripled, boosted by expanding sales to India and growing domestic consumption, both of which have supported prices and encouraged plantings. Dry bean area planted, exclusive of garbanzo bean (also known as chickpeas) is projected to have a modest increase, up about 2 percent to 1.368 million acres and just slightly below the 10-year average area planted of 1.415 million acres. Dry peas are the only pulse crop projected to have fewer acres seeded in 2017. This chart appears in the ERS Vegetables and Pulses Outlook report, released on April 28, 2017.
Thursday, April 13, 2017
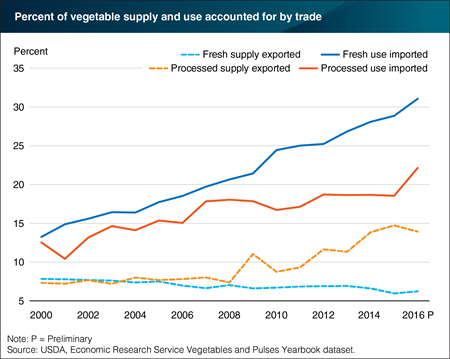
Trade plays a vital part in both fresh and processed vegetable markets, one that has increased over time. The United States imports a larger amount of fresh and processed vegetables than it exports. This is in contrast with U.S. agricultural trade as a whole, which consistently runs a trade surplus (exports exceed imports). In 2000, fresh and processed vegetable imports represented 12 percent of domestic use each. By 2016, the import share of domestic use had increased to over 30 percent for fresh vegetables and 22 percent for processed vegetables. The export market for vegetables has grown at a slower pace. Processed vegetable exports doubled between 2000 and 2016 from 7 to 14 percent of domestic use, while fresh vegetables decreased from 7 percent in 2000 to 6 in 2016. Growth in vegetable and other food commodity imports has been driven by expanding domestic demand and reduced trade costs like shipping and tariffs. Consumer preferences for year-round availability of seasonal foods and for vegetables not commonly grown domestically have also played a role in rising import shares. Cucumbers, tomatoes, and peppers are predominantly supplied by imports, while cauliflower has the largest export share. This chart is drawn from data in the annual ERS Vegetables and Pulses Yearbook tables updated in April 2017.
Tuesday, January 31, 2017
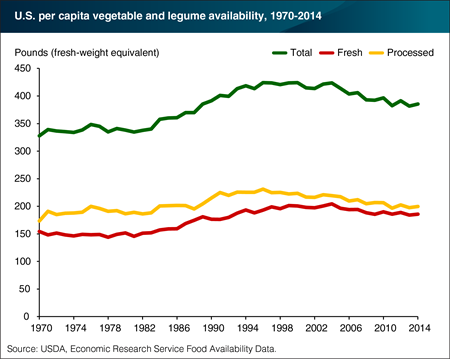
Vegetables and legumes are widely recognized as a good source of many vitamins, minerals, and dietary fiber. According to ERS’s food availability data, the supply of vegetables and legumes available to eat on a per person basis grew from 328 pounds in 1970 to 424 pounds in 2004. Between 2004 and 2014, per person vegetable and legume (pulses and beans) availability fell by 39 pounds to 385 pounds. Fresh and processed potatoes—frozen, canned, dehydrated, and chips—accounted for 59 percent of the 2004-14 decline. Over the longer period of 1970 to 2014, fresh vegetable availability rose by 20 percent; fresh bell peppers, tomatoes, onions, broccoli, and cucumbers combined grew by 36 pounds during that time. Per person availability of canned, frozen, and other processed vegetables and legumes increased from 174 pounds in 1970 to 225 pounds in 1998, then began a decline to 200 pounds in 2014. A version of this chart appears in the ERS report, U.S. Trends in Food Availability and a Dietary Assessment of Loss-Adjusted Food Availability, 1970-2014, released on January 27, 2017.
Thursday, November 17, 2016
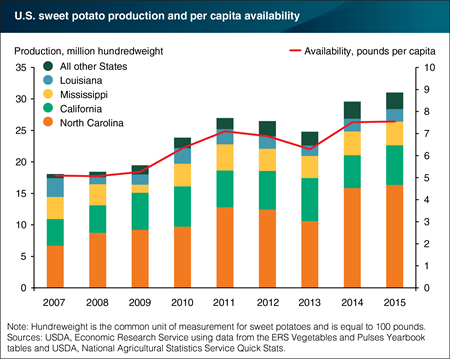
U.S. production of sweet potatoes has increased substantially in recent years, achieving a new record-high of 3.1 billion pounds in 2015—a 4.8- percent increase over 2014’s 3.0 billion pounds. The largest producer of sweet potatoes in the United States is North Carolina which harvested 1.6 billion pounds in 2015 and has been responsible for most of the gains in recent years. California, Mississippi, and Louisiana are also notable sweet potato-producing States. In 2014 and 2015, sweet potato production rose by an average of about 6 percent per year, bolstered by growth in exports and domestic demand. Between 2000 and 2015, domestic consumption of sweet potatoes grew considerably with per capita availability rising from 4.2 pounds to 7.5 pounds. The marked rise in domestic demand has been encouraged by promotion of the tuber’s health benefits. Sweet potatoes are a good source of fiber and vitamin C, and they are an especially rich source of vitamin A. This chart is drawn from the ERS Vegetables and Pulses Outlook report and the ERS Vegetables and Pulses data.
Monday, October 24, 2016
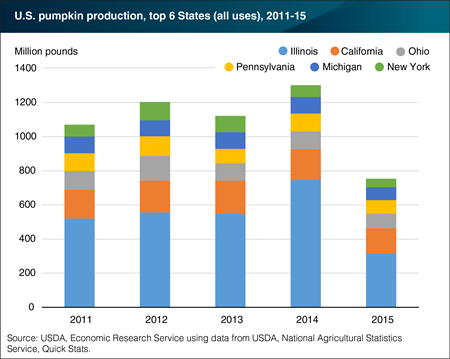
All U.S. States produce some pumpkins but about one-half of the total are grown in 6 States. In 2015, U.S. farmers in those States produced 753.8 million pounds of pumpkins. Production dropped over 40 percent from 2014 with a notable drop in acreage planted in Illinois. In June 2015 there were heavy rains in Illinois that significantly reduced pumpkin harvests. Despite this decline, Illinois remained the leading producer of pumpkins by acreage and output, with almost 80 percent of acres typically devoted to production for pie filling or other processing uses. Supplies from the remaining top five States are targeted toward the seasonal fresh market for ornamental uses and for home processing. In addition to traditional jack-o'-lantern types, demand for specialty pumpkins continues to expand as consumers look for new and interesting varieties such as Big Mack, Blue, Cinderella, Fairytale, White Howden, Knuckle Head, and heirloom varieties. This chart uses data from the ERS Vegetable and Pulses Yearbook dataset.
Thursday, September 22, 2016
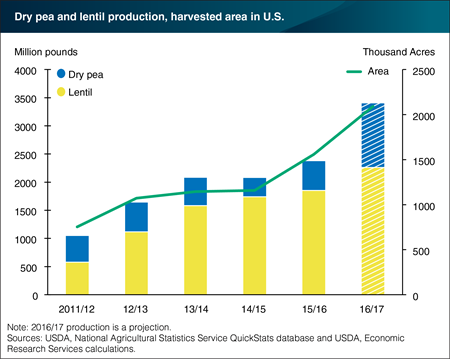
Dry pea and lentil harvested area for 2016 is estimated by the USDA, National Agricultural Statistics Service at slightly more than 2 million acres, a near 34 percent increase from the previous year, setting a new record. This surge is representative of the recent trend in expanded harvested area for both crops. Since 2011/12, harvested area has increased by an average of nearly 24 percent in each marketing year. Rising harvested area has supported growth in dry edible pea and lentil production, projected at more than 3.4 billion pounds for the 2016/17 marketing year. The number of acres planted to dry peas and lentils, and subsequently harvested, is correlated with decreases in prices for other commodities such as wheat, corn, and barley. Since 2013/2014, Wheat prices have fallen more than $3 per bushel, while corn and barley prices have fallen about $1.30 and $1.10 per bushel, respectively. In the same period, dry pea and lentil prices have generally increased, providing incentive for farmers to switch some acreage to dry peas and lentils. This chart is drawn from data reported in the ERS Vegetables and Pulses Outlook Newsletter released August 30, 2016.
Wednesday, August 17, 2016
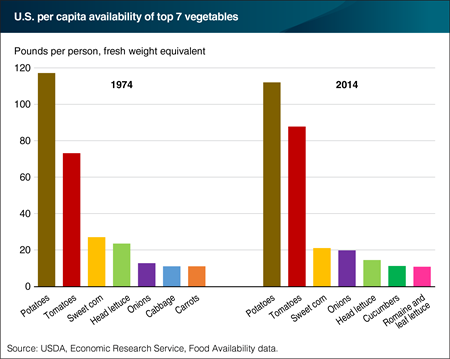
According to ERS’s food availability data, an average of 385.4 pounds of fresh and processed vegetables per person were available for U.S. consumers to eat in 2014, up from 334.1 pounds in 1974, but down from peak per capita vegetable availability of 424.3 pounds in 1996. Potatoes, tomatoes, and sweet corn were the three most popular vegetables in 1974 and remained the most popular in 2014. While per capita availability (a proxy for consumption) of potatoes and sweet corn has declined over the last four decades, per capita tomato availability grew from 73.2 pounds in 1974 to 87.8 pounds in 2014. Fresh tomato availability increased by 74 percent and canned tomatoes by 10 percent. Onion availability also grew from 12.7 to 19.7 pounds per person over 1974-2014. In 2014, cucumbers and romaine and leaf lettuce at 11.3 and 10.8 pounds per capita, respectively, replaced cabbage and carrots in the top 7 rankings. Head lettuce was the fourth most popular vegetable in 1974, but dropped to fifth in 2014, perhaps related to the growing popularity of romaine and leaf lettuce. The data for this chart come from the Food Availability data series, part of ERS’s Food Availability (Per Capita) Data System, updated August 3, 2016.
Wednesday, July 27, 2016
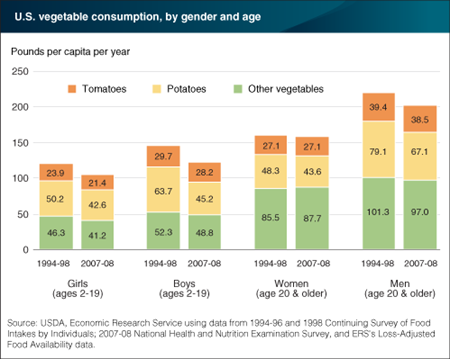
Americans’ consumption of vegetables has not increased, despite advice to the contrary from the health and nutrition community. A recent linking of ERS’s loss-adjusted food availability data with intake surveys reveals that total vegetable consumption fell across four U.S. age and gender groups between 1994-98 and 2007-08, though the decline for women was small. Much of the vegetable decline was driven by reduced consumption of potatoes. Boys had the largest drop; their potato consumption fell from 63.7 pounds (fresh-weight equivalent) per person per year in 1994-98 to 45.2 pounds in 2007-08. Intake of tomatoes—the second most consumed vegetable—held fairly steady for all age groups. When consumption of potatoes and tomatoes is subtracted from the mix, consumption of other vegetables by girls, boys, and men fell, too, but not as sharply as that of potatoes. For women, annual consumption of nonpotato and nontomato vegetables increased by 2.2 pounds per person. This chart appears in “A Closer Look at Declining Fruit and Vegetable Consumption Using Linked Data Sources” in the July 2016 issue of ERS’s Amber Waves magazine.
Wednesday, April 20, 2016
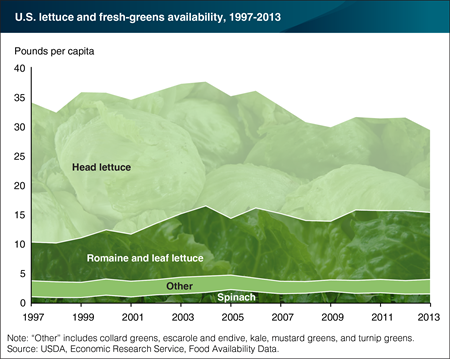
In 2013, 29.6 pounds per person of lettuce and fresh greens were available for domestic consumption, according to ERS’s Food Availability Data. Per-capita availability of lettuce and fresh greens declined by 22 percent from its high of 37.9 pounds per person in 2004. Much of the decrease is due to declining consumption of head lettuce. Head lettuce (iceberg) availability, at 14.1 pounds per person in 2013, has fallen by 41 percent from 24 pounds in 1997. At the same time, romaine and leaf lettuce availability has almost doubled, rising from 6.6 pounds per person in 1997 to 11.4 pounds in 2013. The growing popularity of prepackaged, ready-to-eat salad greens contributed to the rise in availability of romaine and leaf lettuce. Availability of other fresh greens (collard greens, escarole and endive, kale, mustard greens, and turnip greens) came in at 2.5 pounds per person in 2013, while fresh spinach availability was 1.6 pounds per person. The data for this chart come from the Food Availability data series in ERS's Food Availability (Per Capita) Data System.
Wednesday, October 28, 2015
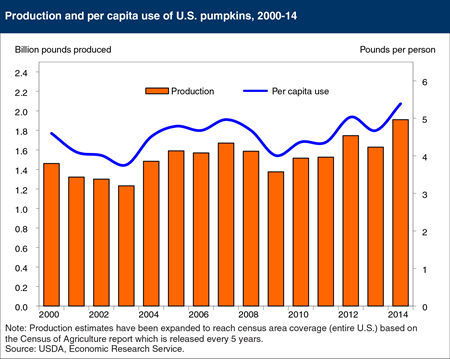
Over the past 15 years, U.S. production of pumpkins for all uses (jack-o-lanterns, fresh and processed food, seed, and other) rose 31 percent, from 1.46 billion pounds in 2000 to 1.91 billion pounds in 2014. The popularity of urban pumpkin patches, fall festivals, ornamental use of pumpkins, and seasonal cuisine have contributed to growing demand for pumpkins in the last two decades. On a per-capita basis, pumpkin use—for both food and ornamental uses—increased 17 percent during this period (adjusted for feed use, shrinkage, and marketing loss) from 4.6 pounds in 2000 to 5.39 pounds in 2014. The ornamental jack-o-lantern has long been the most popular use of pumpkins, but pumpkins are also found in a wide array of food items and beverages, including pumpkin pie, bread, muffins, soup, spice-flavored treats, and seasonal beers. This chart is based on information provided in 2015 Vegetables and Pulses Yearbook.


