
Newly Updated ERS Data Show 2016 Production, Trade Volume, and Per Capita Availability of Vegetables and Pulses
- by Travis Minor
- 8/7/2017
In April 2017, ERS released its annual update of the Vegetables and Pulses Yearbook. According to the latest report on crop values from USDA’s National Agricultural Statistics Service, vegetable sales at the farm level accounted for over $14.6 billion in 2015, making up approximately 8.2 percent of the total value of principal crops (includes field crops, fruits, tree nuts, and vegetables) produced.
The Vegetable and Pulses Yearbook provides data, both contemporary and historic, on domestic production, trade volumes, and per capita food availability for a wide variety of specialty crops. The data include estimates for fresh and processed vegetables, such as canned tomatoes or frozen vegetables, as well as detailed information on specific commodity markets. Fresh, canned, frozen, and some dried vegetables are included covering potatoes, onions, mushrooms, tomatoes, and many others. Pulses, such as dry beans, dry peas, and lentils, are included in the yearbook data as well. A useful feature of the yearbook data is the ability to track trends and changes in these commodities over time.
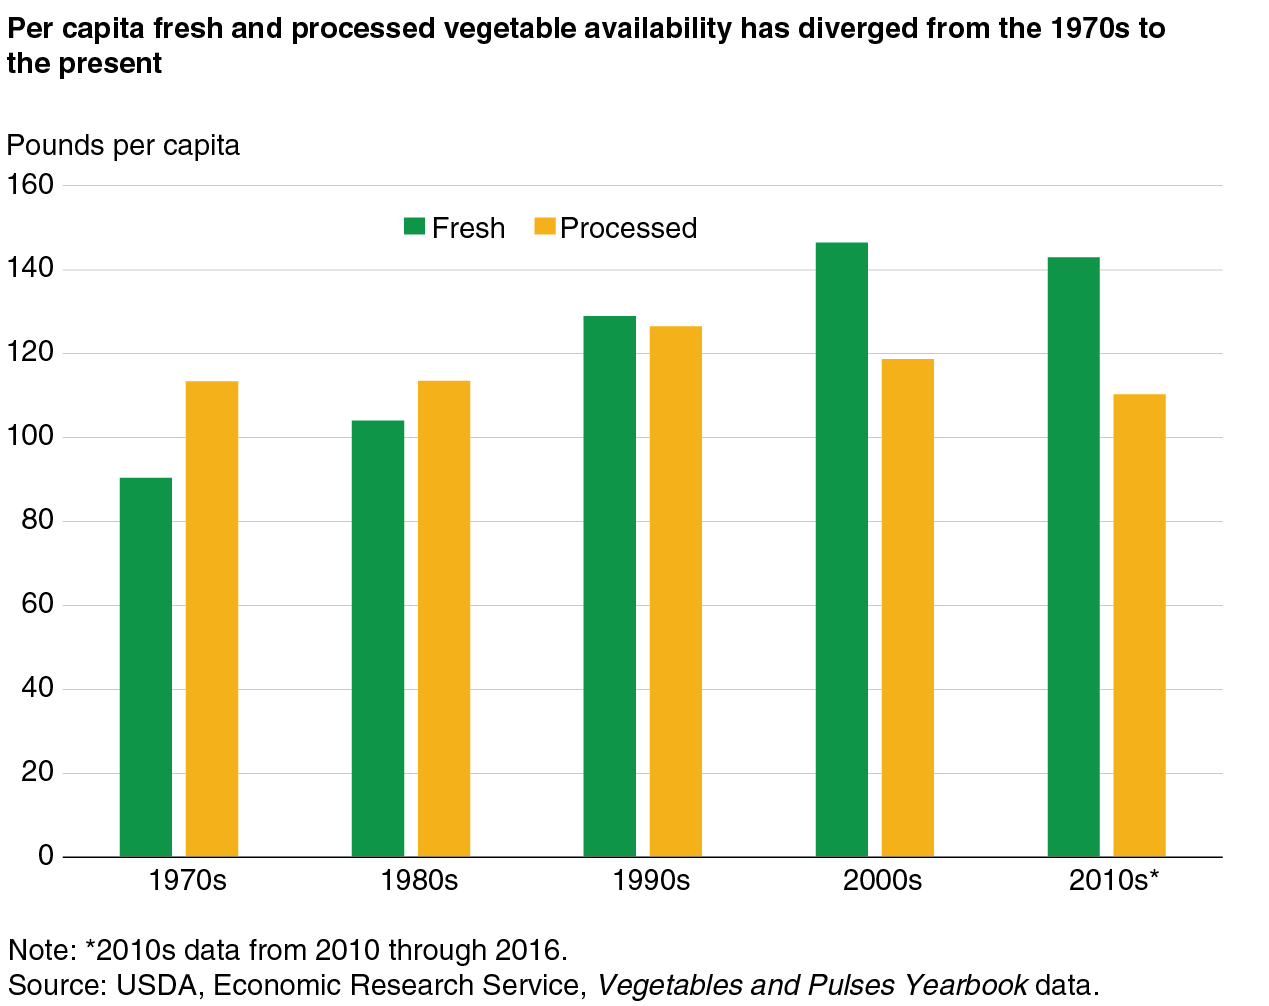
Decade averages of per capita availability of fresh and processed vegetables show that fresh vegetable availability increased from around 90 pounds per person in the 1970s to a high of almost 150 pounds per person in the 2000s. Per capita fresh vegetable availability is down slightly in the current decade; although data are only through 2016, average availability is still well above the 1990s and earlier decades. Processed vegetable per capita availability tells a slightly different story, remaining relatively flat between 110 and 130 pounds per capita. Since the peak in the 1990s, processed vegetable availability has trended downwards.
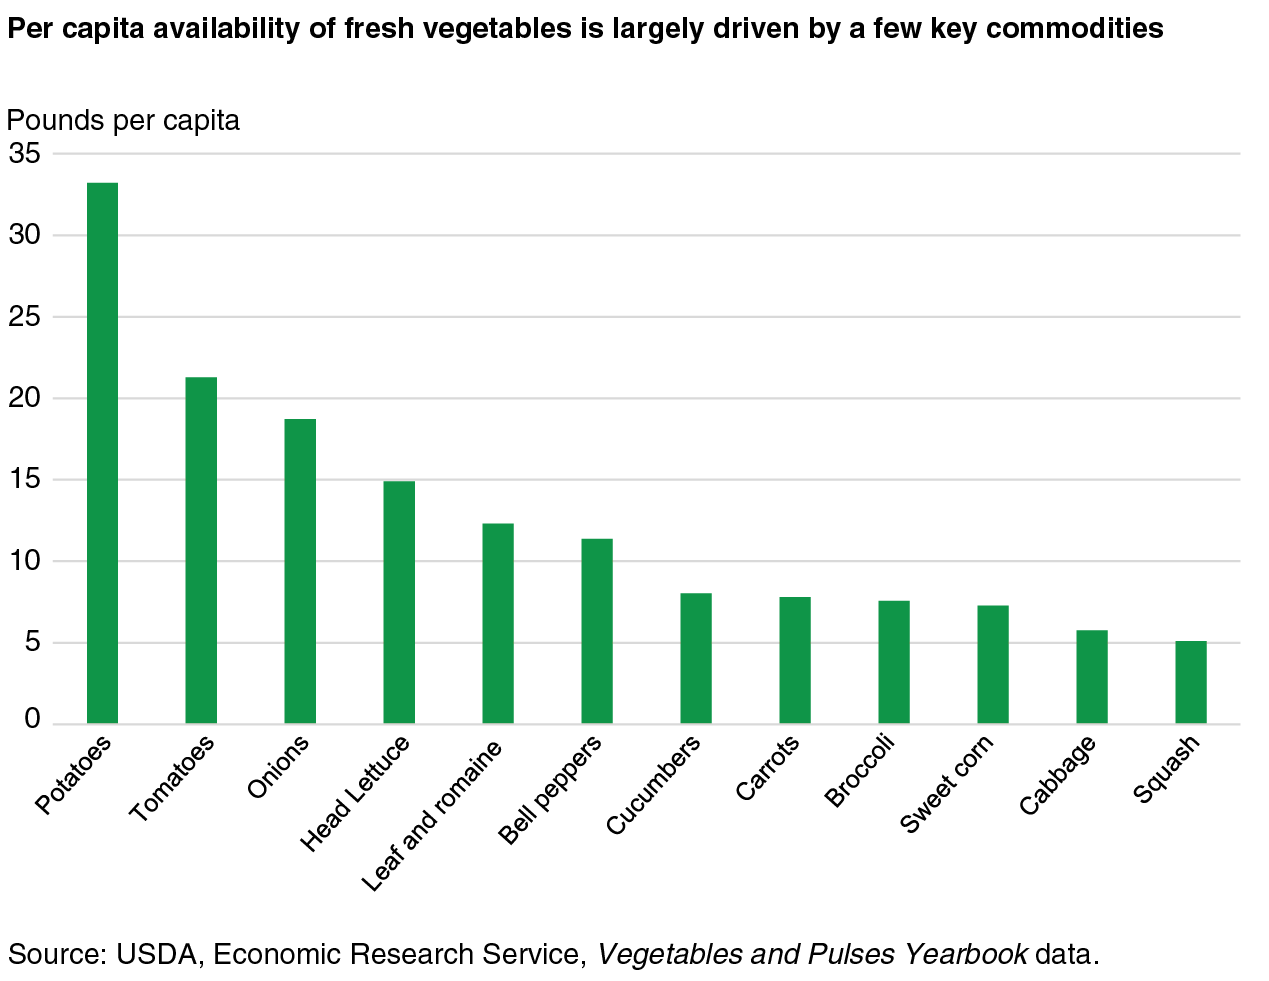
For fresh vegetables, per capita numbers are largely driven by a few dominant commodities. Fresh potatoes and tomatoes both account for over 20 pounds available per person, with potatoes reaching well over 30 pounds per person. Onions, lettuce (both head and romaine/leaf), and bell peppers are all available at over 10 pounds per person. These vegetables, largely considered traditional staples of the American diet, have consistently been the top fresh commodities available per capita in recent years. With respect to domestic production, potatoes are the leading vegetable crop in the United States (excluding sweet potatoes), contributing about 15 percent of farm sales receipts for vegetables. U.S. fresh field-grown tomato production has trended higher over the past several decades with the most substantial growth occurring during the 1980s. As they have for decades, Florida and California annually account for two-thirds to three-fourths of all commercially produced fresh-market tomatoes in the United States.
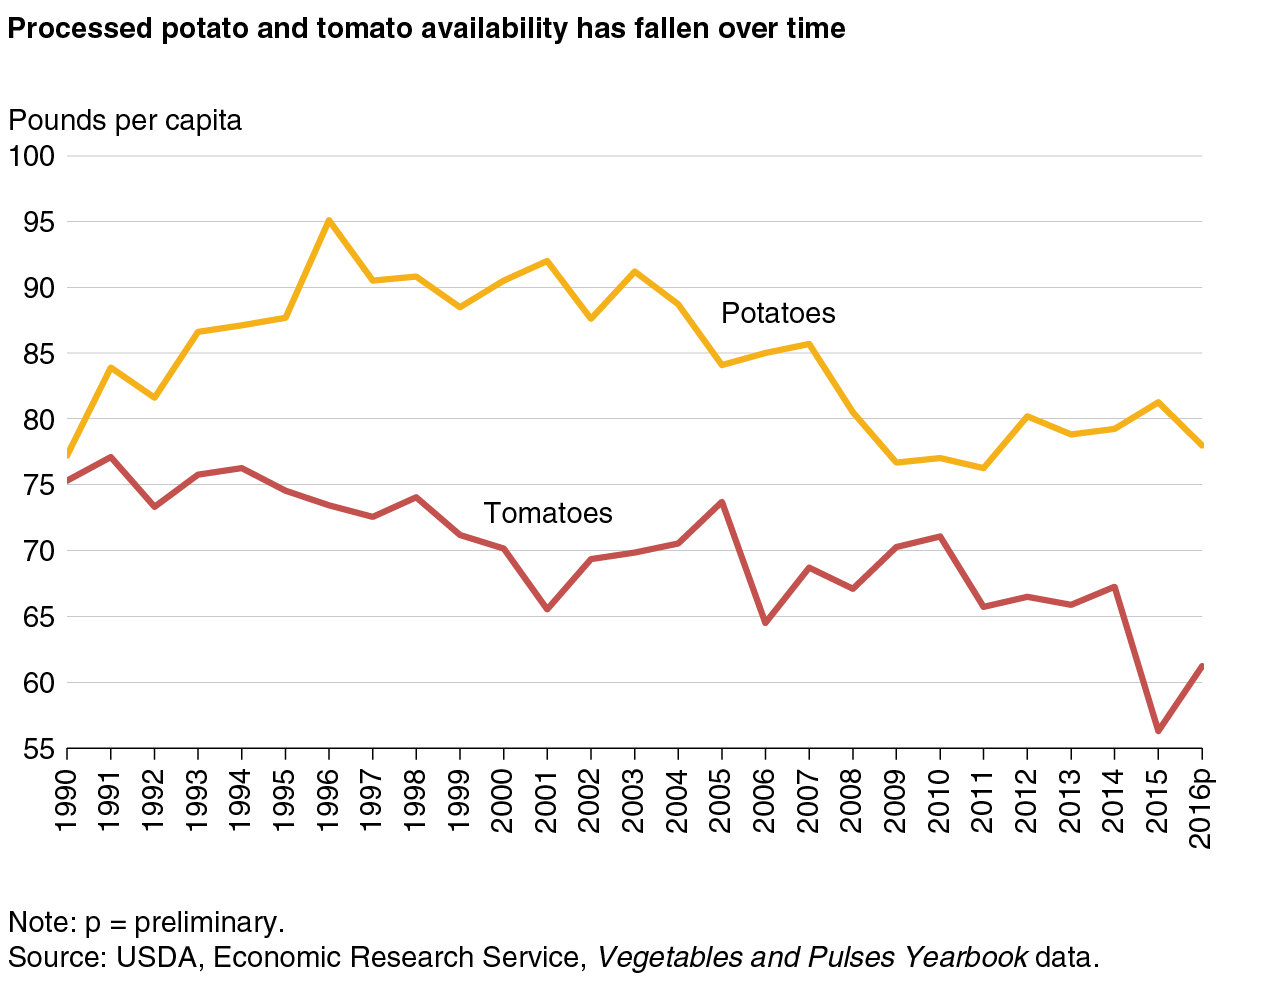
For processed vegetables, potatoes (including frozen, chips, dehydrated, and canned) and tomatoes are the two leading commodities in terms of per capita availability. In 2016, there were over 60 pounds of tomatoes available per capita, and potatoes were even higher at more than 75 pounds per person. Since 1970, availability of processed potatoes has surpassed fresh in the United States. Spurred by the innovation of frozen French fry processing techniques in the 1950s and the increasing popularity of fast food chains, processed potatoes have composed 70 percent of total U.S. potato availability since 2010. Processed tomatoes, often found in spaghetti sauces, salsas, and many other products, have accounted for 76 percent of all tomato availability since 2010. The trend for processed tomato and potato availability has been sloping downward, however, since their respective peaks in the mid to late 1990s. This gradual decline may indicate that Americans are shifting away from consuming processed vegetables in general. In 2010 and again in 2013, the National Institute of Medicine released guidance on reducing sodium in the American diet and cited processed foods as a significant contributor. Additionally, since 1990, the per capita availability of fresh tomatoes has been steadily increasing, which suggests that some people may be shifting from processed to fresh preparations. More recently, drought conditions in California, where approximately 95 percent of the U.S. processed tomato production is located, have slowed output.
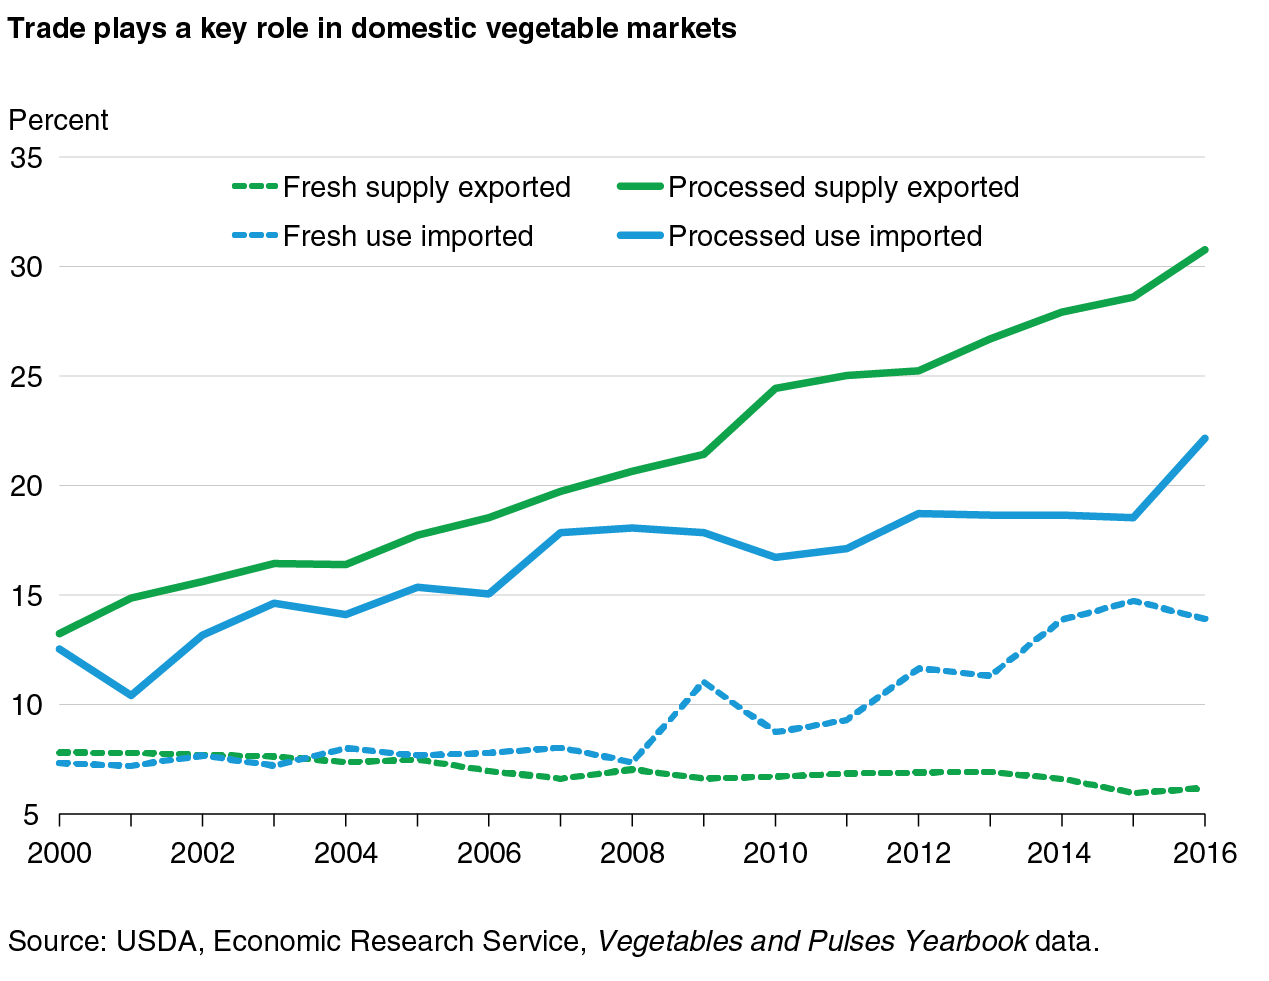
Trade plays a vital part in both fresh and processed vegetable markets, one that has increased over time. The United States imports more fresh and processed vegetables than it exports. This is in contrast with U.S. agricultural trade as a whole, which consistently runs a trade surplus (exports exceed imports). In 2000, fresh and processed vegetable imports represented 12 percent of domestic availability each. By 2016, the import share of domestic availability increased to over 30 percent for fresh vegetables and 22 percent for processed vegetables. The export market for vegetables has grown at a slower pace. Processed vegetable exports doubled between 2000 and 2016 from 7 to 14 percent of supply, while fresh vegetables decreased from 7 percent in 2000 to 6 percent in 2016. Growth in vegetable and other food commodity imports has been driven by expanding domestic demand and reduced trade costs like shipping and tariffs. Consumer preferences for year-round availability of seasonal vegetables have also played a role in rising import shares. Cucumbers, tomatoes, and peppers are increasingly supplied by imports, although domestic production remains robust as well. Cauliflower has the largest export share of supply.
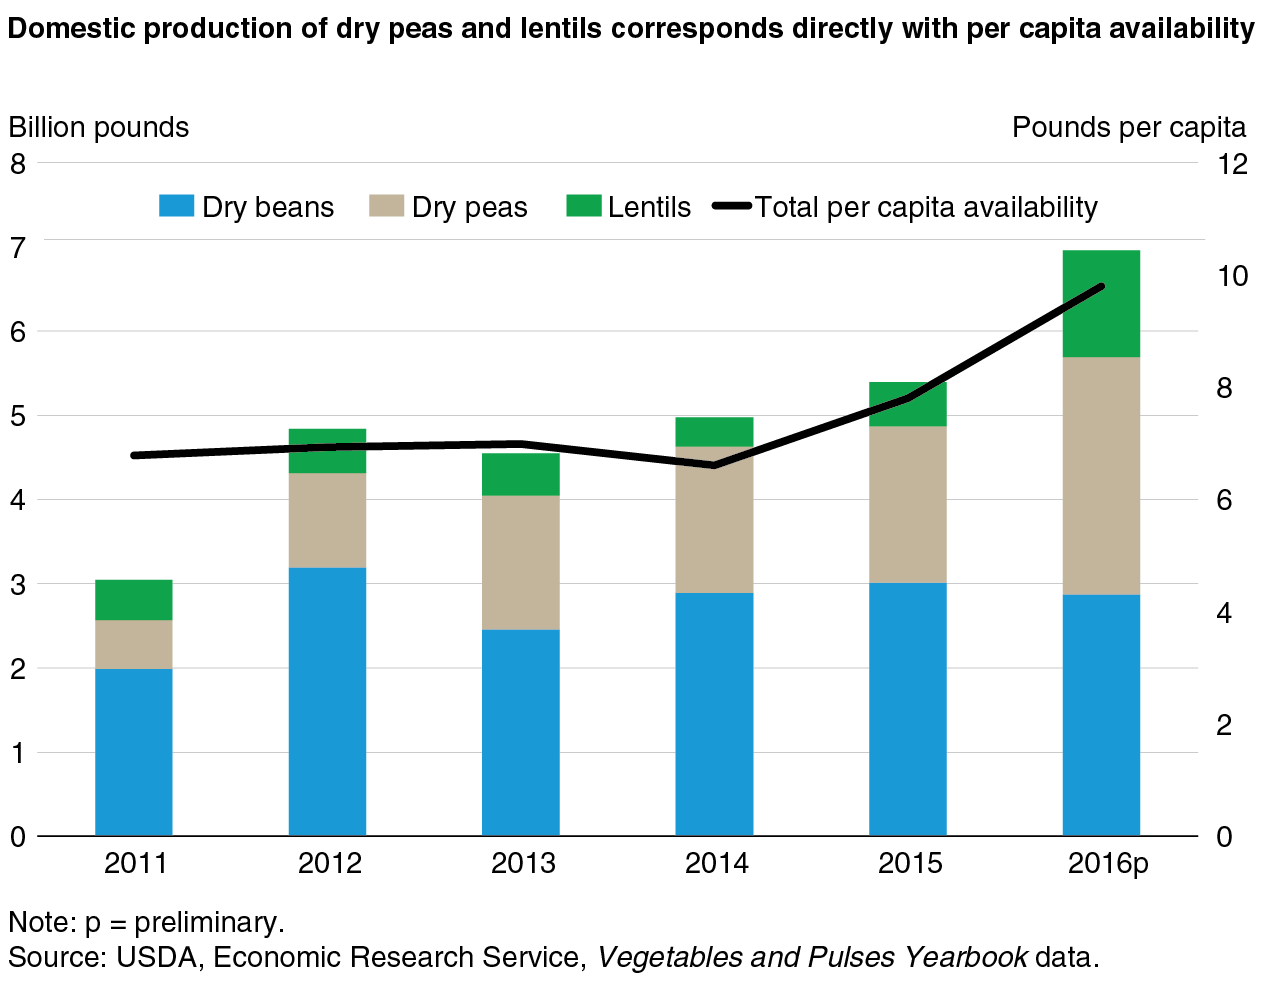
The Vegetable and Pulses Yearbook goes into further detail on commodities beyond only fresh and processed vegetables. Domestic production and per capita availability for dry beans, dry peas, and lentils are also available. In 2016, approximately 7 billion pounds of pulses were produced, a nearly 30-percent increase over the previous year. As a result, per capita availability reached an all-time high of nearly 10 pounds per person. The 2016 gains were the result of significant growth in dry pea and lentil production, which increased by 52 percent and 141 percent in 2016, respectively. Domestic production has traditionally been supported by strong global demand for U.S. exports, but the country’s share of production for exports has trended downward in recent years. Since 2014, an increasing share of production has remained in the United States, indicating rising domestic demand. Recently, the 2010 Dietary Guidelines for Americans recommended more frequent consumption of dry peas and lentils, and the growing interest in gluten-free foods has supported expanding domestic production.
For additional information about the topics discussed in this article, download the 2016 Vegetable and Pulses Yearbook, which contains data specific to fresh vegetable; processed vegetable; and dry bean, pea, and lentil markets.
This article is drawn from:
- Vegetables and Pulses Data - Vegetables and Pulses Yearbook Tables. (n.d.). U.S. Department of Agriculture, Economic Research Service.
You may also like:
- Bond, J.K. (2017, February 6). Pulses Production Expanding as Consumers Cultivate a Taste for U.S. Lentils and Chickpeas. Amber Waves, U.S. Department of Agriculture, Economic Research Service.
- Huang, S., Calvin, L., Coyle, W.T., Dyck, J., Ito, K., Kelch, D., Lucier, G., Perez, A., Pollack, S., Pryor, S., Regmi, A., Shane, M., Shields, D., Stout, J. & Worth , T. (2004). Global Trade Patterns in Fruits and Vegetables. U.S. Department of Agriculture, Economic Research Service. WRS-0406.
- Bentley, J. (2017). U.S. Trends in Food Availability and a Dietary Assessment of Loss-Adjusted Food Availability, 1970-2014. U.S. Department of Agriculture, Economic Research Service. EIB-166.