ERS Charts of Note
Subscribe to get highlights from our current and past research, Monday through Friday, or see our privacy policy.
Get the latest charts via email, or on our mobile app for  and
and 
Thursday, July 19, 2018
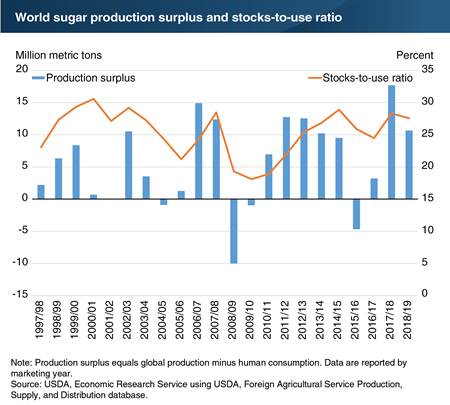
Favorable growing conditions in South and Southeast Asia raised global sugar production forecasts for the 2017/18 marketing year, increasing the estimated production surplus for the global sugar market to its highest level in several decades. Production surplus can be defined as global sugar production minus the amount of sugar consumed each year. A positive production surplus results in rising stocks of sugar held in storage around the world, which puts downward pressure on global sugar prices. Production in 2018/19 is projected to decrease from the previous year but still be sizable by historical standards due to higher production forecasts for India and Thailand, in particular. As a result, supplies are projected to outpace use and increase global stocks-to-use ratios, limiting opportunities for price increases in world sugar futures markets, which have been falling since October 2016. The average world futures contract price in the April-to-June quarter was 11.91 cents per pound, which was 21.5 percent lower than the previous year. This chart appears in the ERS Sugar and Sweeteners Outlook newsletter released in June 2018.
Monday, June 4, 2018
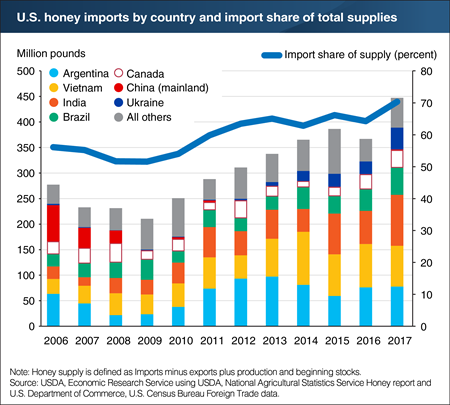
Domestic production of honey is significantly exceeded by the amount of honey imported into the United States each year. Since 2006, more than half of all honey supplied in the United States was imported, and that number reached 70 percent in 2017. This represents the highest import level on record, continuing the longer term trend of a growing share of honey supplies coming from foreign sources. The largest foreign source of honey in 2017 was India, outpacing Vietnam and Argentina, the second and third leading sources, respectively. Although U.S. honey imports were recorded for many different countries in 2017, the top five foreign suppliers (Vietnam, Argentina, India, Brazil, and Ukraine) accounted for 77 percent of total imports. While imports have risen in quantity as well as in share of supply, national average honey prices for domestic honey remain high. In 2017, wholesale prices averaged 215.6 cents per pound, just below the 2014 record of 216.1 and more than twice as high as prices in the mid-2000s. This chart appears in a special article in the ERS Sugar and Sweeteners Outlook released in May 2018.
Thursday, January 18, 2018
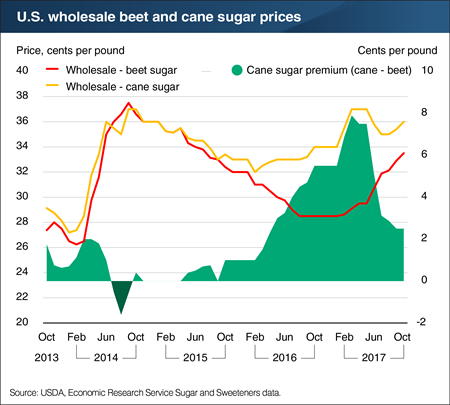
One of the major developments in the U.S. sugar market during the 2016/17 marketing year occurred when the beet and cane sugar sectors returned to the levels of the broader market. Ending stocks for cane and beet sugars diverged significantly in 2015/16, with extremely tight cane sugar supplies and ample beet sugar inventories. This resulted in large price differences in refined cane and beet sugars. The price differential also played an important role in reconciling the divergences in the cane and beet sugar sectors. Wholesale spot prices of refined cane sugar began the year at a 5.5-cent per pound premium to refined beet sugar. That premium grew to nearly 8 cents by March before narrowing to 2.5 cents by the end of the year. With demand for sugar continuing to grow steadily, the relative beet sugar price discount was one of the key market drivers that spurred the large beet sugar deliveries and drew down inventories. While the price differential narrowed, refined cane sugar prices finished the year higher than they started, reflecting both the constrained supplies in the cane sugar sector and the broader U.S. refined sugar market. This chart is drawn from the special article Beet and Cane Sugar Inventories Return to Comparable Levels After Divergence in 2015/16, published in the November ERS Sugar and Sweeteners Outlooknewsletter.
Tuesday, September 26, 2017
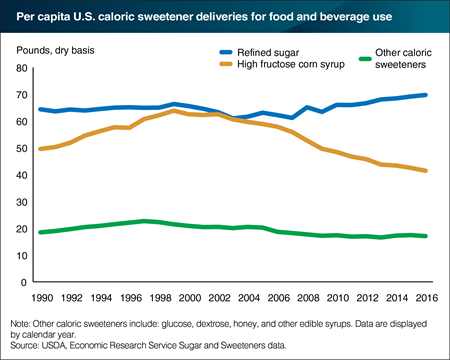
Total caloric sweetener deliveries in 2016 totaled over 41 billion pounds on a dry weight basis (water content removed), down marginally from 2015. This translates to 128.1 pounds per person, a 0.7-percent decline from the previous year. Refined sugar continues to make an increasing share of per capita deliveries as corn-based sweeteners, particularly high-fructose corn syrup (HFCS), has trended downward since the early 2000s. On a per person basis, deliveries of HFCS have fallen 34 percent since 2000, while refined sugar increased by 6 percent over the same period. This period coincided with higher input prices from global commodity price spikes; the growth of the corn-based domestic ethanol production; increased availability of sugar supplies because of increased imports from Mexico; and greater attention to food labels by food manufacturers and consumers. Other caloric sweeteners, such as the corn sweeteners dextrose and glucose, honey, maple syrup, molasses syrups, and fructose syrups, make up a relatively minor share of total deliveries. This chart appears in the ERS Sugar and Sweeteners Outlook newsletter, released in August 2017.
Tuesday, February 14, 2017
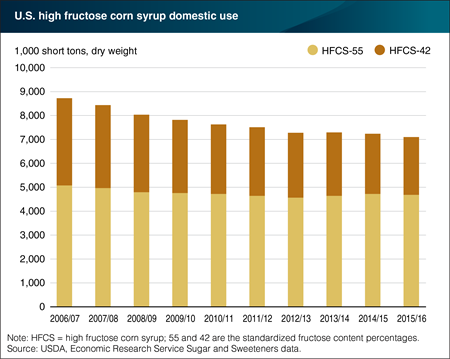
Domestic use of high fructose corn syrup (HFCS) has been generally in decline since 2006. With the exception of marketing year 2013/14, when there was a slight uptick, usage numbers generally leveled off since 2012/13. The latest yearly data, however, indicates that domestic HFCS use may still be trending lower. HFCS is marketed in two primary compositions: HFCS-55 and HFCS-42. HFCS-55 contains 55 percent fructose and is used primarily in soft drinks, while HFCS-42, which contains 42 percent fructose, is used in a broader range of goods, including other beverages and baked foods. The long-term decline in HFCS consumption has primarily been the result of a reduction in HFCS-42. The cause of this decline has been driven by consumer demand for healthier alternatives, rising exports, and greater availability of substitutes. This chart appears in the ERS Sugar and Sweeteners Outlook report released in January 2017.
Friday, January 13, 2017
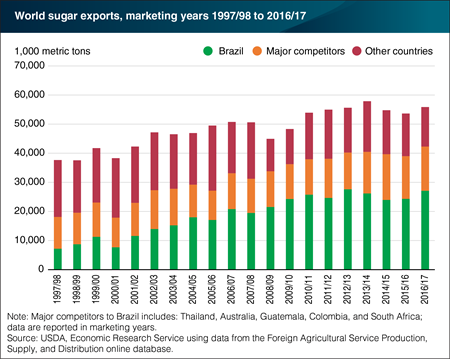
Brazil is projected to remain the dominant sugar exporter in the 2016/17 marketing year, accounting for nearly 49 percent of global exports. Exports from Brazil are projected to increase by 11 percent in 2016/17 as more of the country’s sugarcane crop is produced into sugar, rather than ethanol. Exports declined in 2013/14 and 2014/15, before a small rebound in 2015/16, as financial returns for ethanol incentivized production away from sugar production. Even with periods of declining exports, Brazil has remained the most important producer in global sugar trade, accounting for no less than 44 percent of market share since 2008/09. Major competitors, such as Thailand, have increased their market share, particularly in the past 5 years, and are projected to increase their exports by 4 percent in 2016/17. This chart draws from the Sugar and Sweeteners Outlook report published in December 2016.
Wednesday, January 4, 2017
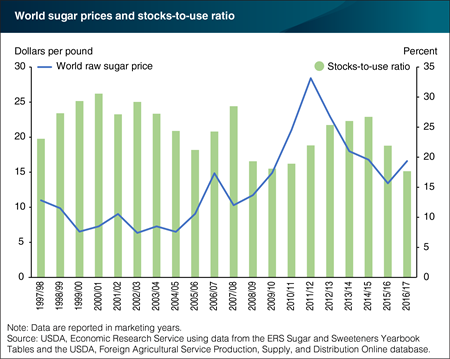
World raw sugar prices increased in the 2015/16 marketing year after a four-year decline from 2010/11. Projections for 2016/17 support higher prices continuing through 2017. Projected human sugar consumption is expected to be greater than production for the second consecutive year, after a prolonged period of surplus production during the years of declining prices. Due to the global production deficit, global inventories are projected to be drawn down again in 2016/17, resulting in the lowest stocks-to-use ratio in more than 20 years. Through the first two months of 2016/17, raw sugar prices have been 50 percent higher than the previous year, due in large part to the relatively tight supply and use market outlook. This chart draws from the Sugar and Sweeteners Outlook report published in December 2016.
Tuesday, November 8, 2016
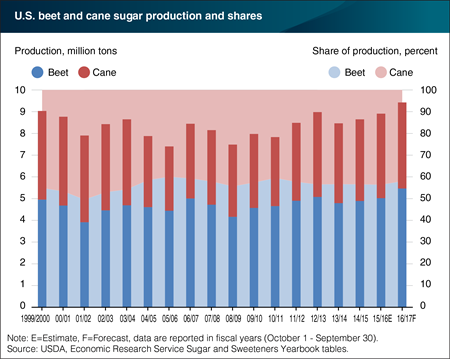
U.S. sugar production is forecast to reach a fiscal year record in 2016/17 of 9.4 million short tons, raw value (STRV), 5.5 percent above the current estimate of 8.9 million STRV for 2015/16, and nearly 400,000 more than the previous record set in 1999/00. Sugar production in the United States is sourced from two distinct crops, sugarbeets and sugarcane. The majority – an average of 56.4 percent since 2000/01 – has come from sugarbeets. The leading producer of sugarbeets in the United States is Minnesota, followed by Idaho, North Dakota, and Michigan. Those four States represented 83 of production in 2015. Sugarcane production is even more concentrated, with 91 percent of production occurring in Florida and Louisiana. Domestic production for both sources of sugar increased in 2014/15 and is forecast to continue growing in 2015/16 and 2016/17. A significant portion of the production gains is expected to come from higher yields and sugar recovery rates, particularly for sugarbeets in 2016/17. This chart uses data from the ERS Sugar and Sweeteners Yearbook tables and draws from the Sugar and Sweeteners Outlook report published in October 2016.
Thursday, October 27, 2016
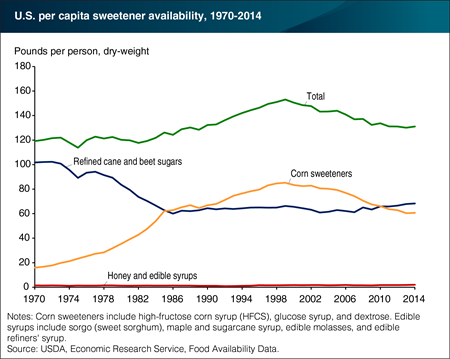
In 2014, 131.0 pounds per person of caloric sweeteners were available for consumption by U.S. consumers, down from a high of 153.1 pounds per person in 1999. Availability of total corn sweeteners (high-fructose corn syrup (HFCS), glucose syrup, and dextrose) contributed to the drop, falling from its peak of 85.2 pounds per person in 1999 to 60.7 pounds per person in 2014. High corn prices, price competition with refined cane and beet sugars and other caloric sweeteners, as well as shifting preferences among consumers and food manufacturers have contributed to this decline. Availability of refined cane and beet sugars fell from 101.8 pounds per person in 1970 to 62.7 pounds per person in 1985, then remained relatively flat for the next two and a half decades. Refined sugar availability began to rise in 2011, surpassing corn sweetener availability and reaching 68.3 pounds per person in 2014. Rising honey imports have contributed to recent increases in per capita honey availability. In 2014, per capita honey availability stood at 1.2 pounds and per capita availability of edible syrups was 0.8 pounds. This chart is from ERS’s Ag and Food Statistics: Charting the Essentials, updated October 11, 2016.
Friday, October 7, 2016
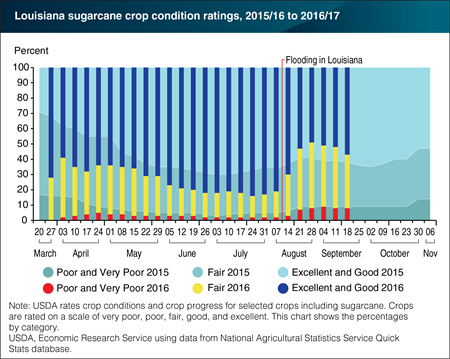
Heavy rainfall and severe flooding in Louisiana affected the State’s sugarcane crop, according to USDA crop condition ratings, which were rated positively prior to the severe weather. Lafayette, LA, centered near the state’s main sugarcane region, recorded August precipitation that was 5 times larger than normal. Following the floods, significant portions of the crop were downgraded from Excellent or Good ratings to Fair. Additionally, sugarcane rated Poor or Very Poor increased from 2 percent prior to the severe weather to a peak of 9 percent afterward. Fortunately, crop ratings have improved during September and are currently comparable with crop conditions in 2015/16. With the sugarcane harvest in Louisiana typically beginning in late September and continuing through January, Louisiana sugar production in 2015/16 is still expected to be about 15 percent larger than the previous year due to increased harvested acreage and sugarcane yields in the State. This chart appears in the ERS Sugar and Sweeteners Outlook report in September 2016.
Monday, August 22, 2016
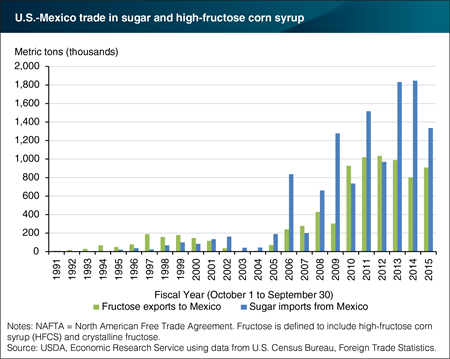
Agreement by the United States and Mexico to implement the provisions of the North American Free Trade Agreement (NAFTA) with respect to bilateral trade in sugar and sweeteners starting in fiscal year 2008 led to a substantial increase in this trade. During fiscal years 2011-15, U.S. sugar imports from Mexico averaged about 1.5 million metric tons per year—contributing about 12 percent of the U.S. sugar supply—and U.S. exports of high fructose corn syrup (HFCS) to Mexico averaged about 950,000 metric tons—equal to about 12 percent of U.S. production. Agreements reached in December 2014 to suspend U.S. antidumping and countervailing duty investigations on sugar imports from Mexico imposed new restrictions on the quantity, price, and composition of U.S. imports of Mexican sugar. However, these measures still allow for larger volumes of trade than prevailed before 2008, and before the start of NAFTA’s implementation back in 1994. This chart is from the ERS report, A New Outlook for the U.S.-Mexico Sugar and Sweetener Market released on August 11, 2016.
Wednesday, June 8, 2016
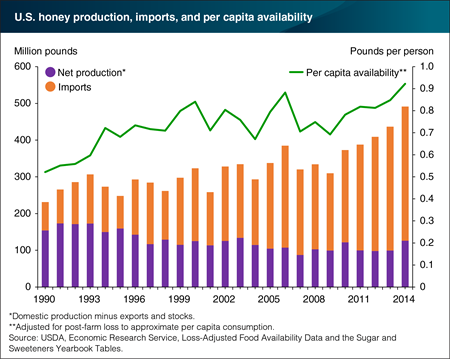
While Americans’ per capita consumption of all caloric sweeteners has been falling for the last decade and a half, per capita honey consumption has been on an upward trend. In 2014, Americans consumed an average of 0.9 pound of honey per person, according to ERS’s Loss-Adjusted Food Availability data, up from 0.5 pound in 1990. Much of the increased honey consumption is imported honey. Honey imports in 2014 totaled 365.3 million pounds, up from an average of 104.4 million pounds per year in the early 1990s. Domestic net production of honey (domestic production minus exports and stocks), once at an average of 167.9 million pounds in the early 1990s, has fallen to an average of 106.7 million pounds in the last 7 years, despite short-term increases in 2010 and 2014. Weakening colony strength from multiple honey bee health challenges and changes in land use patterns are among the factors contributing to declining domestic honey production. The data for this chart come from the Loss-Adjusted Food Availability data series in ERS's Food Availability (Per Capita) Data System and the Sugar and Sweeteners Yearbook Tables.
Thursday, May 12, 2016
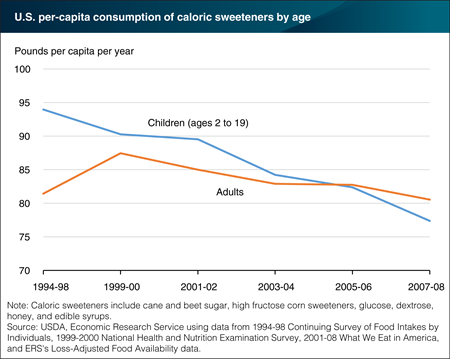
A recent linking of ERS’s loss-adjusted food availability data with intake surveys from 1994-2008 reveals that American children are doing a better job of cutting down on sugary beverages and other sweetened foods than adults are. In 1994-98, children ages 2 to 19 consumed 94.0 pounds per person per year of caloric sweeteners compared with 81.4 pounds consumed by adults. Over the next decade, per-capita consumption of caloric sweeteners by children fell to 77.4 pounds per year, while adults’ consumption rose before returning to 1994-98 levels. Caloric sweeteners include cane and beet sugar, high fructose corn sweeteners, glucose, dextrose, honey, and edible syrups—common ingredients in sweetened beverages, baked goods, spaghetti sauces, ketchups, and a host of other processed foods. Over 1994-2008, consumption of sweeteners declined across all income and race/ethnicity groups, with Hispanics and other races/ethnicities consuming less caloric sweeteners than non-Hispanic Whites and non-Hispanic Blacks. The data for this chart and similar information on 62 other food commodities can be found in the ERS report, U.S. Food Commodity Consumption Broken Down by Demographics, 1994-2008, March 2016.
Tuesday, February 23, 2016
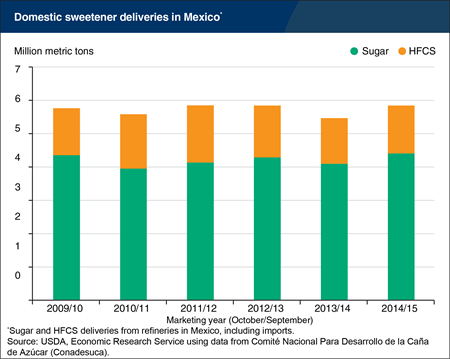
Domestic deliveries of sugar and high-fructose corn syrup in Mexico—a useful indicator of human consumption—rebounded in the most recent marketing year (October/September) after declining about 6.5 percent the previous year. In January 2014, Mexico imposed a tax of one peso per liter on soft drinks in an effort to curb obesity by reducing consumption, and this is believed to be at least partially behind the reduction in sweetener deliveries observed during the 2013/14 marketing year. From October 2014 through September 2015, sweetener use by Mexican food processors returned to levels equivalent to just before the tax was imposed. Food consumption patterns change slowly and reflect many factors, so time and additional research is needed to fully understand the effect of Mexico’s soft-drink tax. This chart is based on the February 2016 Sugar and Sweeteners Outlook.
Monday, February 1, 2016
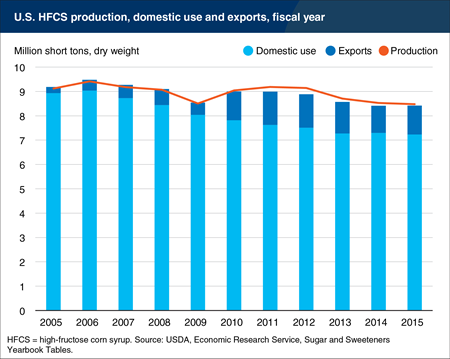
Domestic use of high-fructose corn syrup (HFCS) declined 0.8 percent in the 2014/15 fiscal year (October 1-September 30) to 7.2 million short tons, continuing a decade-long decline. Since 2004/05, domestic use has fallen by 19.1 percent, and it is down 21.8 percent since its peak in 2001/01. Production is trending lower as well, but by a smaller magnitude: 2014/15 production was 7.1 percent below 2004/05 levels and down 10.6 percent from its peak in 1999/2000. Several factors have contributed to this decline, including high corn prices, price competition with refined sugar and other caloric sweeteners, and changing preferences of consumers and food manufacturers. As domestic deliveries have fallen, HFCS exports have become an increasingly important segment of the market. In particular, exports to Mexico increased substantially beginning in 2009/10, shortly after the integration of U.S. and Mexican sweetener markets under NAFTA. This chart is based on the January 2016 Sugar and Sweeteners Outlook.
Friday, June 26, 2015
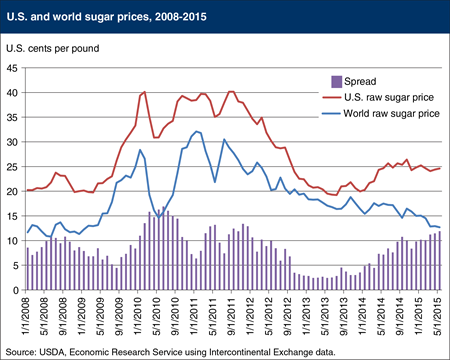
World raw sugar prices have fallen steadily since January 2011, and in May 2015 reached their lowest point since January 2009 due to growing production surpluses and the weakening Brazilian currency. U.S. raw sugar prices have also fallen relative to the record-high levels seen between 2010 and 2012, but have trended higher over the past year. Since the integration of U.S. and Mexican sweetener markets under NAFTA in 2008, U.S. and world prices had tracked more closely. However, those prices began diverging in March 2014 when the U.S. domestic sugar industry filed an anti-dumping and countervailing duty investigation against Mexican sugar imports, resulting in a December 2014 agreement that limits the volume of Mexican sugar entering the United States. With these new limitations on Mexican imports, the spread between U.S. and world prices has increased in recent months, though remains within ranges seen in recent years. This chart is based on the June 2015 Sugar and Sweeteners Outlook.
Tuesday, November 4, 2014
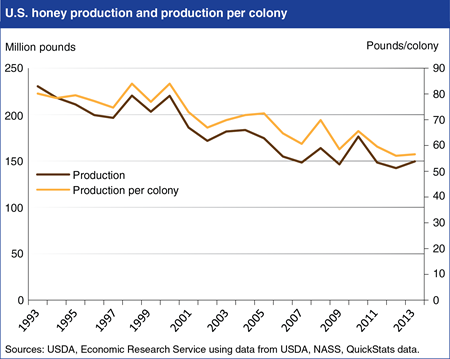
In 2013, U.S. beekeepers produced 149.5 million pounds of honey, down about 35 percent from levels produced 20 years earlier. Over the same period, per-colony honey production also declined from 80.2 pounds in 1993 to a record low 56 pounds in 2012. Declining production has occurred despite rising prices; the average farm-gate price of honey increased 98 percent from $1.01 per pound in 2006 to $1.99 per pound in 2012. The causes of falling per-colony honey output are uncertain, but likely include a combination of factors. The relatively recent onset of multiple honey bee health challenges may be weakening colony strength (measured in numbers of adult bees) and productivity. Also, the value and quantity of honey produced by foraging bees is affected by the crops from which bees gather nectar. A higher percentage of colonies are now being used to pollinate almond orchards instead of crops that are more productive for commercial honey production, potentially lowering the average volume of useable honey per colony. Other factors may include the effect of prolonged dry weather in some U.S. regions on forage availability, and a drop in summer foraging area in the Northern Plains and Upper Midwest because of declining acreage enrolled in USDA’s Conservation Reserve Program and expanding area planted to corn and soybeans. Find these data and additional analysis in Sugar and Sweeteners Outlook: October 2014.
Friday, May 30, 2014
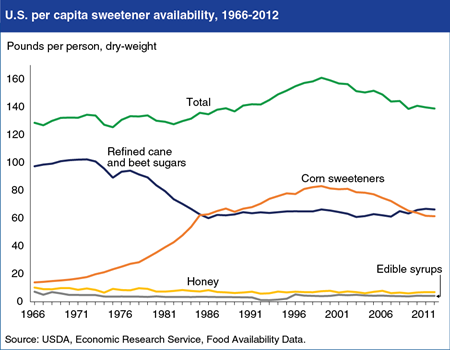
In 2012, 138.9 pounds per capita of caloric sweeteners were available for consumption by U.S. consumers, down from the high of 160.9 pounds in 1999. This decline is largely due to a drop in the availability of total corn sweeteners (high fructose corn syrup (HFCS), glucose syrup, and dextrose), which has fallen from its high of 83.1 pounds per person in 1999 to 61.4 pounds in 2012, partly reflecting rising sales of bottled water and artificially-sweetened, sugar-free drinks. Since 1983, refined cane and beet sugar availability has averaged around 66 pounds per person, down from 102.3 pounds in 1972. In 2010, refined sugar availability surpassed that of corn sweeteners. Per capita honey and edible syrup availability in 2012 were 6.9 and 4.2 pounds, respectively, despite an 85 percent increase in average retail honey prices since 2007. This chart is from ERS’s Ag and Food Statistics: Charting the Essentials, updated May 19, 2014.
Thursday, March 13, 2014
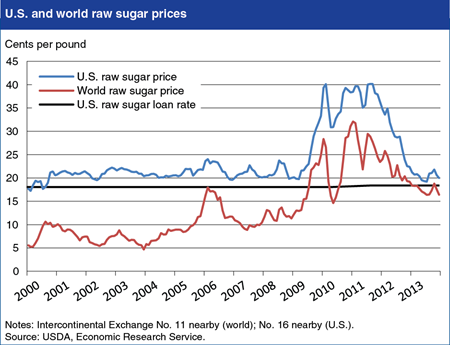
Since 2007/08 (October/September marketing year), U.S. raw sugar prices have become more closely linked to world prices, with important implications for U.S. sugar policy. During 2000-2007, U.S. and world raw sugar prices were largely unrelated with a correlation coefficient of just .0516, but during 2008-2013, the correlation increased to .862. A key factor behind the increased correlation between U.S. and world raw sugar prices is that since 2008, world prices have increased and generally trended well above the U.S. loan rate—the price at which sugar producer prices are supported in the domestic market. With the world price, rather than the loan rate, supporting U.S. prices, U.S. raw sugar prices have moved up and generally remained above the loan rate, a shift that has also reduced the need for USDA to support producers by purchasing excess sugar for resale to ethanol producers, as required by Farm Act legislation. A second factor has been the increase in U.S. sugar imports from Mexico following implementation of the North American Free Trade Agreement. Mexican exports to the United States are competitive with those of other U.S. suppliers, helping to increase the correlation between U.S. and world prices, even when world prices fall below the sugar loan rate. Find this chart and additional analysis in Sugar and Sweeteners Outlook: February 2014.
Friday, January 3, 2014
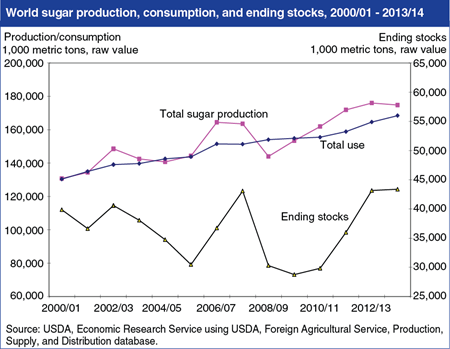
Since the 2010/11 marketing year, surplus global sugar production—the difference between total world production and total use—has led to the accumulation of stocks and downward pressure on world sugar prices. The global surplus is forecast to be smaller in 2013/14, as lower world prices in 2012/13 contribute to slightly lower production and greater consumption in 2013/14, however stocks are forecast to remain relatively high. India and China are the main sources of increased stocks, both in tonnage and in terms of percentage change; stock accumulation has also been significant in the European Union and Thailand. With stocks relative to use remaining above average, world sugar prices are forecast to be lower than levels seen in recent years. The U.S. sugar sector has gained significant support from high world prices until this past year and, although U.S. policies will limit domestic impacts, the outlook for lower world prices will have implications for U.S. producers and processors and USDA programs that provide domestic price support. This chart can be found in Sugar and Sweeteners Outlook: December 2013.


