ERS Charts of Note
Subscribe to get highlights from our current and past research, Monday through Friday, or see our privacy policy.
Get the latest charts via email, or on our mobile app for  and
and 
Wednesday, July 15, 2020
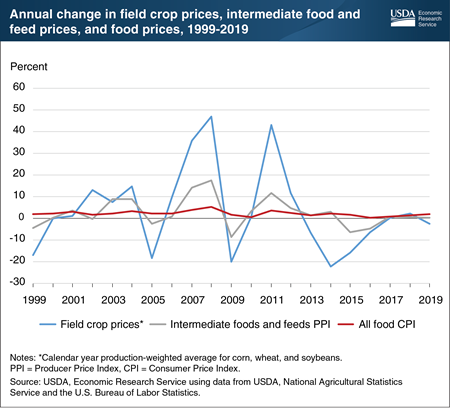
Disruptions to food production and changes in demand due to the COVID-19 pandemic may impact prices for farm products. However, farm price swings generally have less impact on food prices as food gets closer to the dinner table. In 2009, the last year of the Great Recession, the production-weighted farm price of the field crops corn, wheat, and soybeans decreased by 20 percent. That same year, the Producer Price Index for intermediate foods and feeds, such as wheat flour and soybean oil, fell 9 percent. Retail food prices—including foods purchased in stores and eating places—rose 2 percent. Converting farm commodities into consumer foods, such as corn flakes and restaurant meals, requires additional production inputs such as labor, energy, packaging, transportation, and marketing. Thus, farm commodity prices are a small piece of retail food prices, particularly for highly processed products and restaurant offerings. Another reason retail food prices tend to be less volatile than farm and wholesale prices is the structure of the grocery retail industry, with large chains often using marketing contracts to smooth price spikes in the products they purchase and keep retail food prices more stable. While the data in this chart predate the COVID-19 pandemic and do not reflect its impacts on food supply chains and food demand, examining past food-price dynamics can provide insight into current events. This chart appears in the Economic Research Service’s May 2020 Amber Waves article, “Retail Food Prices Less Volatile Than Farm and Wholesale Prices.”
Friday, June 5, 2020
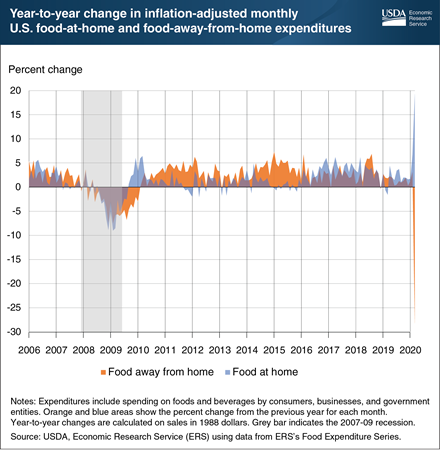
Errata: On July 22, 2020, this Chart of Note was reposted with corrected data for February 2020 and March 2020.
The COVID-19 pandemic and resulting stay-at-home orders have dramatically impacted Americans’ food spending. Inflation-adjusted expenditures at grocery stores, supercenters, convenience stores, and other retailers (food at home) were 6.7 percent higher in February 2020 compared with February 2019. This same spending was 19.3 percent higher in March 2020 compared with March 2019. Comparing spending for the same month accounts for seasonal food spending patterns. Inflation-adjusted February 2020 expenditures at eating-out establishments—restaurants, school cafeterias, sports venues, and other eating-out places—were 3.1 percent higher than February 2019 expenditures. March 2020 food-away-from-home spending was 28.3 percent lower than March 2019 spending. During the Great Recession of 2007-09, expenditures on both food at home and food away from home decreased, with the largest decrease in February 2009. Unlike previous economic shocks, the COVID-19 shock has led to a pronounced substitution from food away from home towards food at home. This substitution is in part due to the stay-at-home orders and the fact that many eating-out businesses are operating at a limited capacity or have ceased operations completely. The data in this chart are from the Economic Research Service’s Food Expenditure Series data product, updated June 2, 2020.
Friday, April 24, 2020
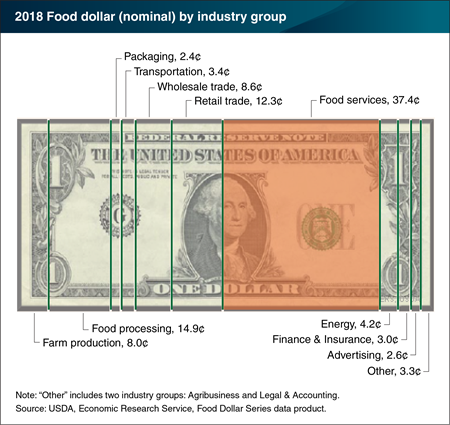
In 2018, restaurants and other eating-out places claimed 37.4 cents of the U.S. food dollar—foodservices’ highest share during the 1993 to 2018 period covered by the Economic Research Service’s (ERS’s) Food Dollar Series and the seventh consecutive annual increase. More eating out in 2018 was also reflected in the 12.3-cent retail-trade share claimed by grocery stores and other food retailers, which was at its lowest level in the 1993-2018 period. The only other industry groups that showed an increasing food dollar share in 2018 were farm producers, up 0.3 cents to 8 cents in 2018, and energy industries, such as electric power and natural gas, which increased their share for the third consecutive year, up to 4.2 cents. ERS’s annual Food Dollar Series provides insight into the industries that make up the U.S. food system and their contributions to total U.S. spending on domestically-produced food. ERS uses input-output analysis to calculate the value added, or cost contributions, from 12 industry groups in the food supply chain. Annual shifts in food dollar shares between industry groups occur for a variety of reasons, ranging from the mix of foods that consumers purchase to relative input costs; implications of this year’s COVID-19-related shelter-in-place restrictions will be reflected in the 2020 food dollar. This chart is available for the years 1993 to 2018, and can be found in ERS’s Food Dollar Series data product, updated on March 23, 2020.
Wednesday, April 1, 2020
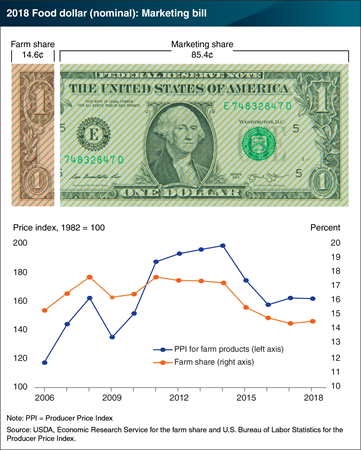
On average, U.S. farmers received 14.6 cents for farm commodity sales from each dollar spent on domestically produced food in 2018, up slightly from 14.4 cents in 2017. Known as the farm share, this amount rose for the first time since 2011. This increase coincides with a flattening in average prices received by U.S. farmers (as measured by the Producer Price Index for farm products) in 2017 and 2018, after steep declines in 2015 and 2016. A preliminary 2017 farm share estimate published last year was also 14.6 cents, but the 2017 figure has been revised downward to 14.4 cents in the newly-released updates. The Economic Research Service (ERS) uses input-output analysis to calculate the farm and marketing shares from a typical food dollar, including food purchased both at grocery stores and at restaurants and other eating-out places. The marketing share covers the costs of getting domestically produced food from farm to points of purchase, including costs related to packaging, transporting, processing, and selling to consumers at grocery stores and eating-out places. The relatively low farm share measures for 2015-18 occurred during a 7-year trend of increases in the portion of the food dollar going to the foodservice industry. Farmers receive a smaller share from eating-out dollars because of the added costs for preparing and serving meals at eating-out places, so more food-away-from-home spending also drives down the farm share. The data for this chart can be found in ERS’s Food Dollar Series data product, updated on March 23, 2020.
Wednesday, March 25, 2020
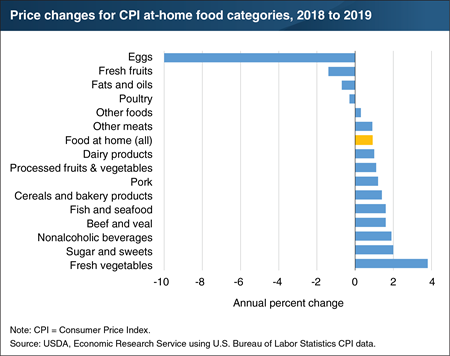
The year 2019 was another year of low price inflation at the grocery store. As measured by Consumer Price Index data, average annual food-at-home prices in 2019 were 0.9 percent higher than in 2018. Most food categories posted modest price index increases of between 0.3 and 2.0 percent. Egg prices decreased the most, falling by 10.0 percent between 2018 and 2019, although eggs represent a small share of total grocery spending. Fresh fruits, fats and oils, and poultry had modest price decreases. The price index for fresh vegetables increased the most. Fresh vegetable prices were up 3.8 percent in 2019, mainly because of bad weather in several growing areas. People are often surprised when fruit and vegetable prices move in different directions as they did in 2019. This can happen because most production of these crops occurs on highly specialized farms that are located in different areas of the country, such as lettuce farms in Arizona or blueberry farms in Michigan. Bad weather in Idaho could increase the price of potatoes, but it will have almost no effect on the price of Florida oranges. This chart appears in the Food Prices and Spending section of the Economic Research Service’s (ERS) Ag and Food Statistics: Charting the Essentials. For ERS’s latest food price information and 2020 forecasts, see our Food Price Outlook data product.
Thursday, February 20, 2020
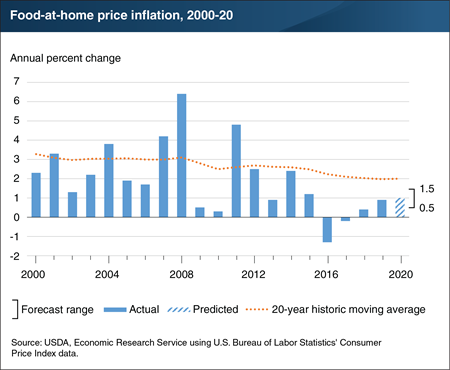
Grocery store food prices in the United States have seen low inflation or deflation since 2015. Given current conditions, ERS expects a continuation of the low inflation trend into 2020. Food-at-home prices are forecast to increase between 0.5 and 1.5 percent, below the current 20-year historic average of 2.0 percent. The previous period of low inflation in retail food prices, which occurred in 2009 and 2010, was due largely to the economy-wide downturn caused by the 2007-09 Great Recession. The current period of low food-price inflation, however, is taking place during a time of U.S. economic expansion. Contributing factors for this period of low food-price inflation include retail pricing strategies, efficient food supply chains, slow wage growth, and relatively low oil prices. Within grocery sub-categories, price changes in 2020 are expected to vary. More information on ERS’s monthly food price forecasts can be found in the ERS Food Price Outlook data product, which will be updated on February 25, 2020.
Friday, December 20, 2019
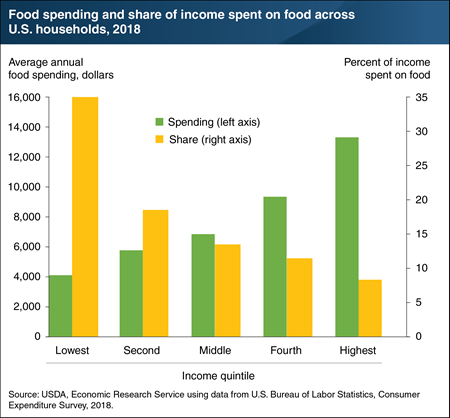
As their incomes rise, households spend more money on food, but it represents a smaller share of their overall budgets. In 2018, households in the lowest income quintile, with an average 2018 after-tax income of $11,695, spent an average of $4,109 on food (about $79 a week). Households in the highest income quintile spent an average of $13,348 on food (about $257 a week). The three-fold increase in spending between the lowest and highest income quintiles is not the result of a three-fold increase in consumption. Rather, people choose to buy different types of food as they gain more disposable income. One example is dining out. One-third of food spending by the lowest income quintile goes to food away from home, whereas food away from home accounts for half of total food spending for the top quintile. Even with a shift to more expensive food options, as income increases, the percent of income spent on food goes down. In 2018, food spending represented 35.1 percent of the bottom quintile’s income, 13.6 percent of income for the middle quintile, and 8.2 percent of income for the top quintile. This chart appears in the Food Prices and Spending section of ERS’s Ag and Food Statistics: Charting the Essentials data product.
Friday, December 6, 2019
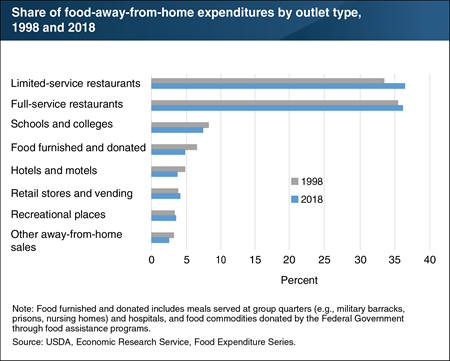
ERS’s Food Expenditure Series points to Americans’ growing appetite for eating out. Expenditures at food-away-from-home establishments—restaurants, school cafeterias, sports venues, and other eating places—totaled $930.6 billion in 2018, compared with the $780.9 billion spent on food at home in grocery stores, supercenters, convenience stores, and other retailers. Full-service restaurants with wait staff and limited-service restaurants—where food is ordered and paid for at a counter or drive-through window—dominate the food-away-from-home market. Full-service restaurants’ share of the food-away-from-home market rose from 35.6 percent in 1998 to 36.3 percent in 2018, while limited-service restaurants posted a larger increase in market share from 33.6 to 36.6 percent over the same period. The share of food-away-from-home expenditures occurring at hotels and motels and at schools and colleges declined between 1998 and 2018, while the shares at recreational places and at retail stores and vending increased slightly. The data in this chart, along with more information on U.S. food sales and expenditures, can be found in ERS’s Food Expenditure Series data product.
Friday, October 25, 2019
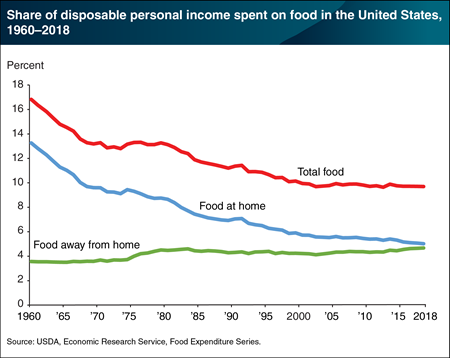
In 2018, Americans spent an average of 9.7 percent of their disposable personal incomes (DPI) on food. After falling from 16.8 percent in 1960 to 9.9 percent in 2000, the share of DPI spent on total food by the typical American has ranged from 9.6 to 9.9 percent. The decline over the past six decades has come from Americans spending less of their incomes on food at home (food purchased from supermarkets, convenience stores, warehouse club stores, supercenters, and other retailers). The share of DPI spent on food at home has fallen from 13.3 percent in 1960 to 5.7 percent in 2000 and 5.0 percent in 2018. In contrast, the share of DPI spent on food away from home (food purchased from restaurants, fast-food places, schools, and other away-from-home eating places) has risen—from 3.6 percent in 1960 to 4.2 percent in 2000, holding constant at 4.4 percent during the 2007-09 recession, and reaching 4.7 percent in 2018. This chart appears in the Food Prices and Spending section of the ERS data product, Ag and Food Statistics: Charting the Essentials. More information on U.S. food sales and expenditures, can be found in ERS’s Food Expenditure Series data product.
Tuesday, October 22, 2019
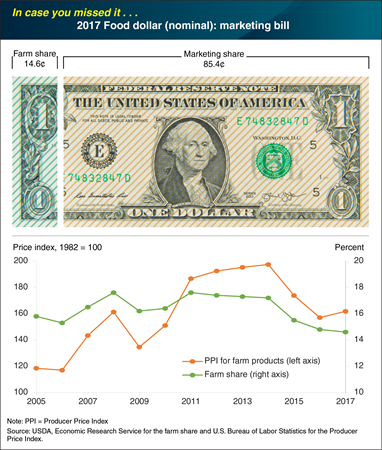
On average, U.S. farmers received 14.6 cents for farm commodity sales from each dollar spent on domestically produced food in 2017, down from 14.8 cents in 2016—a 1.4-percent decline. ERS uses input-output analysis to calculate the farm and marketing shares from a typical food dollar, including food purchased at grocery stores and at restaurants, coffee shops, and other eating-out places. Although 2017 was the 6th consecutive year the farm share dropped, the decline in 2017 was smaller than in 2016 (4.5 percent) and 2015 (9.9 percent). Unlike in the previous 2 years, average prices received by U.S. farmers went up in 2017 as measured by the Producer Price Index for farm products. The decline in farm share also coincides with 6 consecutive years of increases in the share of the food dollar going to the foodservice industry. Increases in food-away-from-home spending by consumers drives down the farm share of the food dollar. Farmers receive a smaller percentage from eating-out expenditures because food makes up a smaller share of total costs due to restaurants’ added costs for preparing and serving meals. The data for this chart can be found in ERS’s Food Dollar Series data product, updated March 2019. This Chart of Note was original published on This Chart of Note was originally published April 17, 2019.
Wednesday, October 16, 2019
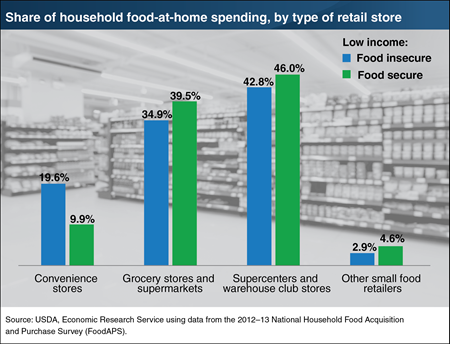
While most households in the United States are food secure, meaning they have access to enough food for an active, healthy life for all household members, some U.S. households are food insecure. In a food-insecure household, not all members have enough food at all times to live active, healthy lives. ERS researchers examined the food purchases of low-income food-insecure households and compared them to purchases of low-income food-secure households with similar characteristics. In particular, they examined differences in the types of places at which the two household groups spent their at-home food dollars using data from USDA’s National Household Food Acquisition and Purchase Survey (FoodAPS). The researchers found that food-insecure households made nearly 20 percent of their food-at-home purchases at convenience stores, while food-secure households spent 10 percent of their food-at-home dollars at convenience stores. Food-secure households spent a larger share of their food-at-home budgets at traditional grocery stores or supermarkets and at large warehouse club stores or supercenters. The data for the chart come from the ERS report, Food Security and Food Purchase Quality Among Low-Income Households: Findings From the National Household Food Acquisition and Purchase Survey (FoodAPS), published August 2019.
Tuesday, September 24, 2019
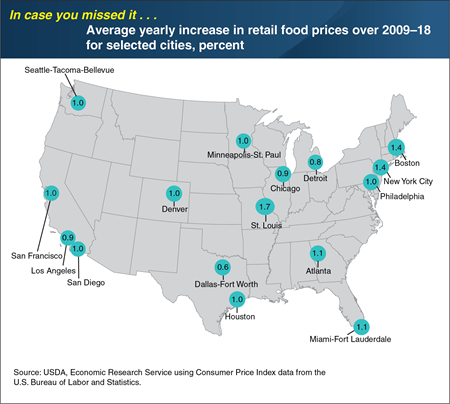
Between 2009 and 2018, retail food prices rose an average of 1.2 percent per year nationally. However, food-at-home price inflation varies by geographic location. Over the same 10-year period, retail food prices rose an average of 1.7 percent per year in St. Louis, while prices in Dallas rose on average 0.6 percent per year. Averaging 10 years of annual data smooths out year-to-year “noise”—volatile price swings that obscure the bigger picture of relative food price increases by city. Different rates of change in transportation costs and retail overhead expenses, such as labor and rent, can explain some of the variation among cities because cost increases are often passed along to the consumer in the form of higher grocery prices. Furthermore, differences in consumer food preferences among cities for specific foods may help explain variation in inflation rates. For example, a city whose residents strongly preferred foods with little price inflation (such as pork and poultry at 1.4 and 1.5 percent per year, respectively, in 2009–2018) might have had a lower 10-year average inflation level than a city whose residents purchased more beef or veal, which increased an average of 3.4 percent per year in 2009–2018. This chart appears in an ERS data visualization, Food Price Environment: Interactive Visualization, released March 2019. This Chart of Note was originally published March 28, 2019.
Wednesday, September 18, 2019
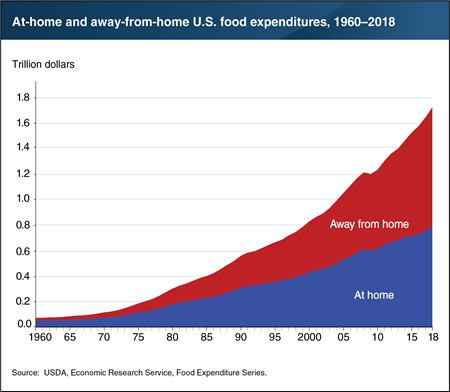
U.S. consumers, businesses, and government entities spent $1.71 trillion on food and beverages in 2018. Spending at food-away-from-home establishments—restaurants, school cafeterias, sports venues, and other eating places—accounted for 54.4 percent of these expenditures, and the remaining 45.6 percent took place at grocery stores, supercenters, convenience stores, and other retailers. A 54.4-percent share of food expenditures does not equate to 54.4 percent of food quantities, as food purchased away from home is generally higher priced than food prepared at home. Food-away-from-home outlets incur costs for the workers required to prepare and serve food, as well as for buildings, equipment, and utilities. The away-from-home market, which accounted for about one-third of total food expenditures 50 years ago (33.8 percent in 1968), has grown through the decades, except in some recession years. During most of the 2007–09 recession, food away from home’s share of total food spending stayed at or just below 50 percent before rising to 50.1 percent in 2009 and continuing to grow to its 2018 share of 54.4 percent. The data in this chart, along with more information on U.S. food sales and expenditures, can be found in ERS’s Food Expenditures data product, updated August 20, 2019.
Wednesday, August 14, 2019
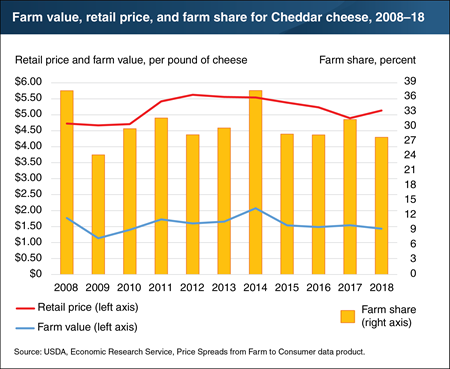
In 2018, the farm share of the retail price of Cheddar cheese—the ratio of what dairy farmers received for the milk used in the cheese (farm value) to what consumers paid in grocery stores (retail price)—decreased to 28 percent from 32 percent in 2017. Although the average retail price of Cheddar cheese increased from $4.90 per pound in 2017 to $5.14 in 2018, the farm value of the 10.3 pounds (1.2 gallons) of milk used to make a pound of Cheddar cheese fell from $1.54 to $1.43 after adjusting for the value of the whey coproduct. During 2015-18, cheese supplies (sum of production, beginning inventories, and imports) grew more quickly than the sum of domestic consumption and exports—a situation that put downward pressure on wholesale cheese prices. According to projections released by ERS in June 2019, prices received by farmers for their milk are forecast to increase in 2019 and the average wholesale price of Cheddar cheese is forecast to rise from $1.54 per pound in 2018 to $1.64 in 2019. More information on ERS’s farm share data can be found in the Price Spreads from Farm to Consumer data product, updated in June 2019.
Tuesday, July 16, 2019
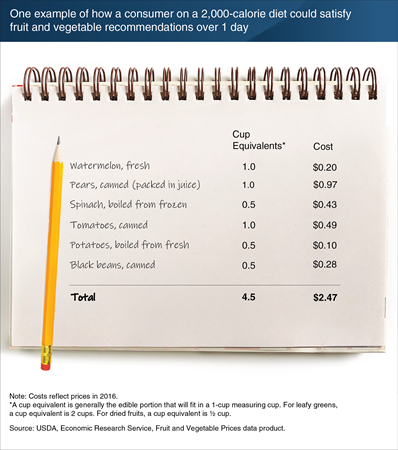
“Make half your plate fruits and vegetables” is among USDA’s key messages about how Americans can achieve healthy diets. However, many Americans still consume an insufficient quantity and variety of fruits and vegetables. One reason may be a perception that these foods are expensive. To address this perception, ERS reports the average cost to consume 154 fresh and processed fruits and vegetables in cup equivalents. A cup equivalent is generally the edible portion of a fruit or vegetable that will fit in a 1-cup measuring cup. Researchers also use the data to create baskets of products that would satisfy the 2 cup equivalents of fruit and the 2.5 cup equivalents of vegetables recommended for a person on a 2,000-calorie-per-day diet. In 2016, it was possible to meet these recommendations for about $2.10 to $2.60 per day. One basket in this cost range contains 1 cup equivalent each of watermelon and canned pears (packed in juice) as well as 1 cup equivalent of canned tomatoes and ½ cup equivalent each of potatoes, frozen spinach, and canned black beans. This example basket and others appear in the Amber Waves article, “Americans Still Can Meet Fruit and Vegetable Dietary Guidelines for $2.10-$2.60 per Day,” published in June 2019.
Monday, July 1, 2019
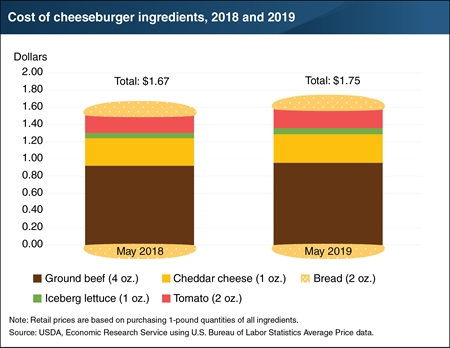
If your July 4 cookout includes cheeseburgers, they will be a bit pricier than last year’s burgers. In May 2019 (latest available prices), the ingredients for a home-prepared quarter-pound cheeseburger totaled $1.75 per burger, with ground beef making up the largest cost at $0.96 and cheddar cheese accounting for $0.33. This same cheeseburger would have cost $1.67 to prepare in May 2018, an increase of 4.8 percent. Retail prices for one pound quantities of all of the ingredients, with the exception of bread, were higher in May 2019 compared with May 2018. Higher ground beef prices accounted for half of the 8-cent increase between 2018 and 2019, and cheddar cheese costs were 1 cent more per burger in May 2019. Iceberg lettuce and tomato prices rose the most—14.5 and 8.8 percent, respectively—but the small amount of these toppings added just 3 cents to per burger costs. More information on ERS’s food price forecasts can be found in ERS’s Food Price Outlook data product, updated June 25, 2019.
Thursday, June 6, 2019
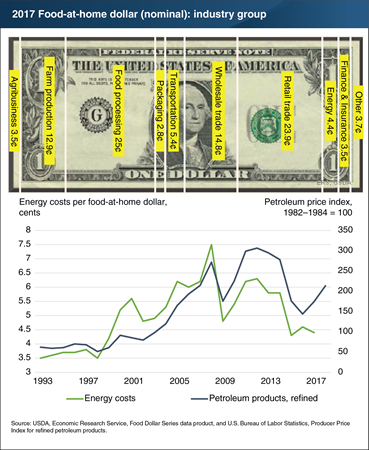
With prices rising at the gas pump, people may be asking how higher fuel prices might affect food costs. ERS’s Food Dollar Series breaks out the value added to food by 12 industry groups, including energy services, such as electricity, natural gas, and petroleum products. In 2017, 4.4 cents of a typical dollar spent by U.S. consumers on domestically produced food at retail food stores represented costs related to energy services. Higher oil prices in 2019 could cause energy’s share of the food-at-home dollar to rise as it did between 2002 and 2008, when energy costs rose faster than costs of the other 11 industry groups. Energy’s share of the food-at-home dollar grew from 4.8 cents in 2002 to 7.5 cents in 2008. This was a smaller increase than the rise in oil prices themselves because the food industry made adjustments to reduce energy use. The food industry may make similar adjustments in response to 2019 oil prices. Consumers may also adjust their food purchases, shifting to foods that use less energy inputs if retail prices rise more sharply for energy-intensive foods. Such industry and consumer adjustments could lessen the expected increase in energy’s share of the food-at-home dollar. This chart is from ERS’s Food Dollar Series data product.
Wednesday, April 17, 2019
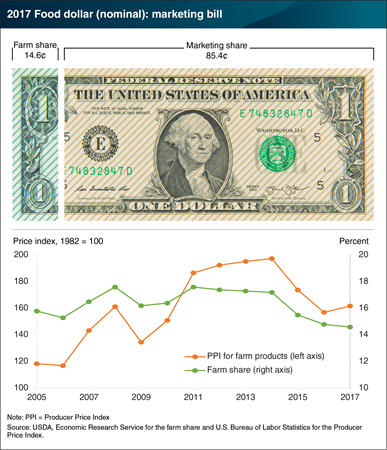
On average, U.S. farmers received 14.6 cents for farm commodity sales from each dollar spent on domestically produced food in 2017, down from 14.8 cents in 2016—a 1.4-percent decline. ERS uses input-output analysis to calculate the farm and marketing shares from a typical food dollar, including food purchased at grocery stores and at restaurants, coffee shops, and other eating-out places. Although 2017 was the 6th consecutive year the farm share dropped, the decline in 2017 was smaller than in 2016 (4.5 percent) and 2015 (9.9 percent). Unlike in the previous 2 years, average prices received by U.S. farmers went up in 2017 as measured by the Producer Price Index for farm products. The decline in farm share also coincides with 6 consecutive years of increases in the share of the food dollar going to the foodservice industry. Increases in food-away-from-home spending by consumers drives down the farm share of the food dollar. Farmers receive a smaller percentage from eating-out expenditures because food makes up a smaller share of total costs due to restaurants’ added costs for preparing and serving meals. The data for this chart can be found in ERS’s Food Dollar Series data product, updated March 2019.
Thursday, March 28, 2019
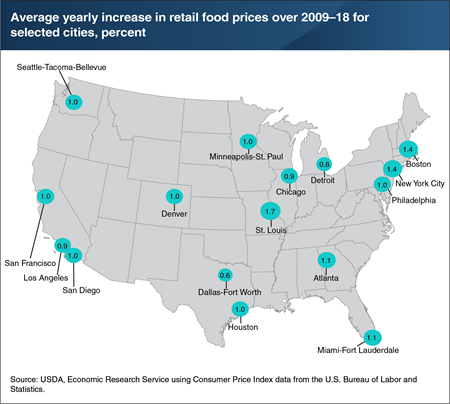
Between 2009 and 2018, retail food prices rose an average of 1.2 percent per year nationally. However, food-at-home price inflation varies by geographic location. Over the same 10-year period, retail food prices rose an average of 1.7 percent per year in St. Louis, while prices in Dallas rose on average 0.6 percent per year. Averaging 10 years of annual data smooths out year-to-year “noise”—volatile price swings that obscure the bigger picture of relative food price increases by city. Different rates of change in transportation costs and retail overhead expenses, such as labor and rent, can explain some of the variation among cities because cost increases are often passed along to the consumer in the form of higher grocery prices. Furthermore, differences in consumer food preferences among cities for specific foods may help explain variation in inflation rates. For example, a city whose residents strongly preferred foods with little price inflation (such as pork and poultry at 1.4 and 1.5 percent per year, respectively, in 2009–2018) might have had a lower 10-year average inflation level than a city whose residents purchased more beef or veal, which increased an average of 3.4 percent per year in 2009–2018. This chart appears in an ERS data visualization, Food Price Environment: Interactive Visualization, released March 2019.
Thursday, February 21, 2019
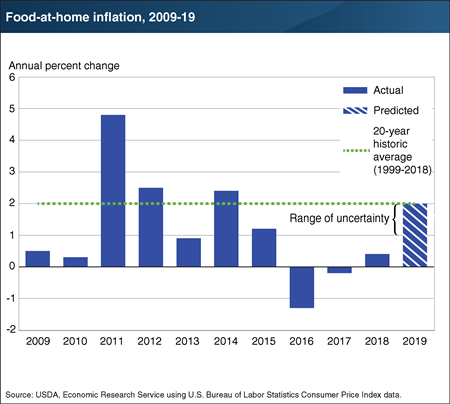
Over the last decade, grocery store food prices in the United States have had their ups and downs, with average annual prices decreasing as much as 1.3 percent in 2016 and increasing as much as 4.8 percent in 2011. Lower retail food price inflation in 2009 and 2010 reflected the economywide downturn caused by the Great Recession of 2007-09. Food-at-home prices rebounded in 2011 and rose between 0.9 and 2.5 percent annually in 2012-15. In 2016 and 2017, however, retail food prices declined because of increases in farm- and wholesale-level production, lower prices for oil and other production inputs, as well as exchange rates that made imported foods less expensive. In 2018, retail food prices rose 0.4 percent. ERS expects retail food prices to continue this upward trend in 2019, with overall food-at-home prices forecast to increase between 1 and 2 percent. Consumers can expect some variation among grocery subcategories. For instance, retail dairy prices are expected to rise between 3 and 4 percent, while prices for fats and oils are expected to decrease by between 2 and 3 percent. More information on ERS’s food price forecasts can be found in ERS’s Food Price Outlook data product, updated February 21, 2019.


