
ICYMI... Farm share of U.S. food dollar declined slightly in 2017
- by Patrick Canning, Michelle Saksena and Katherine Ralston
- 10/22/2019
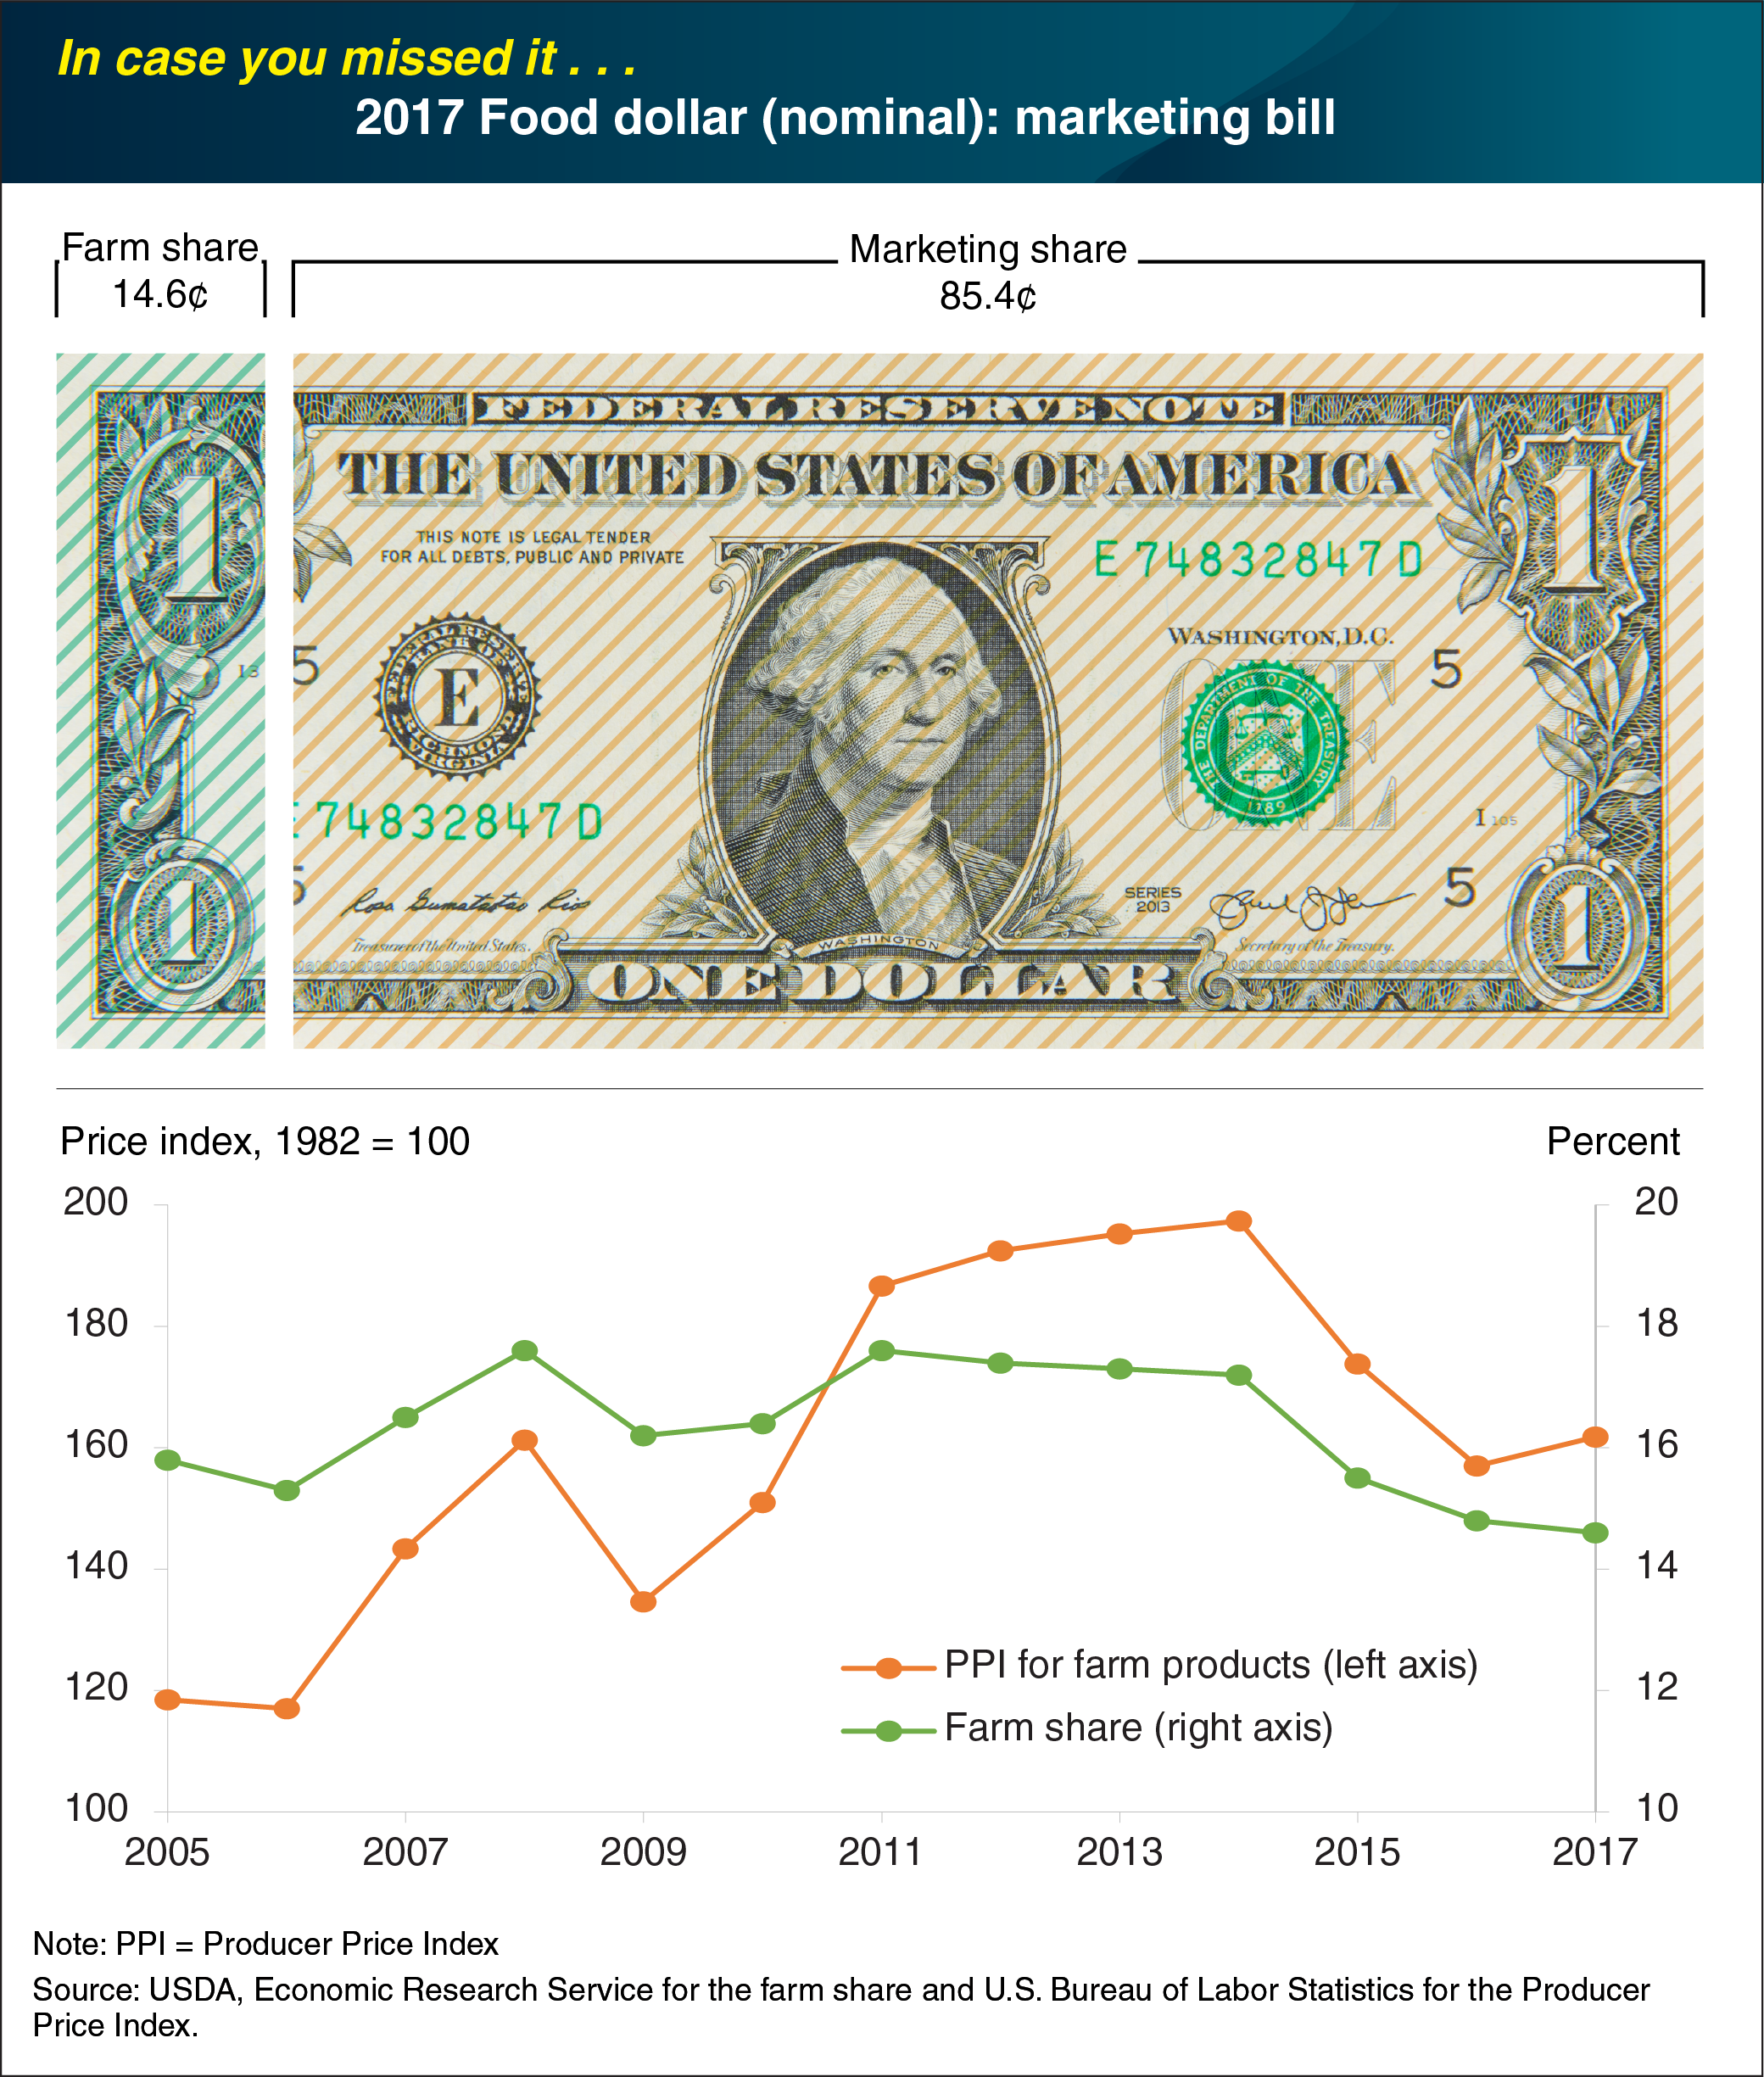
On average, U.S. farmers received 14.6 cents for farm commodity sales from each dollar spent on domestically produced food in 2017, down from 14.8 cents in 2016—a 1.4-percent decline. ERS uses input-output analysis to calculate the farm and marketing shares from a typical food dollar, including food purchased at grocery stores and at restaurants, coffee shops, and other eating-out places. Although 2017 was the 6th consecutive year the farm share dropped, the decline in 2017 was smaller than in 2016 (4.5 percent) and 2015 (9.9 percent). Unlike in the previous 2 years, average prices received by U.S. farmers went up in 2017 as measured by the Producer Price Index for farm products. The decline in farm share also coincides with 6 consecutive years of increases in the share of the food dollar going to the foodservice industry. Increases in food-away-from-home spending by consumers drives down the farm share of the food dollar. Farmers receive a smaller percentage from eating-out expenditures because food makes up a smaller share of total costs due to restaurants’ added costs for preparing and serving meals. The data for this chart can be found in ERS’s Food Dollar Series data product, updated March 2019. This Chart of Note was original published on This Chart of Note was originally published April 17, 2019.