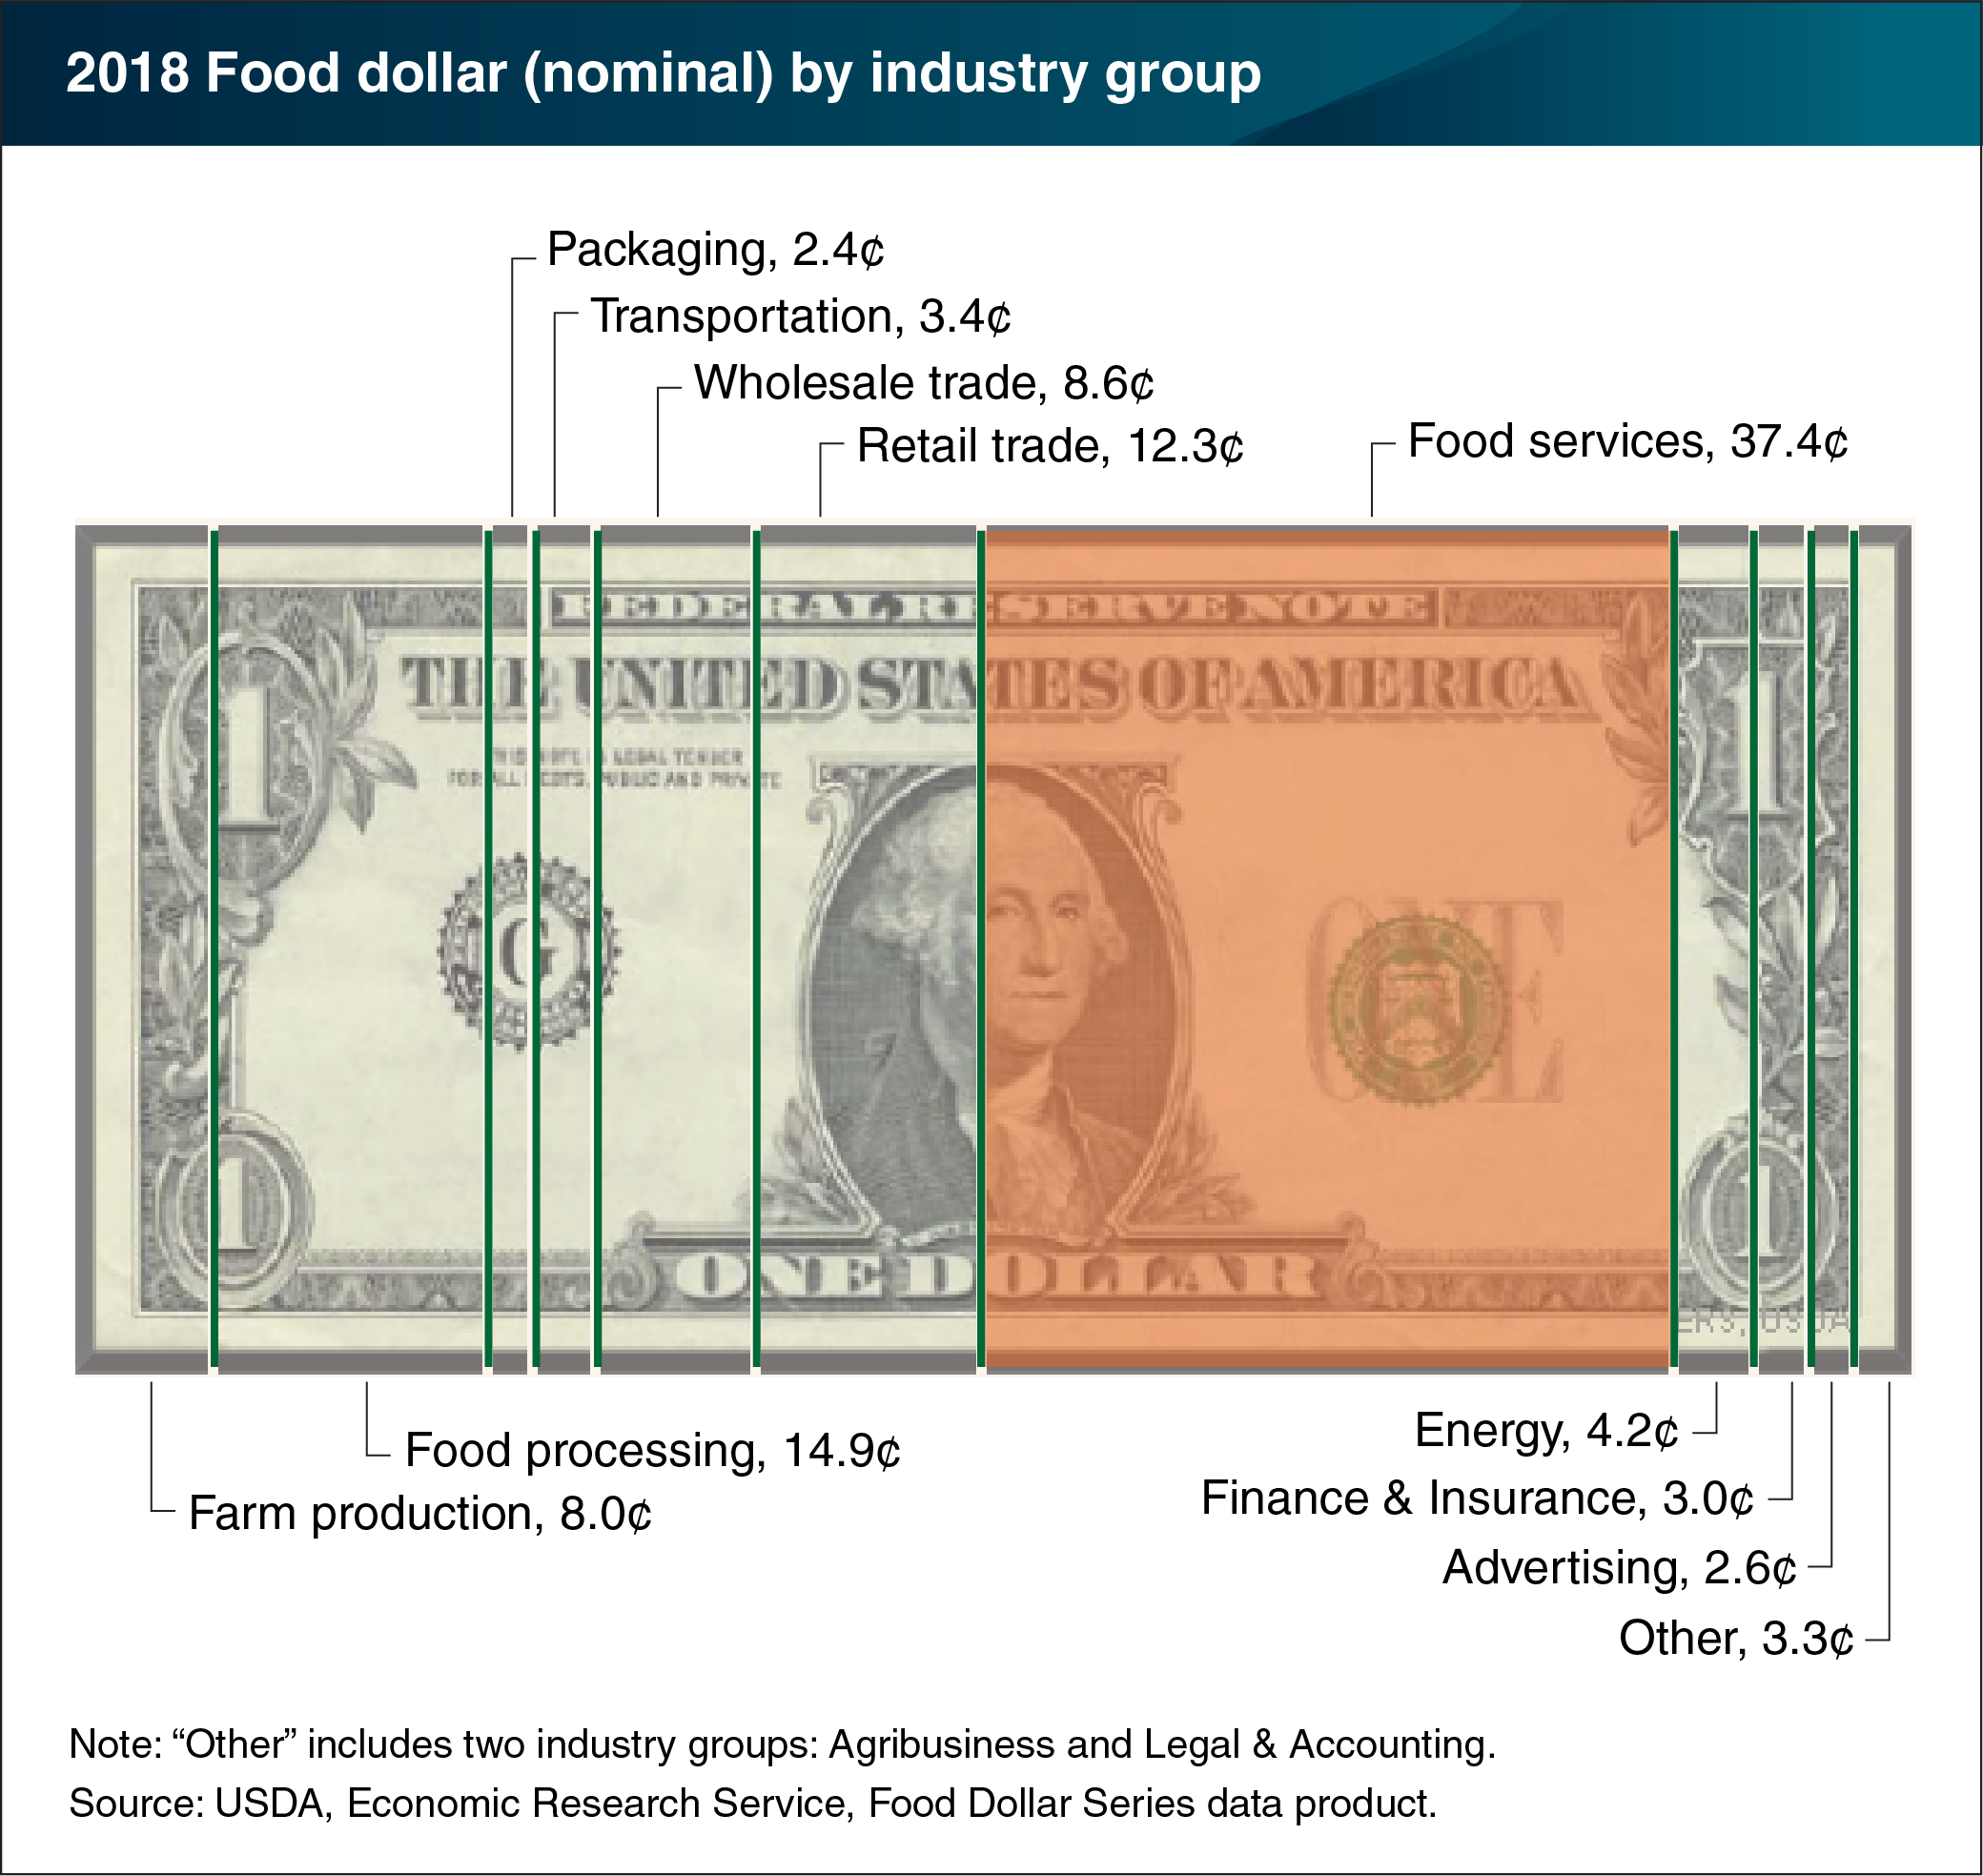
The foodservice industry accounted for 37 cents of the 2018 U.S. food dollar
- by Patrick Canning
- 4/24/2020

In 2018, restaurants and other eating-out places claimed 37.4 cents of the U.S. food dollar—foodservices’ highest share during the 1993 to 2018 period covered by the Economic Research Service’s (ERS’s) Food Dollar Series and the seventh consecutive annual increase. More eating out in 2018 was also reflected in the 12.3-cent retail-trade share claimed by grocery stores and other food retailers, which was at its lowest level in the 1993-2018 period. The only other industry groups that showed an increasing food dollar share in 2018 were farm producers, up 0.3 cents to 8 cents in 2018, and energy industries, such as electric power and natural gas, which increased their share for the third consecutive year, up to 4.2 cents. ERS’s annual Food Dollar Series provides insight into the industries that make up the U.S. food system and their contributions to total U.S. spending on domestically-produced food. ERS uses input-output analysis to calculate the value added, or cost contributions, from 12 industry groups in the food supply chain. Annual shifts in food dollar shares between industry groups occur for a variety of reasons, ranging from the mix of foods that consumers purchase to relative input costs; implications of this year’s COVID-19-related shelter-in-place restrictions will be reflected in the 2020 food dollar. This chart is available for the years 1993 to 2018, and can be found in ERS’s Food Dollar Series data product, updated on March 23, 2020.

