
Energy costs accounted for 4.4 cents of the U.S. food-at-home dollar in 2017
- by Michelle Saksena
- 6/6/2019
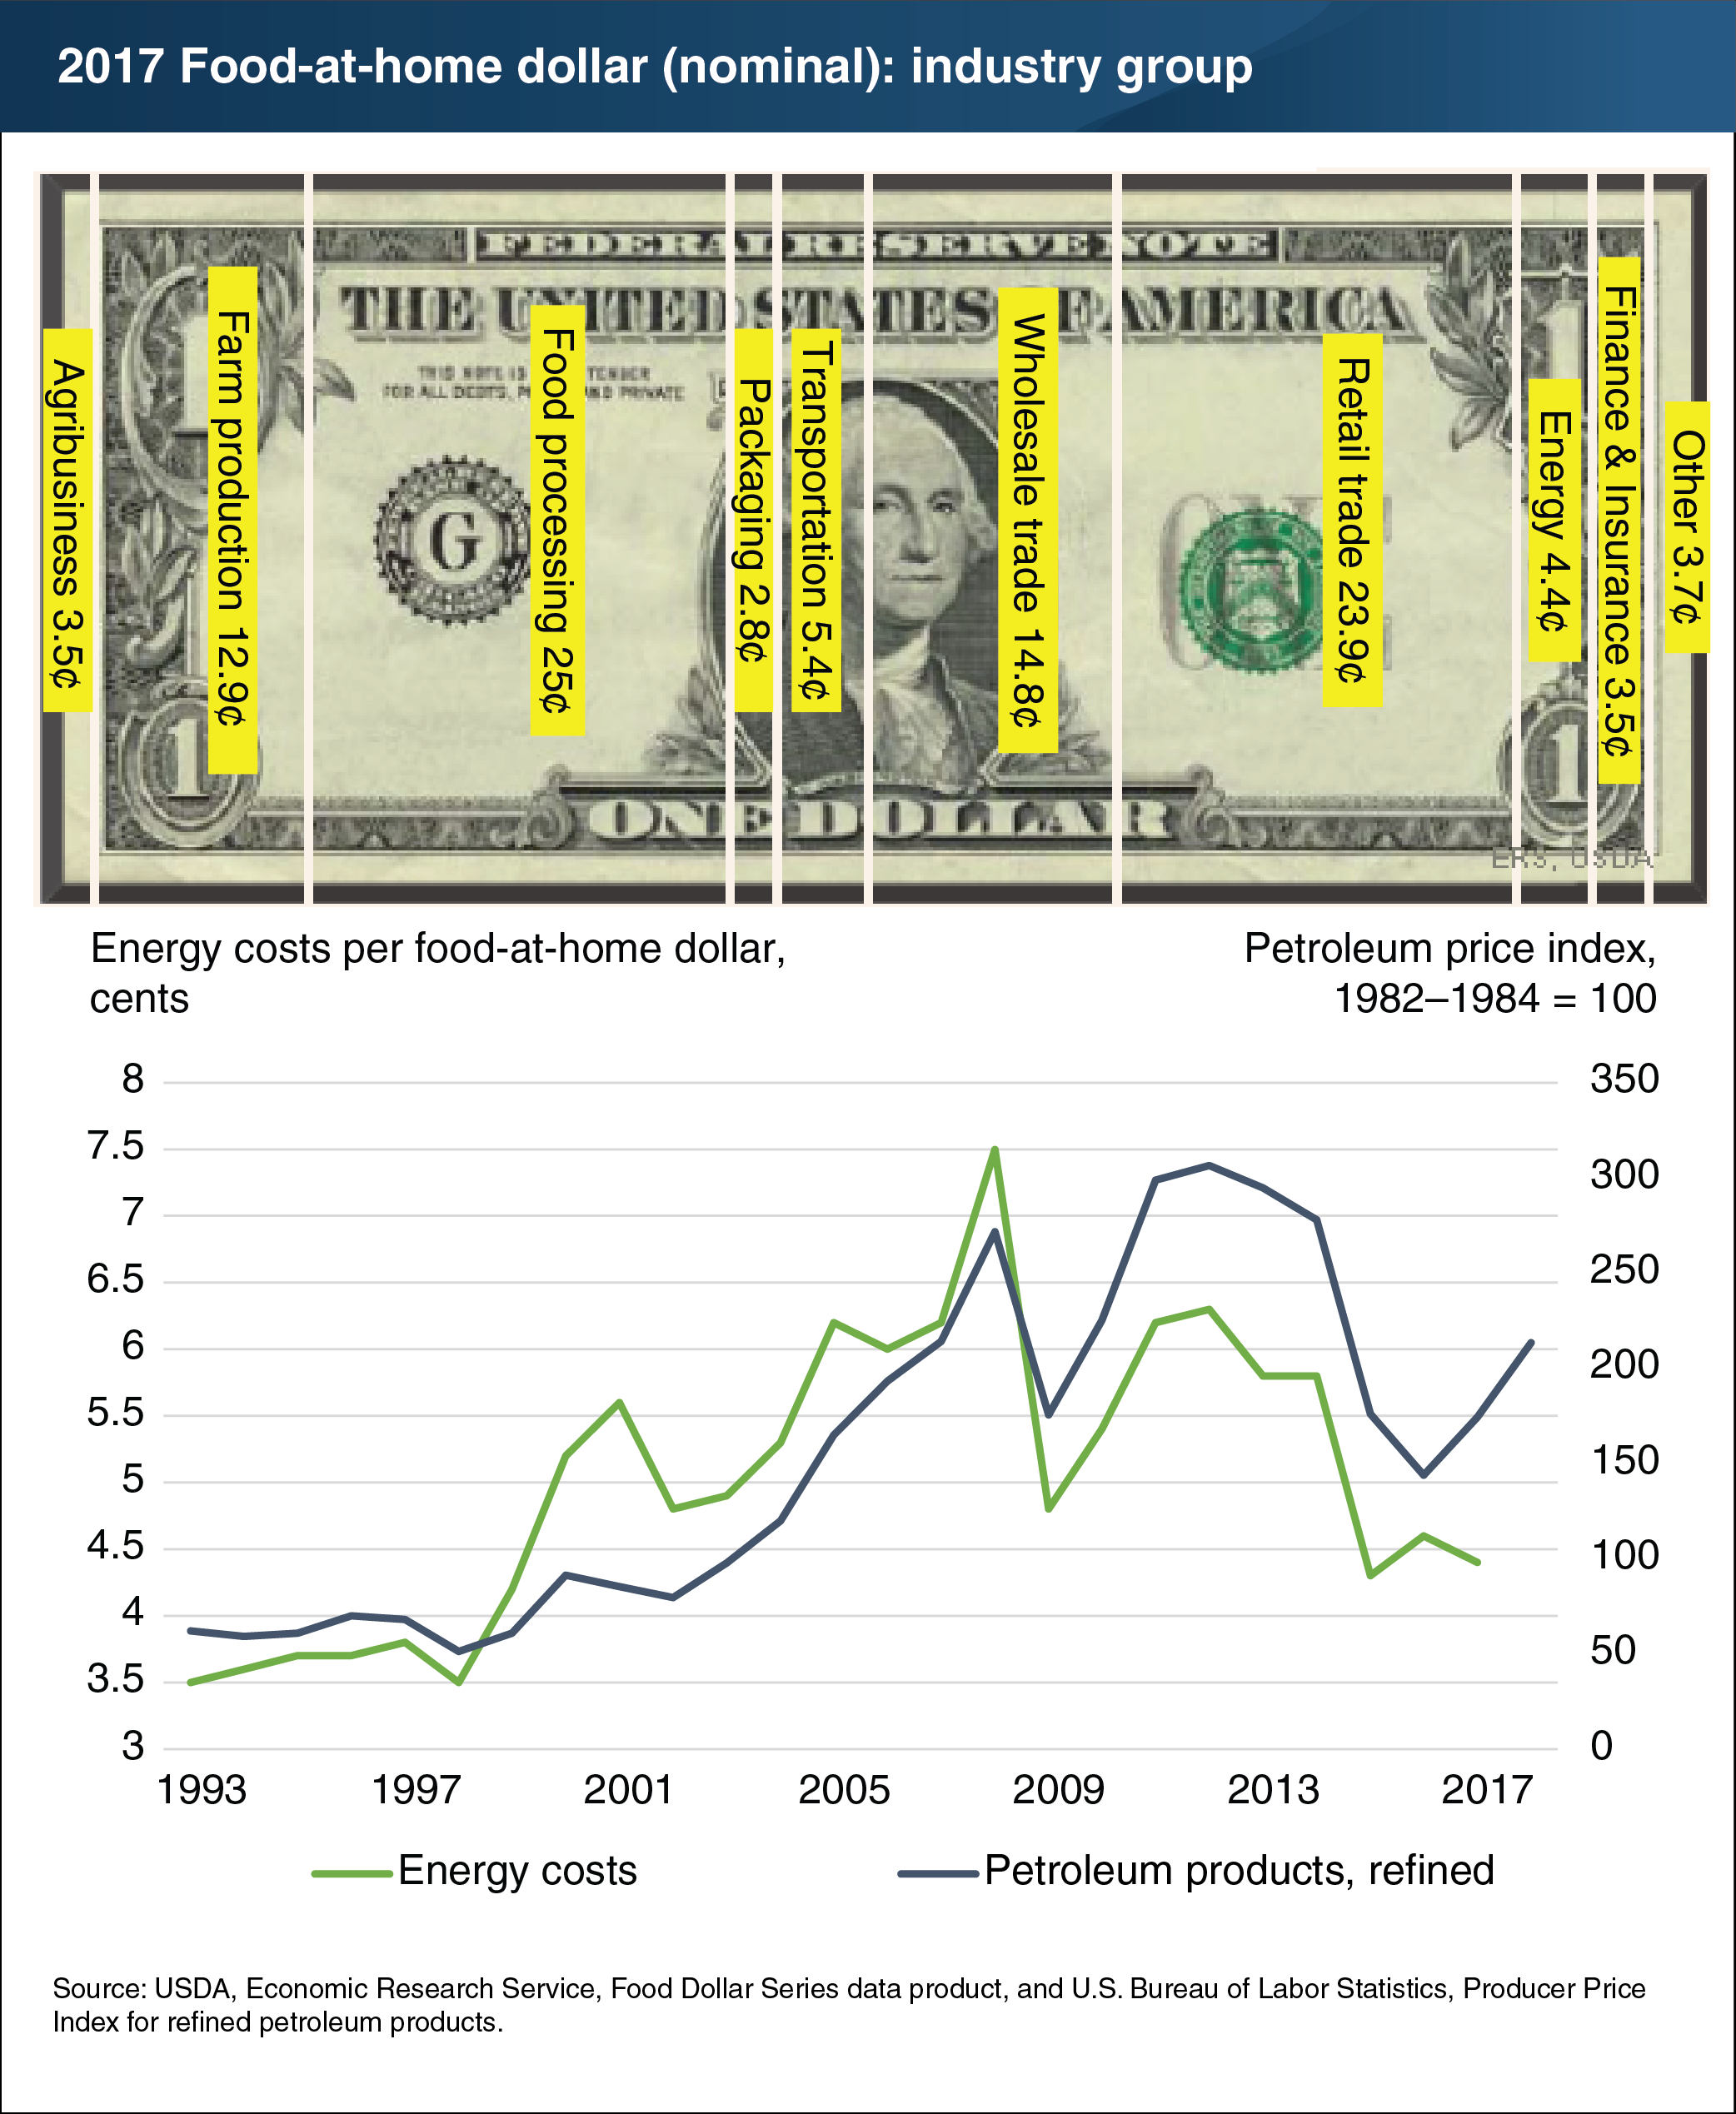
With prices rising at the gas pump, people may be asking how higher fuel prices might affect food costs. ERS’s Food Dollar Series breaks out the value added to food by 12 industry groups, including energy services, such as electricity, natural gas, and petroleum products. In 2017, 4.4 cents of a typical dollar spent by U.S. consumers on domestically produced food at retail food stores represented costs related to energy services. Higher oil prices in 2019 could cause energy’s share of the food-at-home dollar to rise as it did between 2002 and 2008, when energy costs rose faster than costs of the other 11 industry groups. Energy’s share of the food-at-home dollar grew from 4.8 cents in 2002 to 7.5 cents in 2008. This was a smaller increase than the rise in oil prices themselves because the food industry made adjustments to reduce energy use. The food industry may make similar adjustments in response to 2019 oil prices. Consumers may also adjust their food purchases, shifting to foods that use less energy inputs if retail prices rise more sharply for energy-intensive foods. Such industry and consumer adjustments could lessen the expected increase in energy’s share of the food-at-home dollar. This chart is from ERS’s Food Dollar Series data product.
We’d welcome your feedback!
Would you be willing to answer a few quick questions about your experience?