
U.S. spending on food away from home outpaced food-at-home spending in 2018
- by Eliana Zeballos and Constance Newman
- 9/18/2019
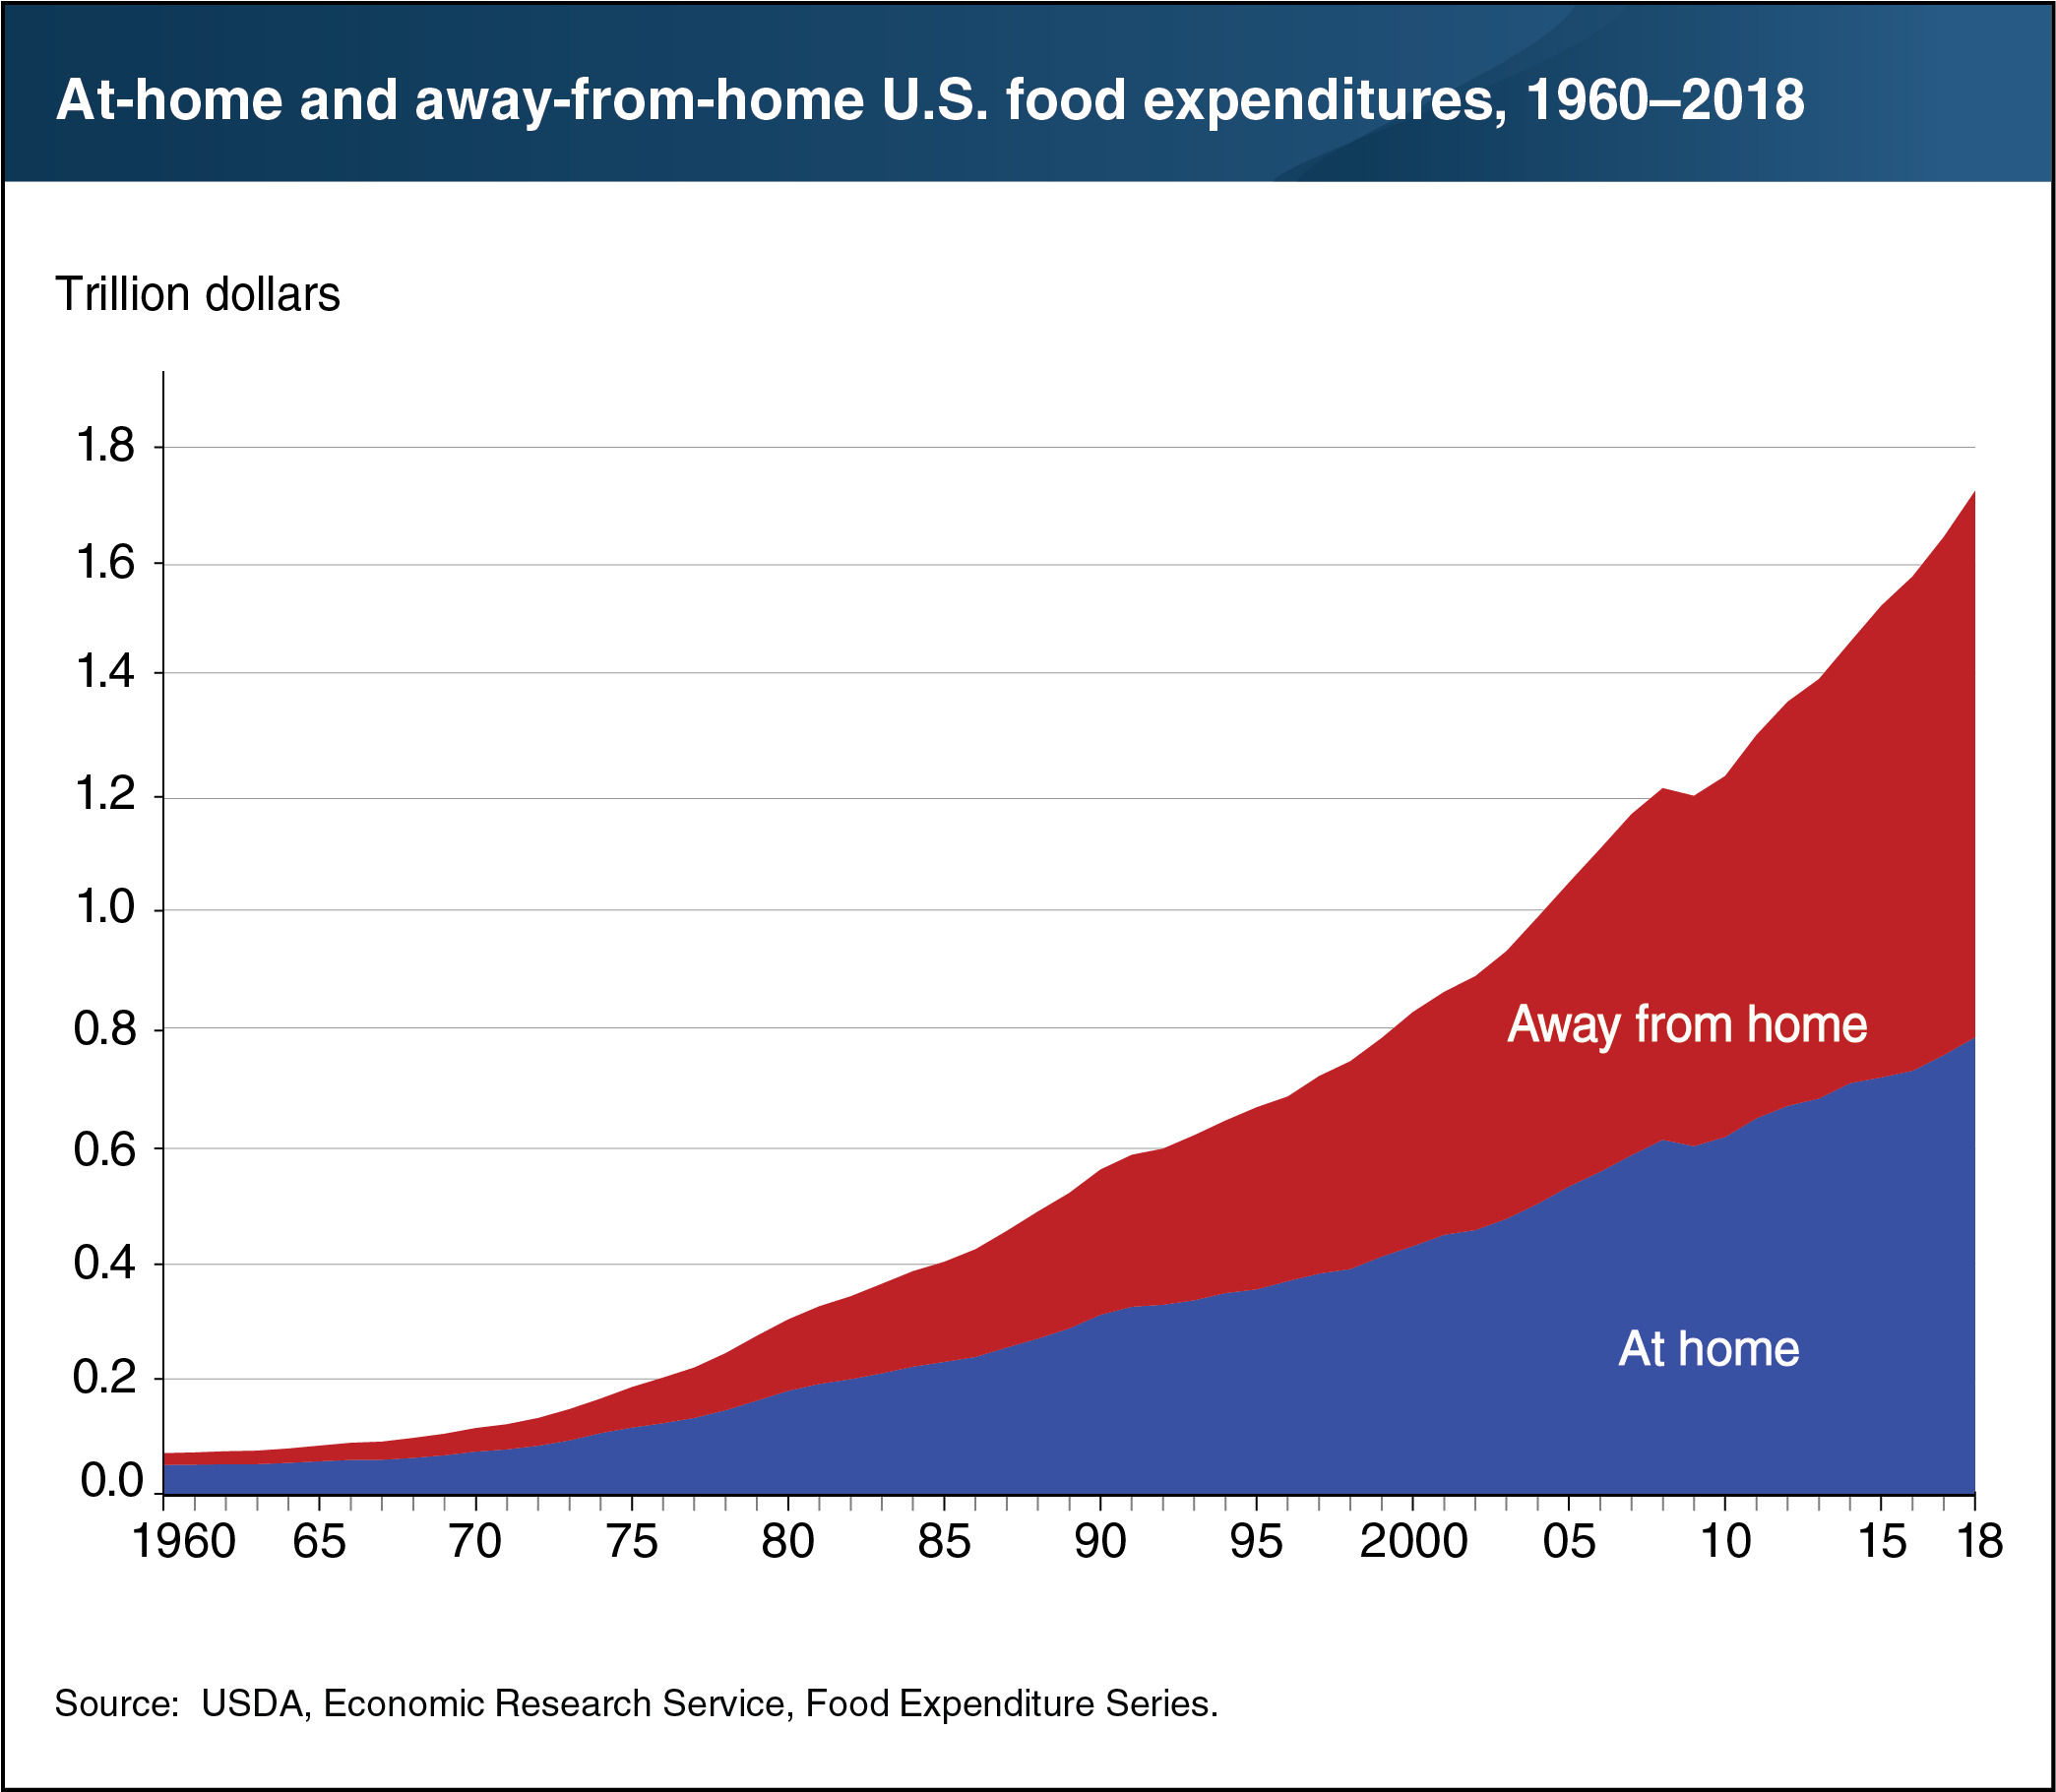
U.S. consumers, businesses, and government entities spent $1.71 trillion on food and beverages in 2018. Spending at food-away-from-home establishments—restaurants, school cafeterias, sports venues, and other eating places—accounted for 54.4 percent of these expenditures, and the remaining 45.6 percent took place at grocery stores, supercenters, convenience stores, and other retailers. A 54.4-percent share of food expenditures does not equate to 54.4 percent of food quantities, as food purchased away from home is generally higher priced than food prepared at home. Food-away-from-home outlets incur costs for the workers required to prepare and serve food, as well as for buildings, equipment, and utilities. The away-from-home market, which accounted for about one-third of total food expenditures 50 years ago (33.8 percent in 1968), has grown through the decades, except in some recession years. During most of the 2007–09 recession, food away from home’s share of total food spending stayed at or just below 50 percent before rising to 50.1 percent in 2009 and continuing to grow to its 2018 share of 54.4 percent. The data in this chart, along with more information on U.S. food sales and expenditures, can be found in ERS’s Food Expenditures data product, updated August 20, 2019.