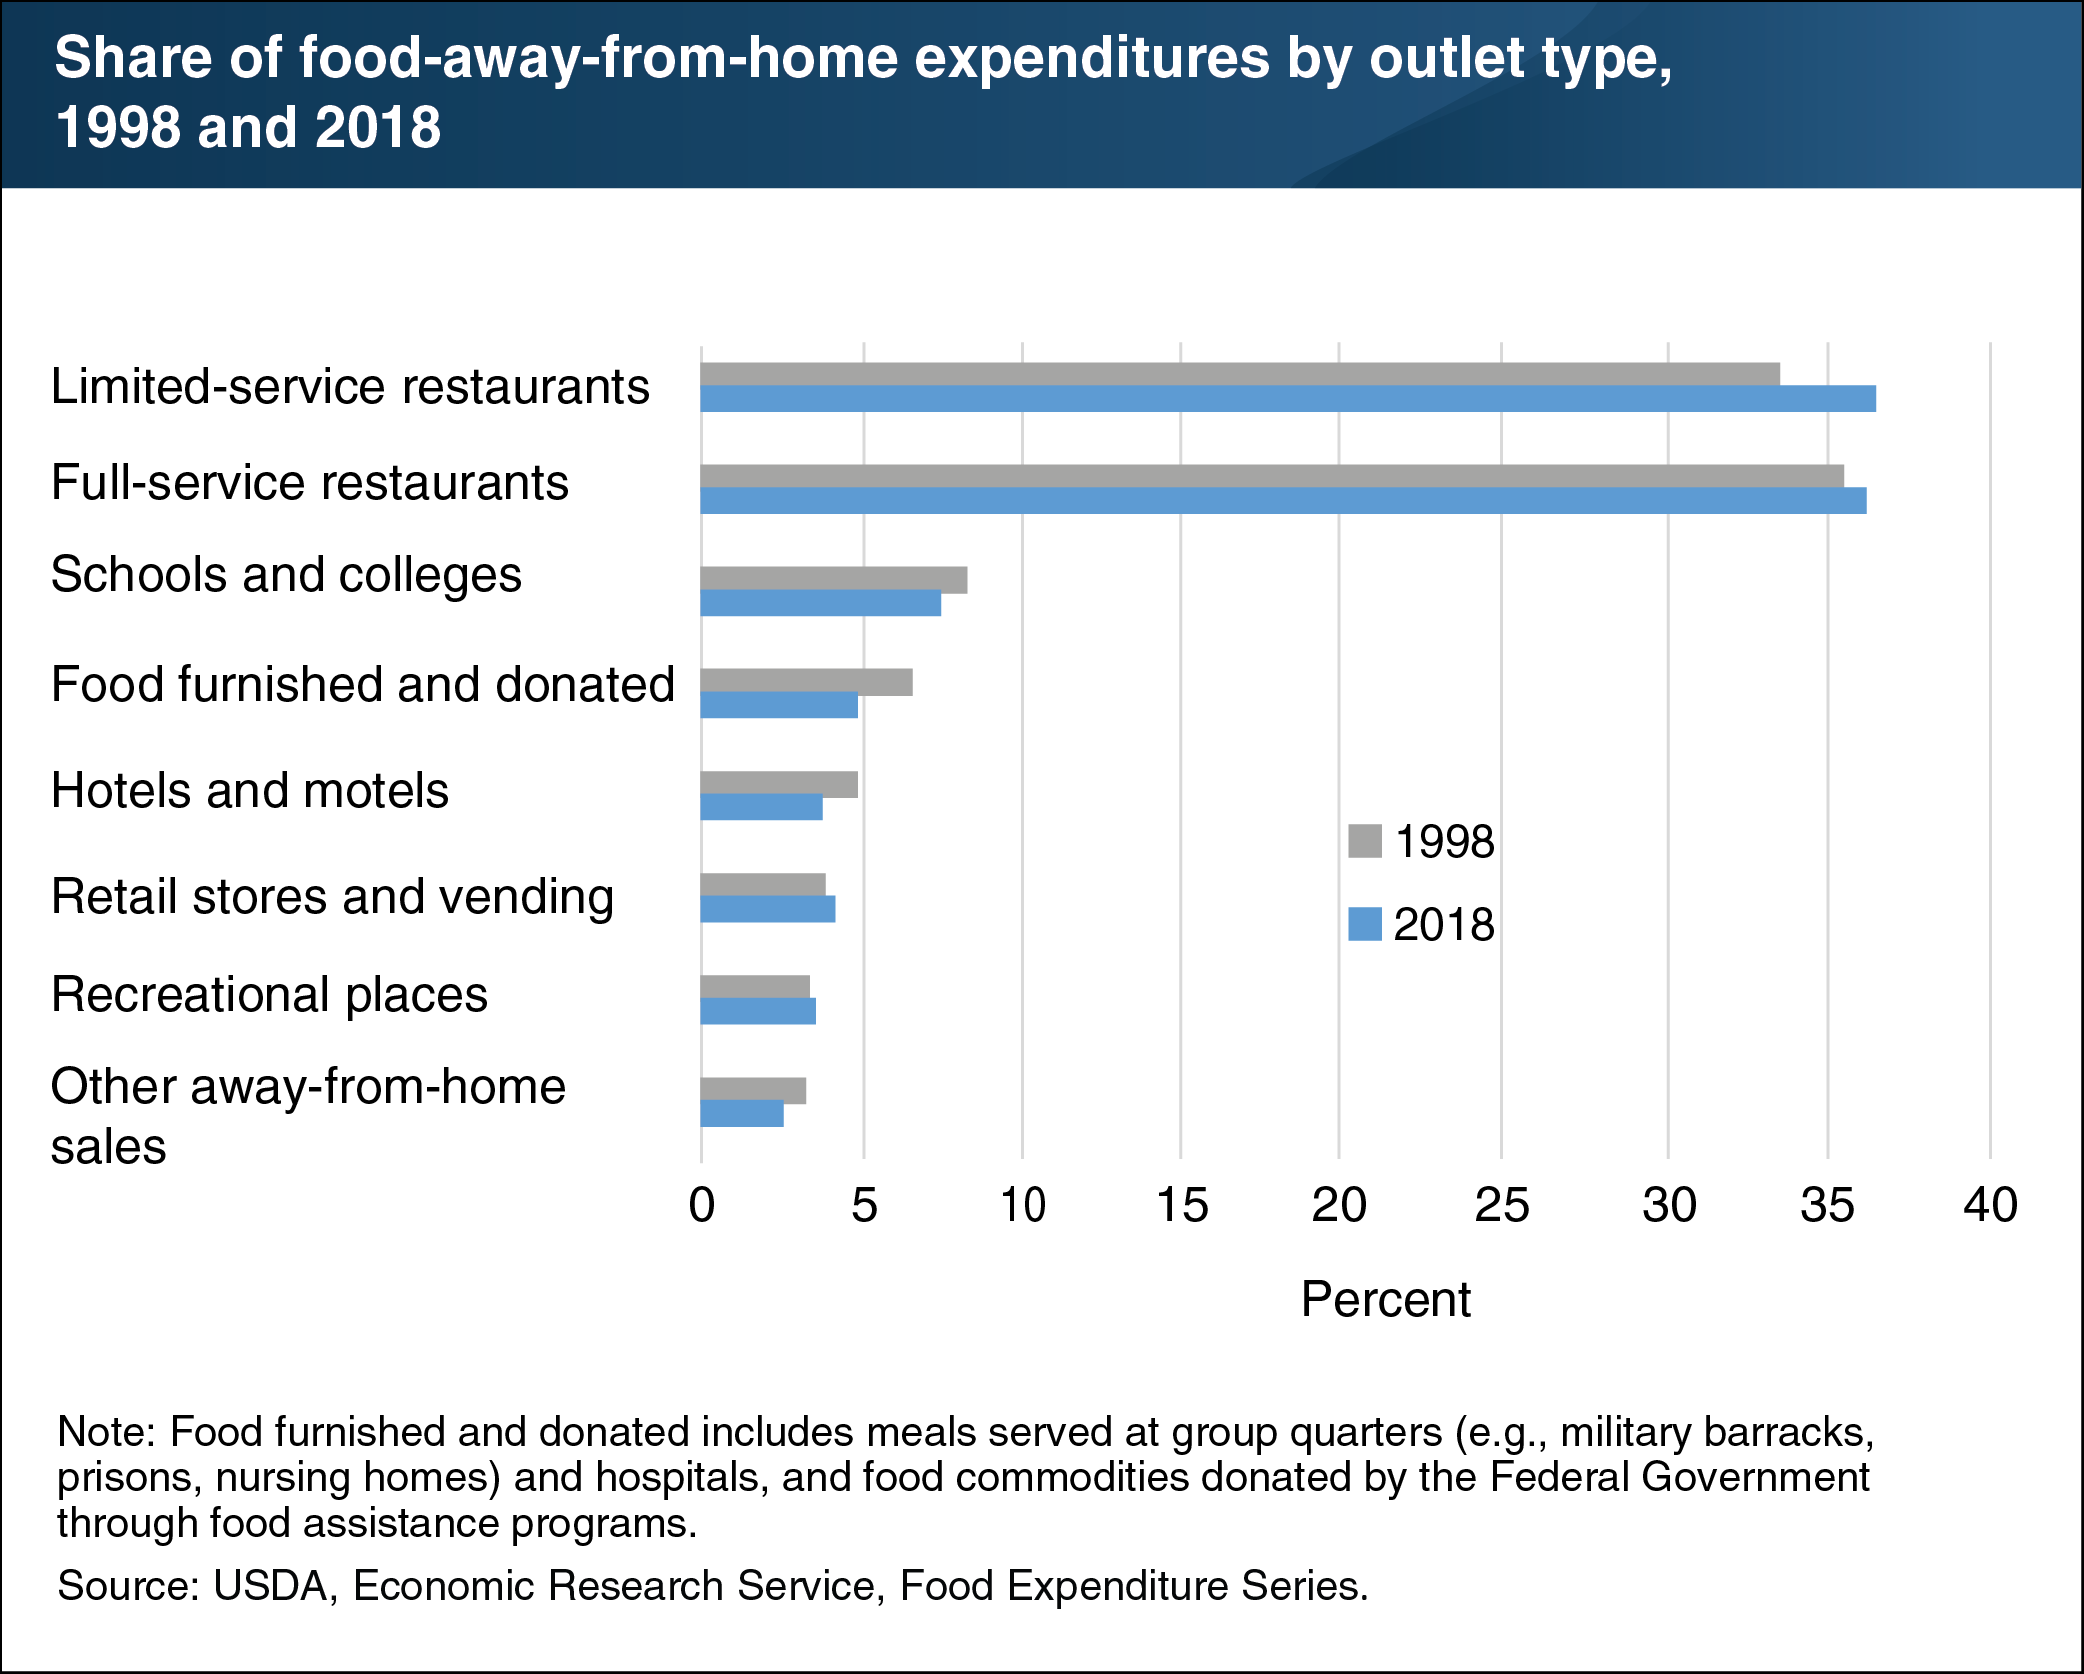
Limited-service restaurants’ share of the eating-out market has grown over the past two decades
- by Eliana Zeballos and Katherine Ralston
- 12/6/2019

ERS’s Food Expenditure Series points to Americans’ growing appetite for eating out. Expenditures at food-away-from-home establishments—restaurants, school cafeterias, sports venues, and other eating places—totaled $930.6 billion in 2018, compared with the $780.9 billion spent on food at home in grocery stores, supercenters, convenience stores, and other retailers. Full-service restaurants with wait staff and limited-service restaurants—where food is ordered and paid for at a counter or drive-through window—dominate the food-away-from-home market. Full-service restaurants’ share of the food-away-from-home market rose from 35.6 percent in 1998 to 36.3 percent in 2018, while limited-service restaurants posted a larger increase in market share from 33.6 to 36.6 percent over the same period. The share of food-away-from-home expenditures occurring at hotels and motels and at schools and colleges declined between 1998 and 2018, while the shares at recreational places and at retail stores and vending increased slightly. The data in this chart, along with more information on U.S. food sales and expenditures, can be found in ERS’s Food Expenditure Series data product.

