ERS Charts of Note
Subscribe to get highlights from our current and past research, Monday through Friday, or see our privacy policy.
Get the latest charts via email, or on our mobile app for  and
and 
Monday, April 22, 2024
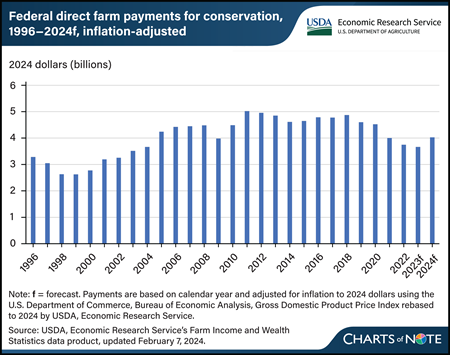
USDA, Economic Research Service (ERS) forecasts direct Federal payments for conservation programs for 2024 to increase by 10 percent, more than $363 million in inflation-adjusted terms, to $4 billion. This increase primarily is due to expected payments from the Inflation Reduction Act used to support various conservation programs. The act allocated $19.5 billion to support USDA conservation programs such as the Environmental Quality Incentives Program, the Regional Conservation Partnership Program, the Conservation Stewardship Program, the Agricultural Conservation Easement Program, and the Conservation Technical Assistance Program. Among this allocation is also the fund dedicated to measure, evaluate, quantify carbon sequestration and greenhouse gas emission reductions from conservation investments. These programs are aimed at helping farmers and ranchers expand conservation practices that reduce greenhouse gas emissions and increase storage of carbon in soil and trees. Conservation payments include programs under the management of the USDA, Farm Service Agency, such as the Conservation Reserve Program, as well as the USDA, Natural Resources and Conservation Service. ERS tracks Government payments made directly from the U.S. Government to farm sector recipients such as farm and ranch operators, contractors, and nonoperator landlords. The term “direct” emphasizes that there are no intermediaries acting between the U.S. Government and farm sector recipients, so insurance indemnities are excluded. The forecast conservation payments are in line with the 27-year average from 1996 through 2022 of $4.1 billion in inflation-adjusted dollars. However, despite the increase, forecast 2024 levels—if realized—are below the record for highest conservation payments of more than $5 billion in 2011. This chart is drawn from the ERS Farm Income and Wealth Statistics data product.
Monday, December 5, 2022
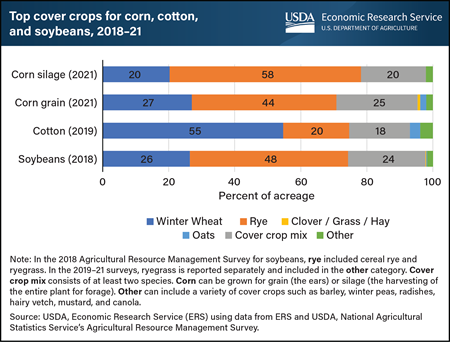
Farmers add cover crops to a rotation to provide living, seasonal soil cover between the planting of two cash (commodity) or forage crops. Including cover crops in a rotation can provide benefits such as improved soil health and water quality, weed suppression, and reduced soil erosion. Data from the field-level USDA Agricultural Resource Management Survey (ARMS) provide information on which cover crops were grown in the fall before planting corn, cotton, and soybeans. Cover crop mixes account for 18 to 25 percent of acres with cover crops. However, the use of single-species cover crops is more common. For corn fields in 2021, almost 75 percent of acres with cover crops used a grass or small grain cover crop, such as cereal rye, winter wheat, or oats. At 44 percent of acreage, cereal rye was almost twice as common as winter wheat (27 percent) as the cover crop on corn for grain fields. Rye and winter wheat were also the most common cover crops on soybean fields in 2018. Winter wheat was the most common cover crop used on cotton fields in 2019. The original version of this chart appears in the USDA, Economic Research Service report Cover Crop Trends, Programs, and Practices in the United States, released in 2021.
Monday, June 6, 2022
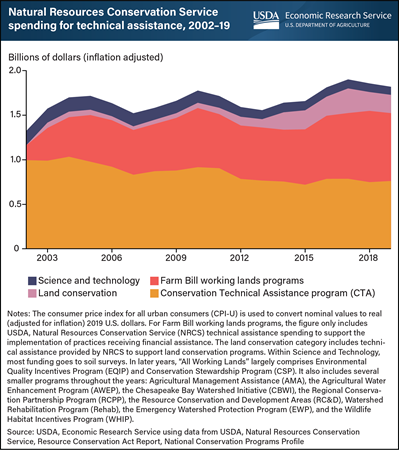
Conservation technical assistance is a service that helps producers develop skills and knowledge for maintaining the natural resources involved in agricultural production. USDA’s Natural Resources Conservation Service (NRCS) provides technical assistance through several different programs. The Conservation Technical Assistance (CTA) program provides comprehensive planning services and technical support for the adoption of conservation practices across the agricultural landscape. NRCS also provides free technical assistance to producers and landowners participating in working lands programs such as the Environmental Quality Incentives Program (EQIP) that primarily provide financial assistance for practice adoption. Similarly, NRCS provides technical support for participants in land conservation programs, which provide financial payments to producers and landowners that put land into long-term conservation, such as the Conservation Reserve Program (CRP). Finally, NRCS administers several science and technology programs, among which the largest amount of funding goes to soil surveys. Spending for the CTA program has decreased in the studied period (2002-2019) by 23 percent, once adjusted for inflation. On the other hand, spending on technical assistance in support of working lands programs that primarily provide financial assistance has increased over the period from $163 million to $761 million. Spending on technical assistance for land conservation has increased, and spending on science and technology has decreased over the same period. This chart was drawn from the USDA, Economic Research Service report USDA Conservation Technical Assistance and Within-Field Resource Concerns, published May 2022.
Wednesday, June 1, 2022
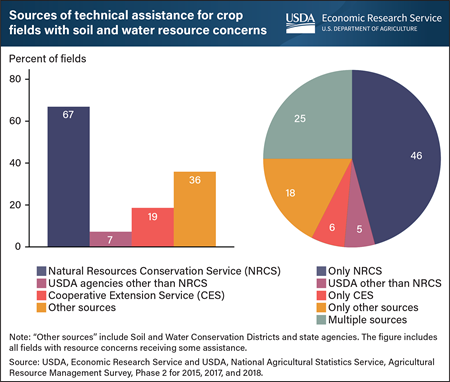
USDA asked farmers to self-report soil and water related resource concerns on their cotton, wheat, oat, and soybean fields for USDA’s 2015, 2017, and 2018 Agricultural Resource Management Survey (ARMS). USDA also asked farmers to report any sources of technical assistance which helped address their on-field soil and water concerns. USDA’s Natural Resources Conservation Service (NRCS) defines a resource concern as an expected degradation of a natural resource used in farming to the degree that its sustainability or intended use is impaired. NRCS provides free technical assistance both as a standalone service under the Conservation Technical Assistance program (CTA) and to support implementation of practices receiving financial assistance from programs such as the Environmental Quality Incentives Program (EQIP). Producers can also seek technical assistance from other USDA agencies, the Cooperative Extension System, or sources such as conservation districts or State agencies. According to recent ARMS data, about 67 percent of fields that received any technical assistance received it from NRCS, with 46 percent of assisted fields receiving assistance exclusively from NRCS. Twenty five percent of assisted fields received assistance from multiple sources. This chart was drawn from the USDA, Economic Research Service report USDA Conservation Technical Assistance and Within-Field Resource Concerns, published May 5, 2022.
Wednesday, May 25, 2022
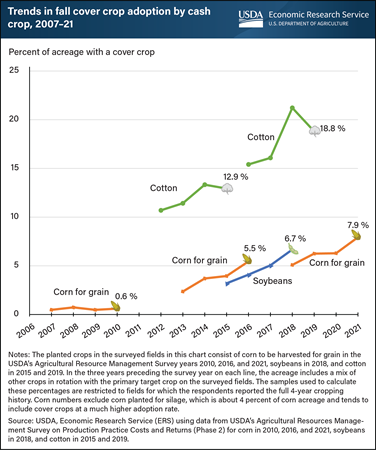
Cover crops are an increasingly popular management practice that farmers use to provide seasonal living cover between their primary commodity cash crops. Farmers often plant cover crops in the fall to provide winter cover for soil that otherwise would be bare. Over the past decade, fall cover crop adoption has grown in the United States, according to data from USDA’s Agricultural Resource Management Survey (ARMS). On fields growing corn for grain, one of the most commonly grown commodity crops, 0.6 percent of the acreage used a fall cover crop before the 2010 crop. By 2016, 5.5 percent of corn-for-grain acreage had a preceding fall cover, and by 2021, 7.9 percent of corn-for-grain acreage followed a fall cover crop. This represents a 44-percent increase in fall cover crop adoption on corn-for-grain fields between 2016 and 2021. The growth in adoption of cover crops on cotton fields is similar, with a 46-percent increase between 2015 and 2019. The ARMS surveys asked farmers to report on the cropping history, including the history of cover crop use, for each selected field. The average within-survey growth in cover crop adoption was similar for each target crop, as evident in the average year-over-year changes. A version of this chart appeared in the USDA, Economic Research Service report Cover Crop Trends, Programs, and Practices in the United States, released in February 2021. This chart adds data for 2019 cotton and 2021 corn-for-grain fields.
Friday, May 20, 2022
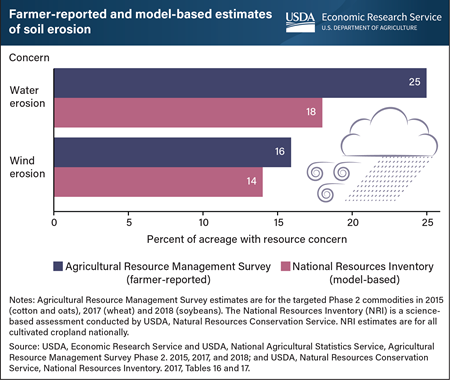
Researchers at USDA, Economic Research Service (ERS) used the USDA’s Agricultural Resource Management Survey (ARMS) to identify farmers’ concerns about soil erosion on their fields, specifically fields growing oats or cotton in 2015, wheat in 2017, and soybeans in 2018. Across all acreage represented in the selected ARMS data, farmers reported that 25 percent of acres had water-driven erosion and 16 percent had wind-driven erosion. ERS researchers compared these self-reported measures to estimates from the National Resources Inventory (NRI), a science-based assessment conducted by USDA’s Natural Resources Conservation Service. The 2017 NRI found that about 18 percent of cultivated cropland had water-driven erosion. For the NRI, a field is determined as having a problem with water-driven erosion if annual soil losses exceed its soil loss tolerance, which is the maximum rate of annual soil loss that still permits sustained economic crop production. The NRI assessment also found that about 14 percent of all cultivated cropland had more soil losses from wind-driven erosion than its soil loss tolerance. The difference in rates of erosion between the two data sources may reflect farmer perceptions about what is considered an erosion problem relative to the criteria used in the NRI. This chart can be found in the ERS report USDA Conservation Technical Assistance and Within-Field Resource Concerns, published in May 2022.
Friday, May 6, 2022
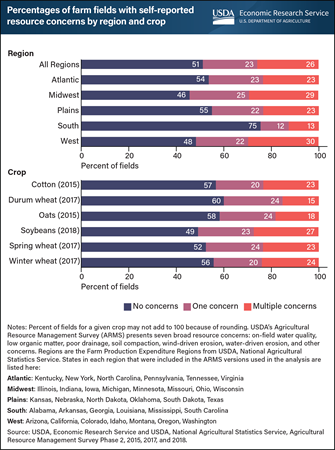
When management practices degrade a natural resource used in farming to the degree that its sustainability or intended use is impaired, then a given land unit is said to have a resource concern. The Natural Resources Conservation Service (NRCS) has identified 47 specific resource concerns affecting crop fields in the United States. ERS researchers classified the soil and water resource concerns from this list into seven broad categories in USDA’s Agricultural Resource Management Survey (ARMS). These seven broad concerns are on-field water quality, low organic matter, poor drainage, soil compaction, wind-driven erosion, water-driven erosion, and other concerns. Cotton, wheat, oat, and soybean farmers were asked to report if they were experiencing one or multiple of the seven categories of concerns on the fields surveyed by ARMS between 2015 and 2018. Overall, farmers represented across these surveys reported that 49 percent of their fields had at least one resource concern and 26 percent of their fields had two or more concerns. The percentages of fields with at least one self-reported resource concern varied by region. Resource concerns were most common in the Midwest, the largest region by the number of fields, and were least common in the South. Farmers growing soybeans reported that about 51 percent of their fields have one or multiple resource concerns. Farmers growing durum wheat, which covers 2-5 percent of the total wheat area in the country, reported one or more resource concerns on about 40 percent of fields. This chart is drawn from the USDA, Economic Research Service report “USDA Conservation Technical Assistance and Within-Field Resource Concerns,” published May 2022.
Friday, October 1, 2021
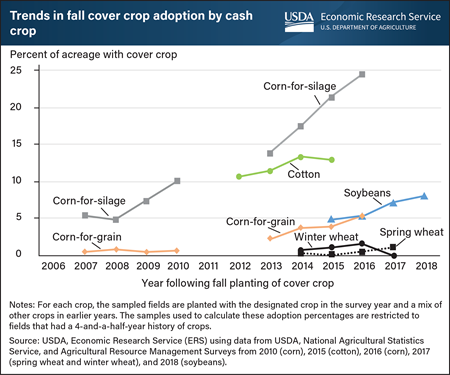
Farmers typically add cover crops to a rotation between two commodity or forage crops to provide seasonal living soil cover. According to data from USDA’s Agricultural Resource Management Surveys, the level of cover crop adoption varies according to the primary commodity. In the fall preceding the survey year, farmers adopted cover crops on 5 percent of corn-for-grain (2016), 8 percent of soybean (2018), 13 percent of cotton (2015) and 25 percent of corn-for-silage (2016) acreage. The adoption rate in the survey year (2017) was lowest for winter wheat. This reflects the fact that farmers typically plant cover crops around the same time as winter wheat in the fall, which makes it difficult to grow both winter wheat and a fall-planted cover crop in the same crop year. In contrast, the rate of cover crop adoption was highest on corn-for-silage fields in the 2016 survey. Because corn silage is used exclusively for feeding livestock, farmers planting corn-for-silage may also grow cover crops for their forage value. Corn-for-silage also affords a longer planting window for cover crops compared with corn planted for grain because of an earlier harvest, and cover crops can help address soil health and erosion concerns on fields harvested for silage. Harvesting corn-for-silage involves removing both the grain and the stalks of the corn plant, leaving little plant residue on the field after harvest. This chart appears in the ERS report Cover Crop Trends, Programs, and Practices in the United States, released in February 2021
Friday, August 20, 2021
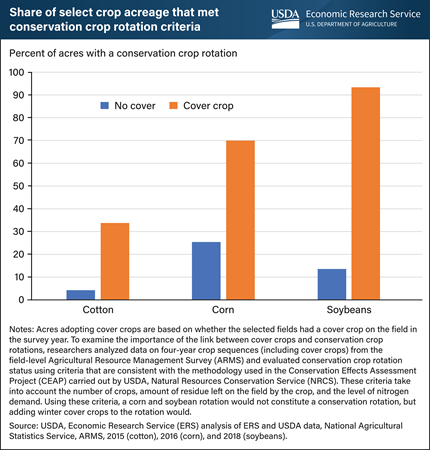
A conservation crop rotation involves a sequence of crops grown on the same ground over a period of time for conservation purposes, such as soil erosion control, soil health, and increased crop diversity. To meet the conservation practice standard for a conservation crop rotation as determined by USDA, Natural Resources Conservation Service (NRCS), a given field must include crops, such as many small grains, that generate greater residue (crop materials such as stalks, stems, or leaves that are left in the field after the crop has been harvested) and meet crop diversity requirements across years. Cropping systems that include cover crops are more likely to meet the standard. Cover crops are typically added to a crop rotation between two commodity or forage crops to provide living, seasonal soil cover. For corn, 70 percent of acres with cover crops in 2016 were in fields that met the criteria for a conservation crop rotation, compared to 26 percent of acres without a cover crop that also met the criteria. For cotton in 2015, 34 percent of acres that used a cover crop were in a conservation crop rotation, compared to only 4 percent of acres without a cover crop that met conservation crop rotation criteria. For soybeans in 2018, 94 percent of acres that used a cover crop met conservation crop rotation criteria, compared to only 13 percent of acres without a cover crop that also met those criteria. The association between cover crops and the use of conservation rotations in corn and cotton is more limited than for soybeans because corn and cotton fields may not include a legume or other crop with low-nitrogen fertilizer demands. This chart appears in the ERS report Cover Crop Trends, Programs, and Practices in the United States, released February 2021.
Friday, July 9, 2021
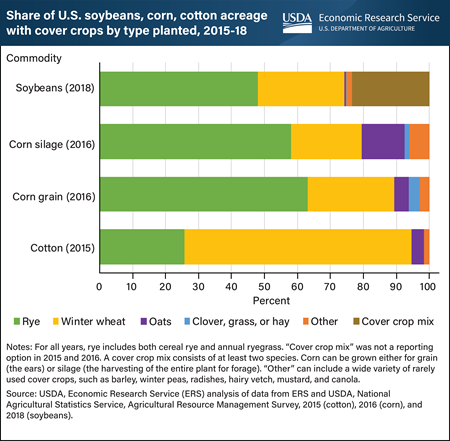
Cover crops—which farmers add to a crop rotation in between the planting of two crops—provide living, seasonal soil cover with a variety of benefits, such as increased soil moisture capacity, weed suppression, and reduced nutrient runoff. Researchers from USDA, Economic Research Service (ERS) reported which cover crops were grown the fall before planting corn, cotton, and soybeans. For corn fields intended for use as grain or silage (the harvesting of the entire plant for forage) in 2016, more than 90 percent of acres with cover crops used a grass or small grain cover crop, such as rye, winter wheat, or oats. At 63 percent of acreage, rye was more than twice as common as winter wheat (26 percent) as the cover crop on corn for grain fields. Rye and winter wheat were also the most common cover crops on soybean fields in 2018. Winter wheat was the most common cover crop used on cotton fields in 2015. This likely reflects the role of wheat stubble in protecting cotton seedlings from wind and the potentially negative impact of certain chemicals produced by cereal rye on growing cotton plants. This chart appears in the ERS report Cover Crop Trends, Programs, and Practices in the United States, released in February 2021. It also appears in the July 2021 Amber Waves finding Grass Cover Crops, Such as Rye and Winter Wheat, Were the Most Common Cover Crops Used Before Planting Corn, Soybeans, and Cotton.
Thursday, April 22, 2021
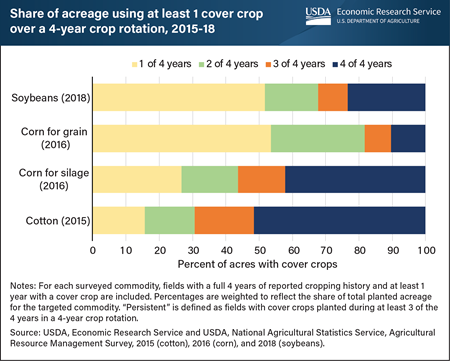
The use of cover crops on U.S. cropland increased 50 percent between 2012 and 2017, according to data in the U.S. Census of Agriculture. Cover crops—such as unharvested cereal rye, oats, winter wheat, and clover—are typically added to a crop rotation during the period between two commodity or forage crops. Persistent year-after-year adoption of cover crops (defined as 3 or 4 years of adoption within a 4-year crop rotation) can increase the accumulation of soil organic matter and provide a living, seasonal coverage of soil. Together, those two outcomes benefit farmers and the ecosystem. For example, healthier soils with consistent living cover can reduce the runoff of sediments and nutrients into waterways, increase soil moisture capacity, and sequester carbon. Among fields that adopted a cover crop in at least 1 year of the rotation, persistent cover crop use occurred on 69 percent of cotton acres (2015), 56 percent of corn-for-silage acres (2016), 19 percent of corn-for-grain acres (2016), and 32 percent of soybean acres (2018). Nationally, cover crop acreage has increased over time as conservation programs have promoted cover crop adoption through research, technical assistance, and financial assistance. Many of the fields with only 1 or 2 years of cover crops are those that started planting in the third or fourth year surveyed, suggesting that they may be new adopters. This chart appears in the Economic Research Service report Cover Crop Trends, Programs, and Practices in the United States, released February 2021, and in the March 2021 Amber Waves article, Persistent Cover Crop Adoption Varies by Primary Commodity Crop.
Monday, September 14, 2020
Errata: On October 30, 2020, the Chart of Note was revised to correct shares of land exiting the Conservation Reserve Program (CRP) by land use category. Land used for crop land was corrected to 79 percent. Land used for trees was corrected to 6 percent. No other values were affected.
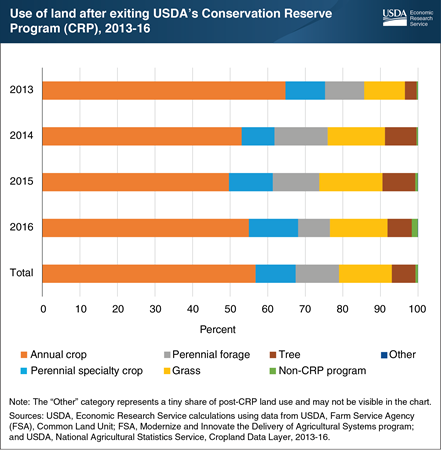
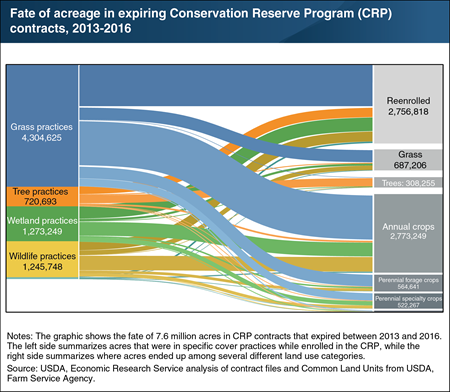
Between 2013 and 2016, contracts for about 7.6 million acres of land enrolled in USDA’s Conservation Reserve Program (CRP) expired. About 2.76 million acres of expiring land reenrolled in the CRP. Of the almost 4.89 million acres that exited the program during the period, 57 percent transitioned to annual crop production. At least half of the exiting CRP land transitioned to annual crop production in each of the four years. The most common annual crops grown on expired CRP land were soybeans (21 percent of the exiting CRP land that went into annual crop production), corn (16 percent), and wheat (16 percent). Perennial forage (such as alfalfa) and specialty crop (such as pecans) production accounted for 12 and 11 percent, respectively. Taken together, 79 percent of former CRP land was put to some type of crop production (annual, perennial forage, or perennial specialty) after exiting the program. The remaining exiting land was most often used as grass cover (14 percent) or tree cover (6 percent). Post-CRP acreage under grass cover may be used as pastureland or represent acres that are untouched after expiring from a grassland practice in CRP. This chart appears in the December 2019 ERS report, The Fate of Land in Expiring Conservation Reserve Program Contracts, 2013-2016.
Monday, April 13, 2020
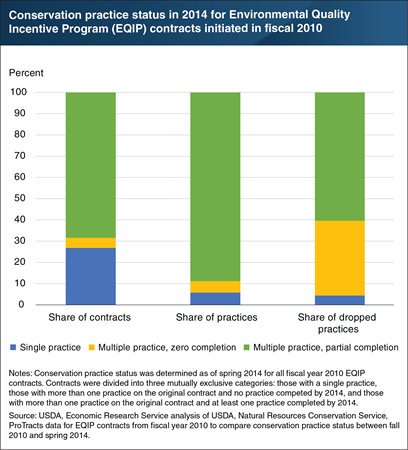
Under USDA’s Environmental Quality Incentives Program (EQIP), farmers and ranchers voluntarily agree to implement specific conservation practices in exchange for technical and financial assistance. To study how well program incentives line up with participant motivations, ERS researchers collected practice status information about four years after the EQIP contracts were originally signed. Overall, most EQIP contracts were completed as planned—about 80 percent of conservation practices signed in 2010 were completed as originally specified by 2014. For the 20 percent of practices that were dropped, only about 40 percent occurred with the entire contract cancelled or terminated. Some EQIP contracts are simple (single conservation practice), but most contracts are complex (multiple practices). Simple contracts represented 5 percent of all practices on contracts signed in 2010, and slightly less than 5 percent of all conservation practices dropped by 2014. Complex contracts that were entirely cancelled or terminated contained 35 percent of all of the practices dropped (by 2014) even though those same contracts only represent 5 percent of all practices (completed and dropped by 2014). However, the largest share of dropped practices (almost 60 percent) occurred on complex contracts where at least one of the originally planned practices was completed as planned. This suggests that farmers’ incentives to complete conservation practices can vary within a contract. This chart uses data from the Economic Research Service (ERS) report, Working Lands Conservation Contract Modifications: Patterns in Dropped Practices, released March 2019. The topic is also discussed in the ERS Amber Waves article, “Partially Completed Conservation Contracts Reveal On-Farm Practice Incentives.”
Monday, January 13, 2020
Errata: On December 4, 2020, the Chart of Note was revised. The acreages shown in the figure were updated to correct an undercounting of roughly 188 acres of land that exited USDA’s Conservation Reserve Program over the study period.
ERS researchers tracked the fate of 7.6 million acres of Conservation Reserve Program (CRP) land in contracts that expired between 2013 and 2016. About 36 percent of expiring land (2.76 million acres) reenrolled into the CRP. Of the about 4.89 million acres that exited the program (i.e. were not reenrolled), nearly 80 percent of the land was put into some type of crop production—with the remainder going into grass, tree, and other non-agricultural covers. CRP land associated with tree practices was the most likely to be reenrolled in the program, at a rate of 47 percent, compared with 35 percent of land in grass practices and 29 percent of land in wildlife practices. Of land that did not reenroll, 77 percent of land in a tree practice retained a tree cover, and only 13 percent went to annual crop production. In contrast, 65 percent of land in a wetland practice and 59 percent of land in a grass practice went to annual crop production. This chart appears in the January 2020 ERS report, The Fate of Land in Expiring Conservation Reserve Program Contracts, 2013-2016.
Friday, September 20, 2019
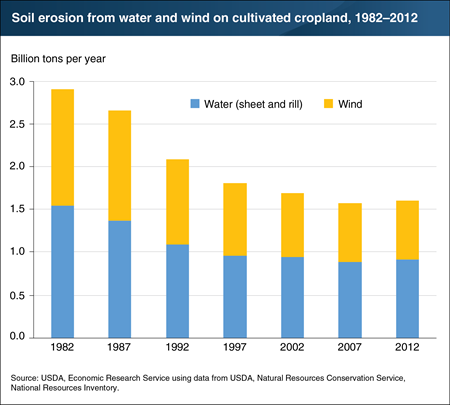
As farmers have adopted soil health and conservation practices like conservation tillage, they have helped reduce soil erosion on the Nation’s working lands. Data from USDA’s National Resources Inventory (NRI) show erosion on cultivated cropland due to water and wind has declined by 45 percent, from 2.9 billion tons in 1982 to 1.6 billion tons in 2012. Though part of this decline is due to less land being cropped over time, a larger portion is due to changes in farm management practices. Reducing erosion is an important first step toward improving soil health, which can increase yields in crop and forage production. Healthy soil also has a positive impact on water quality, decreasing nutrient runoff into streams and rivers. In addition, healthier soil tends to have a greater ability to hold water, which can give crops greater drought resilience. This chart appears in the May 2019 ERS report, Agricultural Resources and Environmental Indicators, 2019. It is also in the August 2019 Amber Waves feature, “Conservation Trends in Agriculture Reflect Policy, Technology, and Other Factors.”
Friday, September 6, 2019
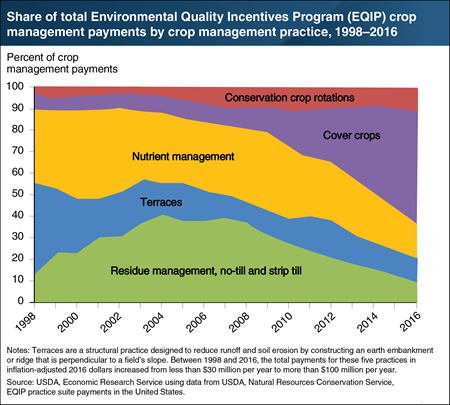
USDA conservation programs provide nearly $6 billion annually for financial and technical assistance to support the adoption of conservation practices on U.S. farms. This conservation effort relies mainly on voluntary incentive programs. The largest single conservation program (in terms of budget) is the Conservation Reserve Program (CRP), which provides funding for the retirement of environmentally sensitive land. However, the largest share of conservation funding goes toward incentivizing conservation practices on lands that remain in production, or “working lands.” The Environmental Quality Incentives Program (EQIP) is one such program, which provides financial assistance to farmers who adopt or install conservation practices on land in agricultural production. EQIP expenditures for crop management practices focused on five categories of practices—conservation crop rotations, cover crops, nutrient management, terraces, and conservation tillage (residue management). Farmers who use cover crops grow a crop (often over the winter) that will be left in place as residue or incorporated into the soil to increase organic matter. Between 1998 and 2016, the share of EQIP expenditures going to nutrient management and terracing decreased, while the share of expenditures going to cover crops increased. This chart appears in the May 2019 ERS report Agricultural Resources and Environmental Indicators, 2019. Also see the August 2019 Amber Waves feature, “Conservation Trends in Agriculture Reflect Policy, Technology, and Other Factors.”
Friday, July 26, 2019
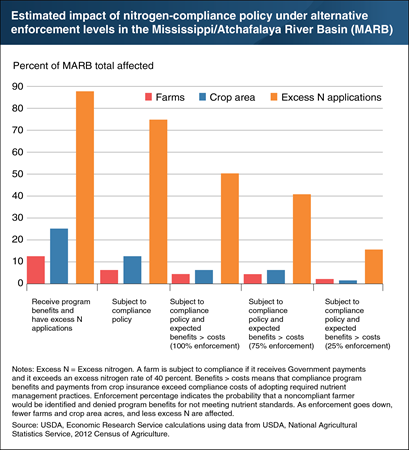
Excess nitrogen runoff from agriculture into the northern Gulf of Mexico is a major contributor to zones of reduced oxygen that pose seasonal dangers to aquatic life and fishing stocks. ERS has studied potential regulatory tools that could provide incentives to adopt nutrient-reducing management practices, such as requiring conservation compliance to qualify for USDA farm program benefits. ERS researchers explored the scope and effectiveness of a hypothetical “nutrient compliance” policy requiring farmers who receive Federal farm program benefits (including conservation and commodity program payments) to limit excess nitrogen fertilizer applications on land within the Mississippi/Atchafalaya River Basin (MARB). The researchers estimated that 14.4 percent of farms in the MARB, controlling 25.1 percent of cropland, apply nitrogen in excess of crop needs and receive program benefits—but that these farms contribute 88.1 percent of all excess nitrogen applications in the MARB. The analysis suggests that 8.7 percent of MARB farms would be affected by a compliance policy that disallows application of nutrients at levels greater than 40 percent above crop needs. Both the expected compliance benefits to farmers and hence the effectiveness of the nutrient compliance policy are influenced by the chance of being found out-of-compliance through inspection and enforcement. It was found that as enforcement goes down, fewer farms and crop area acres, and less excess nitrogen are affected. For example, assuming 100-percent enforcement, the analysis suggests that 71 percent of affected farms would have an incentive to comply (because program benefits exceed nutrient management costs). With an enforcement rate of 25 percent, by comparison, the share of farms estimated to comply falls to 31 percent of those affected by compliance (or 2.7 percent of all farms in the MARB), and the share of excess nutrients that would be controlled falls to 15.7 percent. This chart appears in the ERS report Reducing Nutrient Losses From Cropland in the Mississippi/Atchafalaya River Basin: Cost Efficiency and Regional Distribution, released September 2018.
Thursday, May 2, 2019
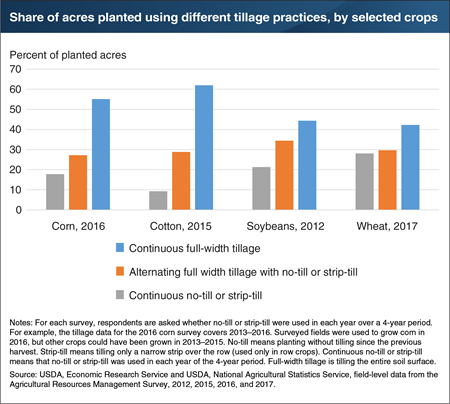
Tillage—the mechanical manipulation of the soil—helps to prepare the soil for planting, control weeds, incorporate surface-applied manure or fertilizer, and encourage soil warming for early planting. In recent decades, some farmers have eliminated the use of tillage altogether using “no-till” methods, or limited tillage to narrow strips where row-crops will be planted using “strip-till” methods. No-till and strip-till minimize soil disturbance and keep crop residue on the soil surface to reduce erosion and conserve soil moisture. Recent ERS research shows that many farmers who use no-till or strip-till often alternate these practices with full-width tillage (tilling the entire soil surface). On land where corn was planted in 2016, for example, no-till or strip till was used continuously during 2013–2016 on 18 percent, no-till or strip-till was used alternately with full width tillage on 27 percent, and full-width tillage was used continuously on 55 percent. The exact mix of tillage practices varied across the surveys. One reason farmers alternate tillage practices is because of crop rotation. For example, corn and soybeans are often grown in rotation, but farmers used no-till or strip-till more often for soybeans (about 34 percent in 2012) than for corn (27 percent in 2016). In many cases, farmers use no-till when growing soybeans, but use full-width tillage when growing corn. This chart appears in the ERS report, Tillage Intensity and Conservation Cropping in the United States, released September 2018.
Monday, April 22, 2019
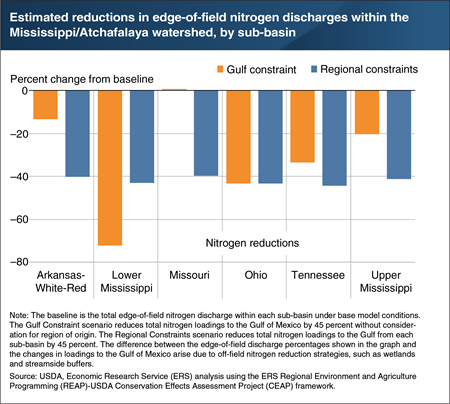
Every summer, a “hypoxic zone” forms in the Gulf of Mexico where dissolved oxygen is too low for many aquatic species to survive. This zone is fueled by nutrient (nitrogen and phosphorus) runoff from the Mississippi/Atchafalaya River Basin, a region containing about 70 percent of U.S. cropland. Recent ERS research modeled two scenarios for reducing nitrogen loadings to the Gulf of Mexico by 45 percent. The Gulf Constraint scenario reduces nitrogen loadings at the lowest cost, without consideration of the regional origin of nutrients. The greatest nitrogen reductions would occur in the Lower Mississippi sub-basin (reduced to 72 percent of the baseline amount) and in the Ohio sub-basin (43 percent). Because these regions are relatively close to the Gulf and have relatively high baseline nitrogen discharges per acre (i.e., high potential to reduce discharges by adopting low-cost conservation practices), the estimated cost of reducing nitrogen loadings originating here is generally lower than elsewhere. On the other hand, the Regional Constraints scenario evenly reduces nitrogen loadings by 45 percent from each of the sub-basins. Under the Regional scenario, total edge-of-field nitrogen reductions (and aggregate costs) are projected to rise relative to the Gulf scenario for the Tennessee, Upper Mississippi, Missouri, and Arkansas-White-Red sub-basins and drop for the Lower Mississippi region. This chart appears in the ERS report, Reducing Nutrient Losses From Cropland in the Mississippi/Atchafalaya River Basin: Cost Efficiency and Regional Distribution, released September 2018.
Tuesday, March 26, 2019
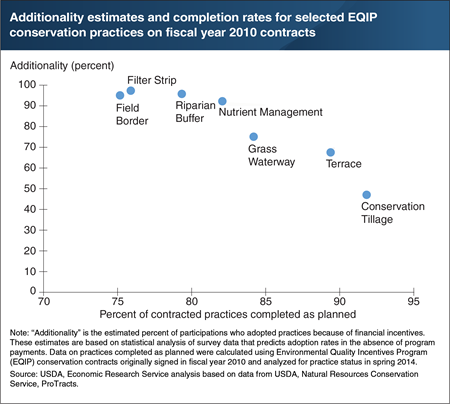
The Environmental Quality Incentives Program (EQIP) and other USDA working lands programs provide payments to farmers and ranchers who sign contracts to adopt certain conservation practices. Most contracted practices are implemented as planned. But some types of practices, such as installation of field borders and filter strips, are less likely to be completed. While USDA can reallocate funding that would have gone toward uncompleted practices, modifying contracts requires additional USDA staff resources and leads to delays in getting conservation efforts on the ground. However, there is a tradeoff between practices that have higher rates of completion and practices that have higher rates of “additionality.” Additionality is a measure of payment effectiveness that estimates the percentage of producers who adopted the practices because of the financial assistance. This research shows that practices that are less likely to be completed tend to have higher additionality. All efforts to incentivize behavior face a challenge in achieving greater additionality because it is difficult for program managers to observe the private incentives to adopt practices in the absence of payments. The tradeoff between additionality and completion rates is a direct reflection of these hidden incentives. One implication of this research is that practice completion rates, which can be easily calculated using program administrative data, could be used as an indirect measure of additionality. This chart appears in the ERS report, Working Lands Conservation Contract Modifications: Patterns in Dropped Practices, released March 2019.


