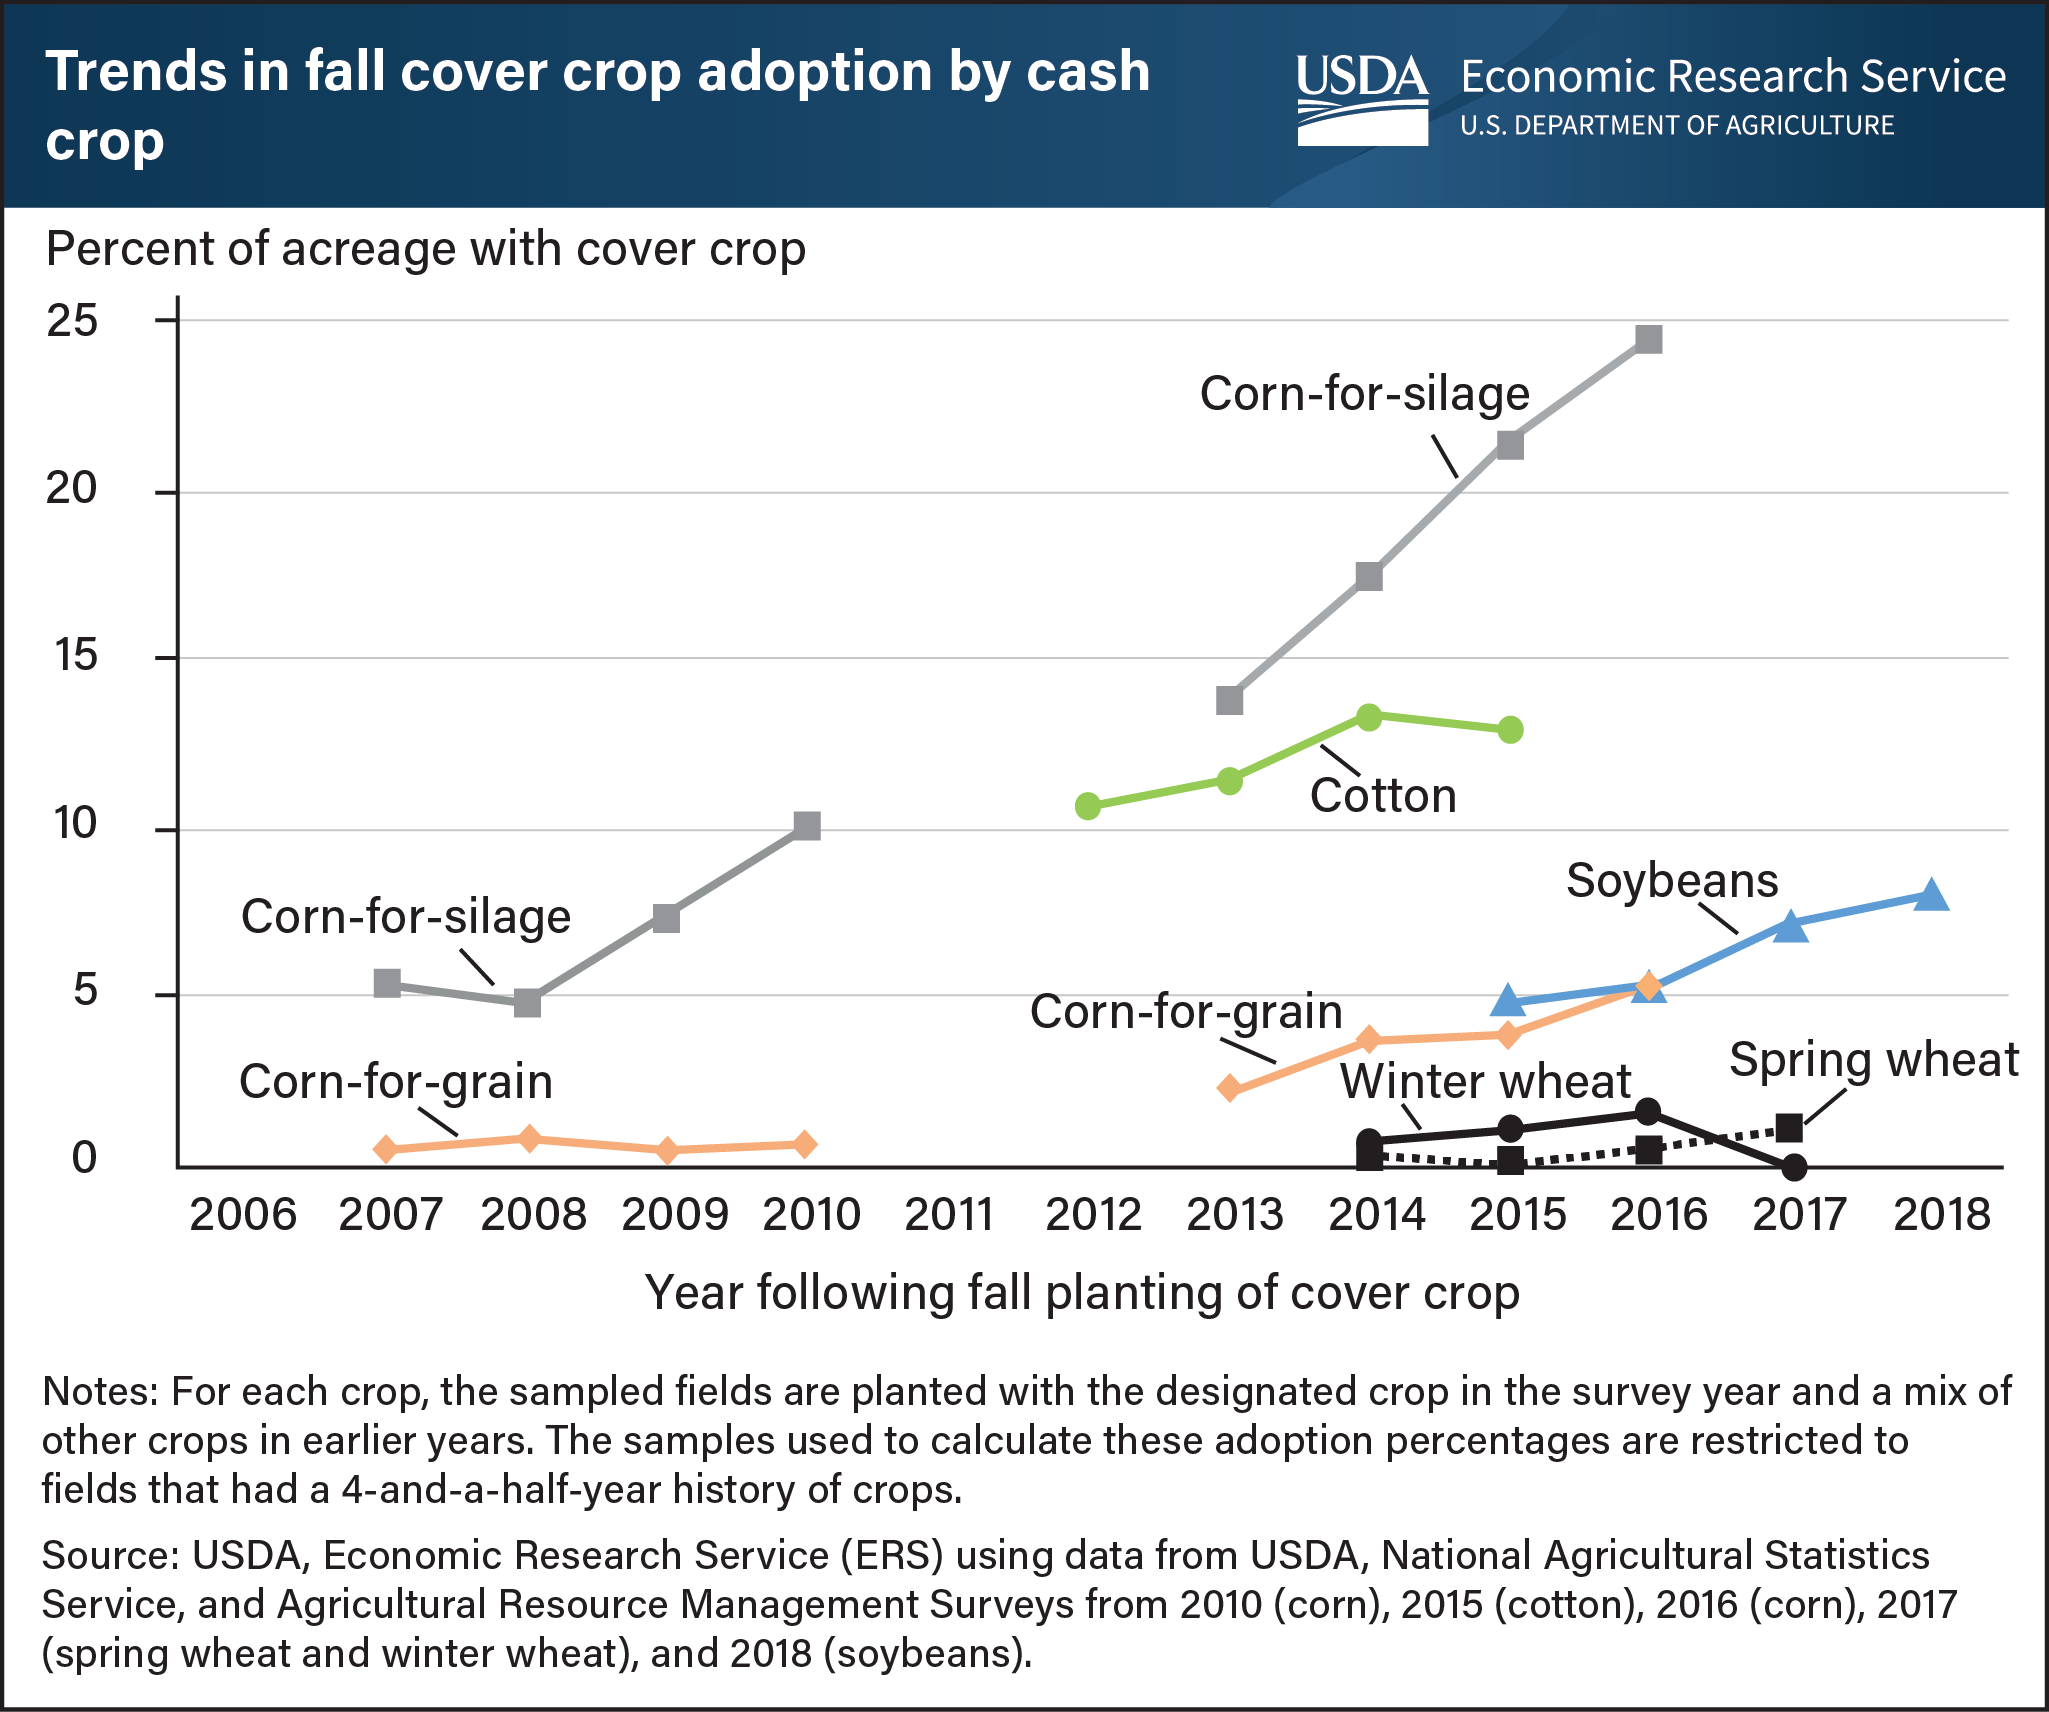
Rates of cover crop adoption vary depending on the cash crop being planted
- by Maria Bowman and Steven Wallander
- 10/1/2021

Farmers typically add cover crops to a rotation between two commodity or forage crops to provide seasonal living soil cover. According to data from USDA’s Agricultural Resource Management Surveys, the level of cover crop adoption varies according to the primary commodity. In the fall preceding the survey year, farmers adopted cover crops on 5 percent of corn-for-grain (2016), 8 percent of soybean (2018), 13 percent of cotton (2015) and 25 percent of corn-for-silage (2016) acreage. The adoption rate in the survey year (2017) was lowest for winter wheat. This reflects the fact that farmers typically plant cover crops around the same time as winter wheat in the fall, which makes it difficult to grow both winter wheat and a fall-planted cover crop in the same crop year. In contrast, the rate of cover crop adoption was highest on corn-for-silage fields in the 2016 survey. Because corn silage is used exclusively for feeding livestock, farmers planting corn-for-silage may also grow cover crops for their forage value. Corn-for-silage also affords a longer planting window for cover crops compared with corn planted for grain because of an earlier harvest, and cover crops can help address soil health and erosion concerns on fields harvested for silage. Harvesting corn-for-silage involves removing both the grain and the stalks of the corn plant, leaving little plant residue on the field after harvest. This chart appears in the ERS report Cover Crop Trends, Programs, and Practices in the United States, released in February 2021.

