ERS Charts of Note
Subscribe to get highlights from our current and past research, Monday through Friday, or see our privacy policy.
Get the latest charts via email, or on our mobile app for  and
and 
Friday, January 6, 2017
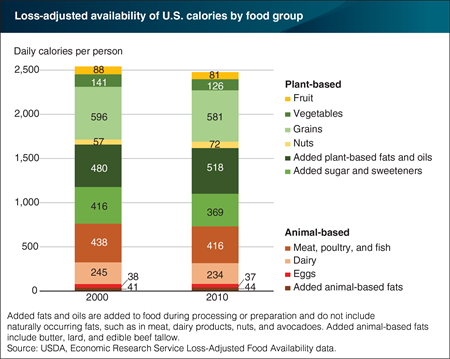
ERS’s loss-adjusted food availability data provide estimates of the sources of calories in the U.S. diet. These data are derived from the supply of food available for consumption and adjusted for inedible peels and pits and for spoilage, plate waste, and other losses to more closely approximate actual intake. Loss-adjusted daily calories per person decreased by 2 percent between 2000 and 2010 from 2,545 to 2,481 calories. The share of calories from animal- and plant-based foods was the same in both years at 30 percent and 70 percent, respectively. In both years, grains were the primary contributor to daily calories per capita. Added plant-based fats and oils—such as salad and cooking oils, margarine, and shortening—ranked second, followed by meat, poultry, and fish. Per capita availability of calories from nuts showed the largest percentage change, posting a 25-percent increase to 72 calories per day in 2010. Calories from the vegetable and added sugar and sweeteners categories decreased by 11 percent. This chart appears in “A Look at Calorie Sources in the American Diet” in the December 2016 issue of ERS’s Amber Waves magazine.
Friday, December 9, 2016
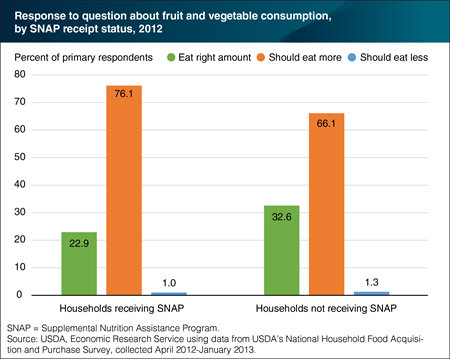
The 2015-2020 Dietary Guidelines for Americans recommends that adult men and women eat between 2 to 3 cups of vegetables per day and 1½ to 2 cups of fruit per day. To help gauge perceived dietary habits, respondents in USDA’s National Household Food Acquisition and Purchase Survey (FoodAPS) were asked a series of questions about their health and diet. When the primary respondents (the main food shopper or meal planner in the household) were asked if they think they eat the right amount of fruits and vegetables or if they should eat more, 76.1 percent of primary respondents in households receiving SNAP benefits said they should eat more. In contrast, 66.1 percent of those who reside in households not receiving SNAP felt they should eat more fruits and vegetables. By better understanding perceived health and dietary habits, food assistance programs may be modified to help Americans follow heathier diets. This chart appears in “FoodAPS Data Now Available to the General Public” in the December 2016 issue of ERS’s Amber Waves magazine.
Thursday, December 1, 2016
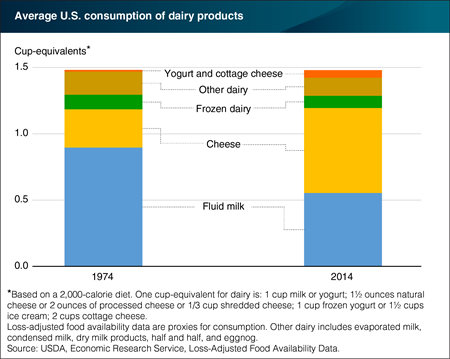
According to ERS’s loss-adjusted food availability data, Americans consumed just under 1.5 cup-equivalents of dairy products per person per day in 1974 and in 2014—half the recommended amount for a 2,000-calorie diet. While Americans are consuming the same number of cup-equivalents of dairy products, the mix has changed. Consumption of cheese has more than doubled during this time from 0.29 cup-equivalents per person in 1974 to 0.64 cup-equivalents per person in 2014, while yogurt consumption grew almost ten-fold to 0.05 cup-equivalents per person. Fluid milk consumption stood at 0.55 cup-equivalents per person in 2014, down from 0.90 cup-equivalents per person in 1974. Several factors have contributed to this decline, including competition from soft drinks, fruit juices, bottled water, and other beverages; generational differences in the frequency of milk drinking; and a more ethnically diverse population, some of whose diets do not normally include fluid milk. This chart is from ERS’s Ag and Food Statistics: Charting the Essentials, updated October 11, 2016.
Wednesday, November 23, 2016
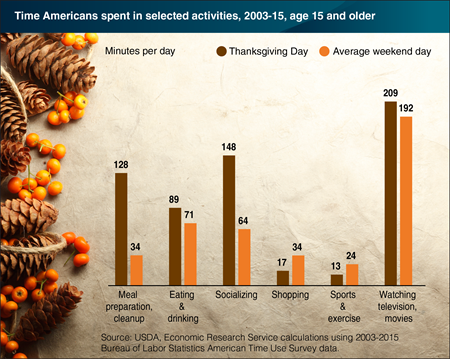
If you think Thanksgiving is a day spent cooking, eating, and socializing, you are correct. On this national holiday over a survey period of 2003-15, Americans spent an average of 128 minutes in meal preparation and cleanup—over three times the 34 minutes spent on these tasks on an average Saturday or Sunday. Time spent eating and drinking is greater as well--89 minutes on Thanksgiving versus an average of 71 minutes on a average weekend day. Socializing time is over twice the weekend average—148 minutes versus 64 minutes. All this cooking, cleaning, and socializing leaves less time for other weekend activities. The average time spent in sports and exercise is less on Thanksgiving, as is time spent on shopping, including online purchases. Less time is also spent on paid work (32 minutes versus 75 minutes) and travel (55 minutes versus 72 minutes) due to less commuting. Time spent watching television and movies, however, is about the same as the average weekend day. This chart uses data from the Bureau of Labor Statistics American Time Use Survey and draws from the ERS report, Americans’ Eating Patterns and Time Spent on Food: The 2014 Eating & Health Module Data.
Friday, November 18, 2016
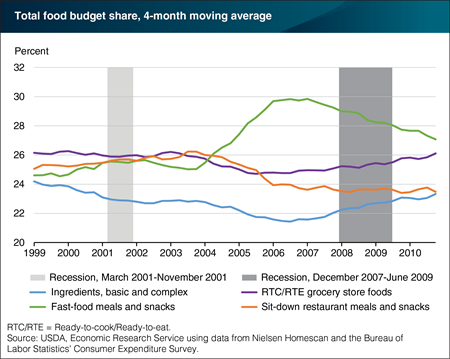
A recent ERS analysis found that between 1999 and 2006, the share of the average household food budget allocated to basic and complex ingredients fell steadily from around 24.7 to 20.8 percent, but then began to climb reaching 24.2 percent in 2010. Basic ingredients, such as milk and fresh meats, and complex ingredients, such as mayonnaise and bread, are grocery store foods used to prepare a meal or snack. The food budget share—defined as total expenditures at grocery stores and eating-out places—spent on ready-to-cook and ready-to-eat grocery store foods followed a somewhat similar, but muted, pattern. The upturn in food budget share devoted to ingredients and ready to eat/cook grocery foods began almost a year before the 2007-09 recession and its aftermath—a time when many consumers cut back on eating out, especially fast food meals and snacks. The share of the total food budget spent in fast-food outlets where customers order and pay at a counter grew until 2007 to 30.6 percent, then declined to 25.7 percent in 2010. This chart appears in “Purchases of Foods by Convenience Type Driven by Prices, Income, and Advertising” in the November 2016 issue of ERS’s Amber Waves magazine.
Friday, November 4, 2016
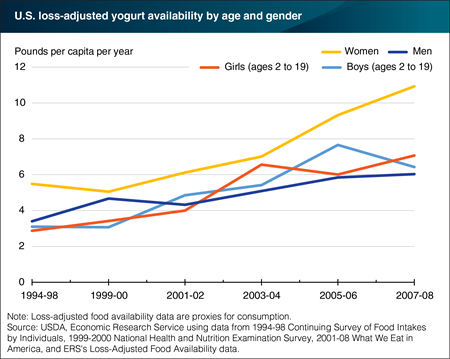
As the grocery store dairy case illustrates, yogurt’s popularity in the United States is on the rise. According to ERS’s loss-adjusted availability data (proxies for consumption), supplies of yogurt available for U.S. consumers to eat grew from 3.6 pounds per person in 1994 to 10.3 pounds per person in 2014. Linking ERS’s loss-adjusted food availability data with intake surveys from 1994-2008 allows a look at estimated consumption by demographic groups and reveals that yogurt is especially popular with American women. In each survey year, women’s per person estimated consumption was higher than men’s, boys’, and girls’. Men consumed more yogurt per person than boys and girls in 1994-98 and 1999-2000, but by 2001-02, children’s consumption of yogurt was higher than men’s. In 2007-08, U.S. women consumed an estimated 10.9 pounds of yogurt per person, followed by girls at 7.0 pounds per person, boys at 6.3 pounds per person, and men’s at 6.1 pounds per person. Over 1994-2008, consumption of yogurt grew for both lower and higher income groups; for adults with less than a high school education, high school graduates, and college graduates; and across all racial/ethnicity groups. The data for this chart and similar information on 62 other food commodities can be found in the ERS report, U.S. Food Commodity Consumption Broken Down by Demographics, 1994-2008, March 2016.
Wednesday, November 2, 2016
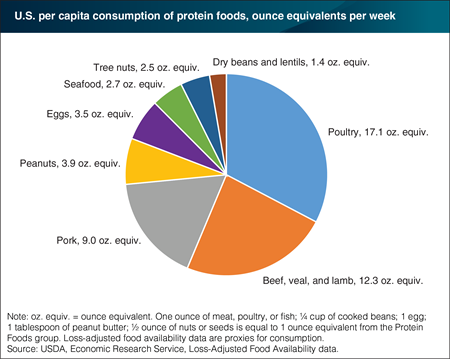
Seafood (fish and shellfish) is a nutrient-rich source of dietary protein which is relatively low in calories and saturated fat compared to some other protein sources. The 2015-2020 Dietary Guidelines for Americans recommends that Americans eat a variety of protein foods, including at least two servings of seafood per week. According to ERS loss-adjusted food availability data, Americans consumed about 2.7 ounces of fish and shellfish per person per week in 2014, about one-third of the 8-ounce weekly minimum recommended for an average 2,000-calorie diet. Consumers’ appetites for fish and shellfish lagged behind most other foods in the protein group. Seafood demand may be limited by a number of factors, including a lack of awareness about the health benefits of seafood, inexperience with cooking methods and recipes, higher retail prices on average when compared with meat and poultry, and concerns about food safety and mislabeling of imported seafood products. This chart appears in “Americans’ Seafood Consumption Below Recommendations” in the October 2016 issue of ERS’s Amber Waves magazine.
Thursday, October 27, 2016
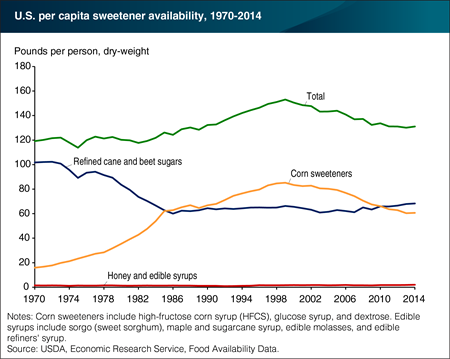
In 2014, 131.0 pounds per person of caloric sweeteners were available for consumption by U.S. consumers, down from a high of 153.1 pounds per person in 1999. Availability of total corn sweeteners (high-fructose corn syrup (HFCS), glucose syrup, and dextrose) contributed to the drop, falling from its peak of 85.2 pounds per person in 1999 to 60.7 pounds per person in 2014. High corn prices, price competition with refined cane and beet sugars and other caloric sweeteners, as well as shifting preferences among consumers and food manufacturers have contributed to this decline. Availability of refined cane and beet sugars fell from 101.8 pounds per person in 1970 to 62.7 pounds per person in 1985, then remained relatively flat for the next two and a half decades. Refined sugar availability began to rise in 2011, surpassing corn sweetener availability and reaching 68.3 pounds per person in 2014. Rising honey imports have contributed to recent increases in per capita honey availability. In 2014, per capita honey availability stood at 1.2 pounds and per capita availability of edible syrups was 0.8 pounds. This chart is from ERS’s Ag and Food Statistics: Charting the Essentials, updated October 11, 2016.
Tuesday, October 18, 2016
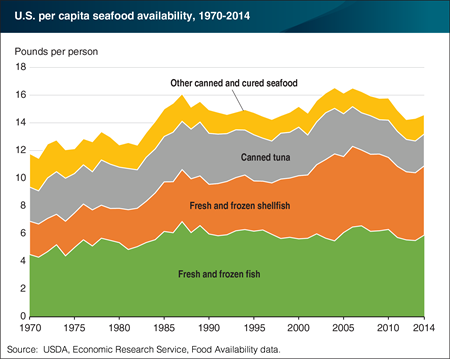
The supply of seafood available for consumption in the United States is up from 11.7 pounds per person in 1970—but down from a peak of 16.5 pounds in 2006—according to ERS food availability data. In 1970, fresh and frozen shellfish accounted for 21 percent of seafood availability. In 2014, by comparison, fresh and frozen shellfish (mostly shrimp) accounted for 34 percent of the 14.5 pounds per capita of seafood available for consumption. New efficiencies in shrimp aquaculture beginning in the early 1980s, which sharply increased availability and reduced prices, made shrimp a popular menu item at fast casual dining places across the United States. A 35-percent decline in canned tuna availability since 2000 was largely offset by a surge in fresh and frozen fish availability from low-cost imports of farm-raised salmon and tilapia and the increased use of wild-caught Alaska pollock in frozen fish sticks, imitation crab meat, and fast-food sandwiches. This chart appears in “Americans’ Seafood Consumption Below Recommendations” in the October 2016 issue of ERS’s Amber Waves magazine.
Tuesday, September 20, 2016
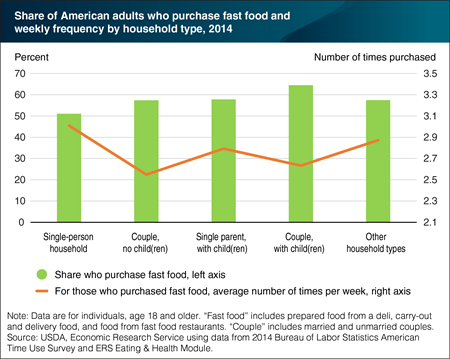
Eating out accounts for a significant share of Americans’ food budgets and diets. ERS analysis of data from the Eating and Health Module of the American Time Use Survey provides a snapshot of which household types are purchasing “fast food” and how often. Fast food in the analysis includes prepared food from a deli, carry-out and delivery food, and food from a fast food restaurant. Over an average week in 2014, 58.2 percent of American adults purchased fast food and those who purchased fast food did so an average of 2.7 times. Couples with children were the most likely to purchase fast food (64.5 percent), whereas single-person households were the least likely (51.1, percent). However, single-person households had the highest average number of weekly fast food purchases. Men who purchased fast food did so an average of 3 times per week, whereas women who had purchased fast food averaged 2.5 times. This chart appears in the ERS report, Americans’ Eating Patterns and Time Spent on Food: The 2014 Eating & Health Module Data, July 2016.
Tuesday, September 6, 2016
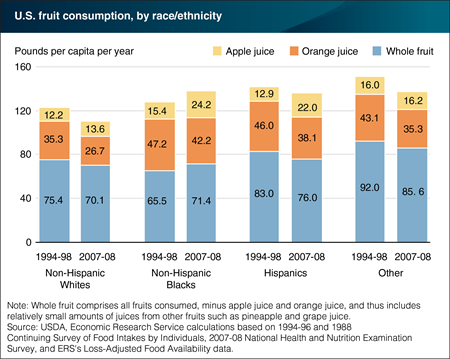
A recent linking of ERS’s loss-adjusted food availability data with food intake surveys from 1994-2008 revealed that Non-Hispanic Blacks were the only group of the racial/ethnic groups examined that had higher whole fruit and total fruit consumption in 2007-08 compared with 1994-98. The 2015-2020 Dietary Guidelines for Americans recommend that at least half of a person’s recommended fruit consumption be whole fruit. Non-Hispanic Blacks increased their whole fruit consumption to 71.4 pounds per person in 2007-08—an amount still below that of Hispanics and the "other" racial/ethnic group. All four racial/ethnic groups consumed smaller quantities of orange juice and larger quantities of apple juice in 2007-08. Non-Hispanic Blacks and Hispanics had the largest increases in apple juice consumption. This chart appears in“A Closer Look at Declining Fruit and Vegetable Consumption Using Linked Data Sources” in the July 2016 issue of ERS’s Amber Waves magazine.
Friday, September 2, 2016
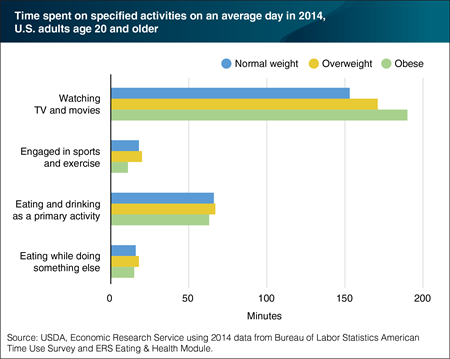
Data from the ERS-developed Eating and Health Module of the American Time Use Survey provide information on activities and behaviors of different segments of the U.S. population. Survey respondents age 20 and older were asked their height and weight, allowing for calculation of their Body Mass Index (BMI) which was then grouped into normal, overweight, and obese weight categories. On an average day in 2014, time spent eating and drinking as a primary, or main, activity did not vary much across the weight groups; neither did eating while doing something else. However, other activities did show different patterns. The most pronounced was watching TV and movies. Obese adults spent an average of 190 minutes a day watching TV and movies, compared with 153 minutes by normal weight individuals and 171 minutes by overweight adults. Sports and exercise was another activity where time use patterns differed. Normal weight and overweight adults spent the same amount of time, statistically-speaking—18 minutes and 20 minutes—engaged in sports or exercise, while those who were obese averaged 11 minutes a day. This chart appears in the ERS report, Americans’ Eating Patterns and Time Spent on Food: The 2014 Eating & Health Module Data, July 2016.
Tuesday, August 23, 2016
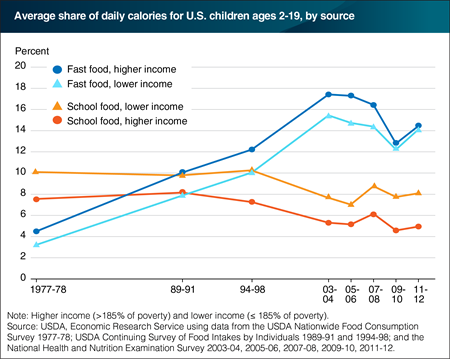
Federal food intake surveys conducted between 1977 and 2012 reveal that, in the 1990s, fast food overtook school food as the largest source of food prepared away from home in children’s diets. However, school foods have remained a more important source of calories for lower income children than for higher income children. The mandated cutoff for free or reduced-price USDA school meals is a household income at or below 185 percent of the Federal poverty level. In 1977-78, school meals provided 10.1 percent of the calories consumed by lower income children eligible for free or reduced-price school breakfasts and lunches and 7.5 percent of higher income children’s total calories. In that same year, fast food provided 4.5 percent of higher income children’s average daily energy intake and 3.2 percent of lower income children’s calories. School food continued to provide about 10 percent of lower income children’s total calories in 1994-98 but, by 2011-12, the school food share fell to 8.1 percent and the fast food share rose to 14.2 percent. This chart appears in “Linking Federal Food Intake Surveys Provides a More Accurate Look at Eating Out Trends” in the June 2016 issue of ERS’s Amber Waves magazine.
Wednesday, August 17, 2016
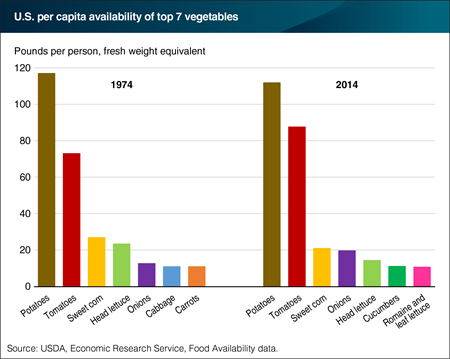
According to ERS’s food availability data, an average of 385.4 pounds of fresh and processed vegetables per person were available for U.S. consumers to eat in 2014, up from 334.1 pounds in 1974, but down from peak per capita vegetable availability of 424.3 pounds in 1996. Potatoes, tomatoes, and sweet corn were the three most popular vegetables in 1974 and remained the most popular in 2014. While per capita availability (a proxy for consumption) of potatoes and sweet corn has declined over the last four decades, per capita tomato availability grew from 73.2 pounds in 1974 to 87.8 pounds in 2014. Fresh tomato availability increased by 74 percent and canned tomatoes by 10 percent. Onion availability also grew from 12.7 to 19.7 pounds per person over 1974-2014. In 2014, cucumbers and romaine and leaf lettuce at 11.3 and 10.8 pounds per capita, respectively, replaced cabbage and carrots in the top 7 rankings. Head lettuce was the fourth most popular vegetable in 1974, but dropped to fifth in 2014, perhaps related to the growing popularity of romaine and leaf lettuce. The data for this chart come from the Food Availability data series, part of ERS’s Food Availability (Per Capita) Data System, updated August 3, 2016.
Friday, August 5, 2016
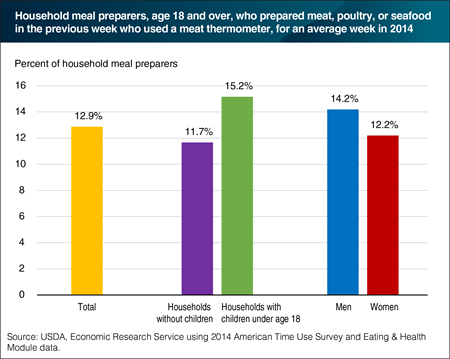
The 2014 ERS Eating & Health Module of the American Time Use Survey features new questions about food safety practices when preparing meals. This is the first nationally-representative, large scale Federal survey to ask Americans about their use of meat thermometers when preparing meat, poultry, or seafood. Survey respondents who said that they are the usual meal preparers or those who split the task with other household members were asked whether they had prepared any meals with meat, poultry, or seafood in the last week. Eighty-nine percent of the usual/split meal preparers prepared some form of meat. Of those, 12.9 percent used a meat thermometer in preparing meals. Meal preparers in households with children had a higher rate of meat thermometer usage (15.2 percent) than in households without children (11.7 percent). The shares of men and women meal preparers who used a meat thermometer—14.2 and 12.2 percent, respectively—were not statistically different from each other. The data for this chart are from the ERS report, Americans’ Eating Patterns and Time Spent on Food: The 2014 Eating & Health Module Data, released on July 28, 2016.
Tuesday, August 2, 2016
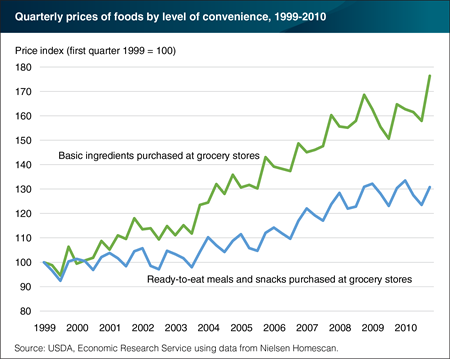
Beginning in 2004, prices of basic food ingredients purchased in grocery stores grew faster than prices of ready-to-eat meals and snacks purchased in grocery stores. Basic ingredients are raw or minimally processed foods, such as milk, dried beans, and fresh meat, used in producing a meal or snack. Ready-to-eat meals and snacks, such as refrigerated entrees and side dishes, yogurt, and candy, require no preparation beyond opening a container. A recent ERS analysis found that between 1999 and 2010, spending by a typical American household on basic ingredients was not as responsive to these price changes as spending on ready-to-eat meals and snacks. In the first quarter of 1999, 5.2 percent of the average food budget was spent on basic ingredients and 18.0 percent on ready-to-eat meals and snacks. By the fourth quarter of 2007, the share of total food expenditures spent on basic ingredients remained fairly constant but increased during the 2007-09 recession. The share of total food expenditures spent on ready-to-eat meals and snacks, on the other hand, steadily declined to 17.1 percent before rising back to 1999 levels during and following the 2007-09 recession. This chart appears in the ERS report, U.S. Households’ Demand for Convenience Foods, July 29, 2016.
Wednesday, July 27, 2016
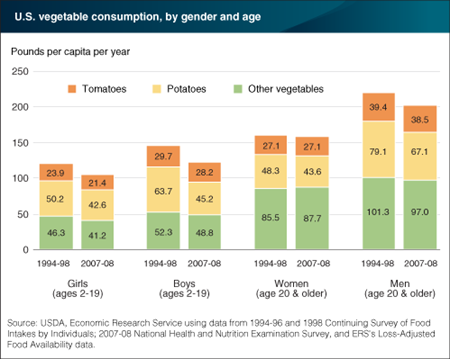
Americans’ consumption of vegetables has not increased, despite advice to the contrary from the health and nutrition community. A recent linking of ERS’s loss-adjusted food availability data with intake surveys reveals that total vegetable consumption fell across four U.S. age and gender groups between 1994-98 and 2007-08, though the decline for women was small. Much of the vegetable decline was driven by reduced consumption of potatoes. Boys had the largest drop; their potato consumption fell from 63.7 pounds (fresh-weight equivalent) per person per year in 1994-98 to 45.2 pounds in 2007-08. Intake of tomatoes—the second most consumed vegetable—held fairly steady for all age groups. When consumption of potatoes and tomatoes is subtracted from the mix, consumption of other vegetables by girls, boys, and men fell, too, but not as sharply as that of potatoes. For women, annual consumption of nonpotato and nontomato vegetables increased by 2.2 pounds per person. This chart appears in “A Closer Look at Declining Fruit and Vegetable Consumption Using Linked Data Sources” in the July 2016 issue of ERS’s Amber Waves magazine.
Monday, July 18, 2016
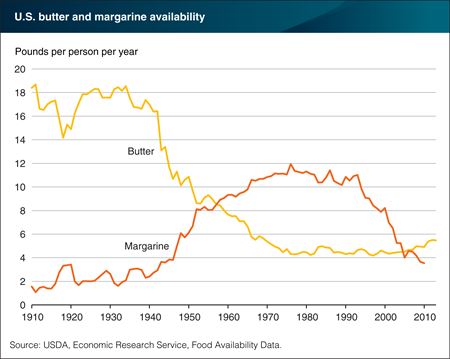
For the first half of the 20th century, supplies of butter available for U.S. consumers to eat (a proxy for consumption) averaged 16 pounds per person per year, compared with 2.8 pounds of margarine. Shortages and rationing of butter during World War II led consumers and food processors to substitute margarine for butter. After the war, many earlier public policies and restrictions on margarine (including restrictions on coloring margarine yellow) were relaxed, and some consumers had become more accustomed to the taste of margarine. Expanding soybean oil supplies contributed to margarine’s lower price relative to butter. Between 1942 and 1972, butter availability fell from 16.4 to 5.0 pounds per person per year, while annual per person availability of margarine increased from 2.9 to 11.1 pounds. In the second half of the 1970s, margarine availability began trending downward, more steeply starting in 1994. By 2005, margarine availability had fallen below butter availability, despite butter’s higher price. In 2013, per capita availability of butter was 5.5 pounds. Butter may owe part of its recent increase in popularity to concerns about trans fats in margarine and suggestions that saturated fat is not as unhealthy as once thought. This chart appears in “Butter and Margarine Availability Over the Last Century” in the July 2016 issue of ERS’s Amber Waves magazine.
Tuesday, July 5, 2016
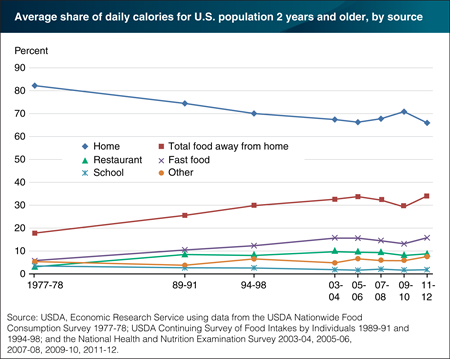
Over the past three decades, food prepared away from home—whether eaten at restaurants, picked up or delivered to eat at home, or served in school cafeterias—has become a regular part of more and more Americans’ diets. Between 1977-78 and 2005-06, the share of calories obtained away from home for the average American age 2 and older rose from 18 to 34 percent. Increased consumption of fast-food fare drove this trend. The share of calories obtained from fast food increased from 6 percent in 1977-78 to 16 percent in 2005-06. In 2007-08, the share of calories obtained away from home dropped to 32 percent and then fell again in 2009-10 to 29 percent. This period roughly corresponds to the 2007-09 recession in America—the most severe recession since the 1930s. The drop in calories eaten away from home shows that Americans economized during this time by eating out less, not just shifting to lower cost options. By 2011-12, food away from home’s share of total calories grew to 34 percent, and the fast-food share rebounded to 16 percent. This chart appears in “Linking Federal Food Intake Surveys Provides a More Accurate Look at Eating Out Trends” in the June 2016 issue of ERS’s Amber Waves magazine.
Thursday, June 23, 2016
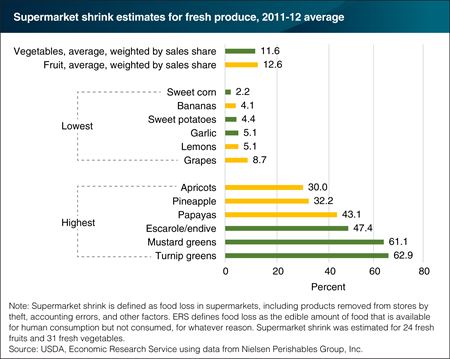
Food loss, or shrink as retailers call it, occurs when grocery retailers remove dented cans, misshaped produce items, overstocked holiday foods, and spoiled foods from their shelves. Estimates of supermarket shrink for fresh produce were developed by comparing data on pounds of shipments received with pounds purchased by consumers for 2,900 U.S. supermarkets in 2011-12. Average supermarket shrink was 12.6 percent for 24 fresh fruits and 11.6 percent for 31 fresh vegetables. For the fresh fruits, loss ranged from 4.1 percent for bananas to 43.1 percent for papayas. Pineapples and apricots had the second- and third-highest shrink rates for fresh fruits. The highest shrink in 2011-12 among the fresh vegetables was for turnip greens, followed by mustard greens, and escarole/endive. Leafy greens are more prone to moisture loss, and hence weight loss, than other types of produce. Uncertain or uneven demand for highly perishable produce items may also contribute to higher loss rates. The statistics in this chart are from the ERS report, Updated Supermarket Shrink Estimates for Fresh Foods and Their Implications for ERS Loss-Adjusted Food Availability Data, released on June 21, 2016.


