ERS Charts of Note
Subscribe to get highlights from our current and past research, Monday through Friday, or see our privacy policy.
Get the latest charts via email, or on our mobile app for  and
and 
China has become a significant export market for U.S. DDGS, a co-product of the corn ethanol process
Wednesday, August 22, 2012
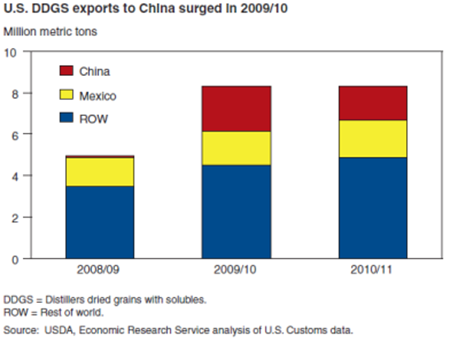
The expansion of corn-based ethanol production in the United States yields a large volume of residual co-products called distillers dried grain with solubles (DDGS). Approximately 75 percent of DDGS are utilized in the domestic U.S. market, but Chinese importers seeking raw materials for animal feed have emerged as a significant export market. High feed prices and favorable tax treatment within China stimulated a surge of imports of U.S. DDGS during 2009-11. China's potential demand for U.S. DDGS depends on various factors that include the price of corn, Chinese policy, and the availability and price of other substitute feed ingredients, such as the byproducts of grain processing in China (residual products from alcohol production). Demand is robust, but slower growth in the U.S. supply of DDGS and uncertainties about Chinese policy may constrain growth in exports to China. This chart is found in China's Market for Distillers Dried Grains and the Key Influences on Its Longer Run Potential, FDS-12g-01, August 2012.
Friday, August 3, 2012
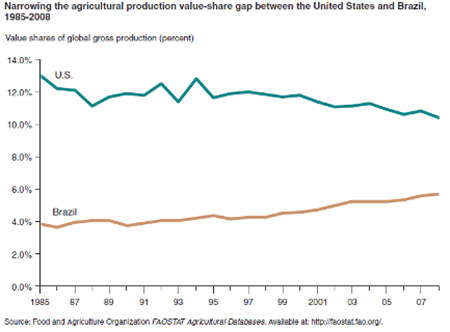
With the world's largest arable land area of 76 million hectares, fifth largest population base, and a strong record of agricultural production and exports, Brazil is viewed by many as the latest model of global agriculture. Over the last quarter-century, Brazil's agricultural production has grown significantly. Using production and trade data from the Food and Agriculture Organization of the United Nations, ERS found that the total value of the country's agricultural production between 1985 and 2008 grew 3.79 percent each year, driving up its share of total global production from 3.9 percent in 1985 to 5.7 percent in 2008. This robust production growth has increased Brazil's agricultural exports, with the total value of its agricultural trade growing 7.7 percent annually between 1985 and 2008. This chart comes from Policy, Technology, and Efficiency of Brazilian Agriculture, ERR-137, July 2012.
Wednesday, July 25, 2012
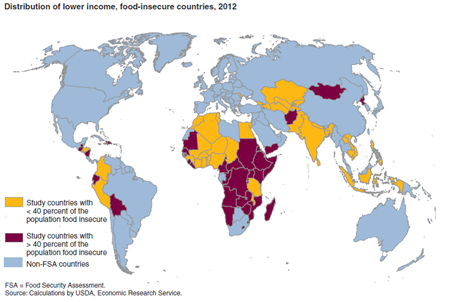
Nearly 400 million people in the 39 Sub-Saharan African countries analyzed by ERS are estimated to suffer from food insecurity in 2012. This equals 42 percent of the population of these countries. By contrast, 30 percent of the population in the 11 Latin American and Caribbean countries examined are food insecure. An estimated 18 percent of the population in the 22 Asian countries studied are food insecure. People are defined as food insecure when their estimated food availability falls below 2,100 calories per day. This map is found in the ERS report, International Food Security Assessment, 2012-22, GFA-23, July 2012.
Friday, July 20, 2012
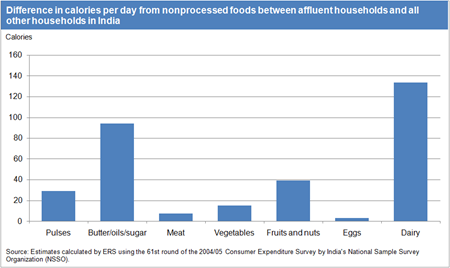
Policymakers and researchers are increasingly concerned with assessing the worldwide food-insecure population and the ways it may be changing. A common denominator in different approaches to assessing food insecurity is the measurement of calories consumed. A recent ERS analysis focuses on India, the country with the largest food-insecure population in the world. Despite India's rapid income growth over the past two decades, current estimates of the number of food-insecure people derived from aggregate production, trade, and income distribution data suggest that the country accounts for nearly 40 percent of the world's food-insecure population. For nonprocessed foods, India's affluent households (with income in the top 10th percentile) purchase an average of 315 more calories than all other households and also purchase significantly more expensive calories. Regardless of income level, the majority of nonprocessed calories purchased are derived from grain products and the amount of calories from grains is nearly identical. However, more affluent households purchased significantly more calories in every other food category. The data for this chart come from Estimating the Range of Food-Insecure Households in India, ERR-133, May 2012.
Friday, June 8, 2012
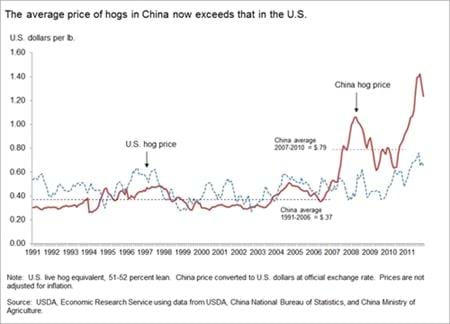
Rising prices in China's domestic market have been the main contributor to the country's rising pork imports. From 1991 to 2006, Chinese hog prices fluctuated within a relatively narrow range and were usually less than U.S. prices, but have been significantly higher than U.S. hog prices since their sharp increase during 2007-08. One of the main reasons for higher pork prices in China is the industry's rising production costs. ERS analysis of cost of production data from China's National Development and Reform Commission show that average hog production costs, converted to U.S. dollars, more than doubled from 2002 to 2009. Feed is the largest of the production expenses, accounting for about 60 percent of the total. The shift in prices is an indication of the general improvement of prospects for U.S. pork sales to China. This chart appeared in China's Volatile Pork Industry, LDP-M-211-01, February 2012.
Tuesday, May 1, 2012
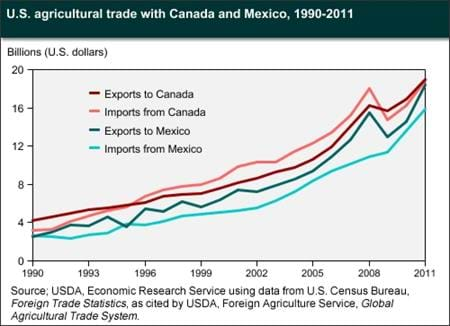
Agricultural trade within the NAFTA region has recovered from the recent global economic downturn, reaching record levels in 2011. The total value (exports and imports) of U.S. agricultural trade with Canada and Mexico reached about $72.1 billion in 2011, compared with $60.7 billion in 2008 and $54.7 billion in 2009. Prior to the downturn, regional agricultural trade had enjoyed a long period of sustained growth with few interruptions. Even when accounting for the effects of the recent downturn, U.S. agricultural trade with Canada and Mexico has nearly quadrupled since NAFTA's implementation in 1994. This chart is an update of one found in the ERS report, NAFTA at 17, WRS-11-01, March 2011.
Thursday, April 5, 2012
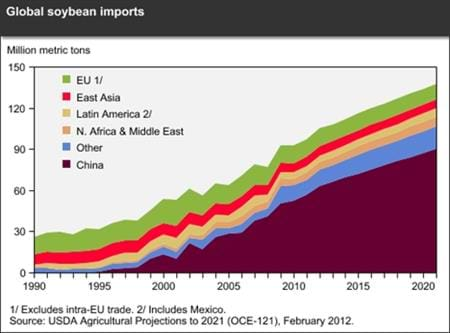
China has a strong presence in trade for many commodities. China's soybean imports have risen sharply over the past 10-15 years, and now account for more than half of world trade. Over the next decade, China's soybean imports are projected to rise 59 percent to 90 million tons. This increase accounts for more than 80 percent of the projected growth in global soybean imports. China's large oilseed crushing capacity underlies these strong gains in soybean imports. The United States, Brazil and Argentina are the leading exporters of soybeans. In fiscal year 2011, 59 percent of U.S. soybean exports went to China. This chart is found in the ERS report, USDA Agricultural Projections to 2021, OCE-121, February 2012.
Monday, March 26, 2012
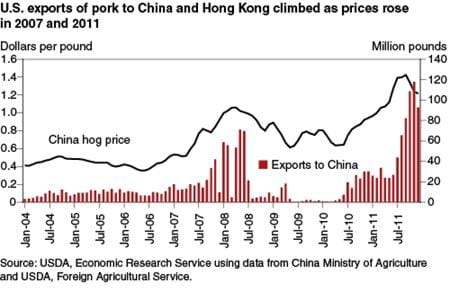
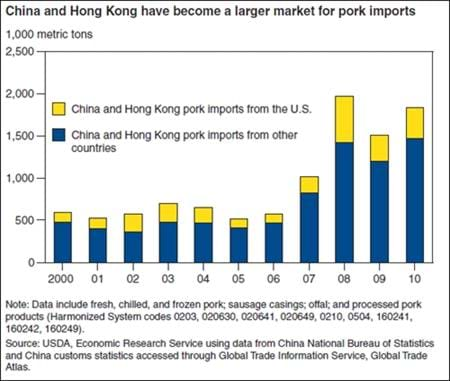
U.S. pork sales to China tend to rise and fall in rhythm with cyclical changes in China's hog sector. Chinese retail pork prices rose more than 50 percent in 2007 over prices in the previous year, leading to increased U.S. exports of pork to China through the first half of 2008. Depressed hog prices and swine disease in 2010 led to a decline in China's hog inventory that set the stage for another surge in hog prices in 2011. In turn, U.S. pork exports to China rebounded strongly during the second half of 2011 after a 2009 ban on U.S. pork imports was lifted. This chart is found in the March 2012 issues of Amber Waves magazine.
Thursday, February 16, 2012
China's potential to affect the world pork market derives from the size and volatility of its domestic pork market. China accounts for nearly half of the world's pork production and consumption. Its annual pork output is four to five times that of the United States and more than double that of the European Union. According to official Chinese statistics, China slaughters over 600 million hogs annually-one hog for every 2.2 domestic consumers. China and Hong Kong pork imports surged in 2007 when a shortfall in Chinese pork production led to record Chinese pork prices. That year, Hong Kong-China pork imports nearly doubled to just over 1 million metric tons (mmt), then rose to over 1.9 mmt in 2008. This chart comes from the ERS report, China's Volatile Pork Industry, LDPM-21101, February 2012.
Thursday, June 30, 2011
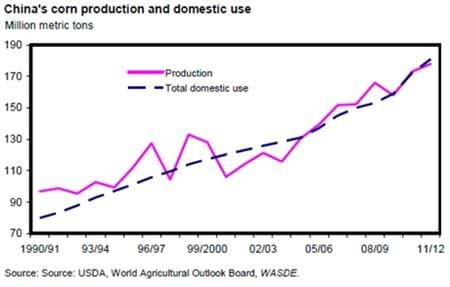
China's corn production for 2011/12, up 6.0 million tons to 178.0 million, is based on an increase in area reported by China's National Bureau of Statistics (NBS) for 2010/11. The 2010/11 production estimate increased 5.0 million tons to 173.0 million, adopting the NBS corn area, but remains below the NBS production estimate due to a careful analysis of yields based on weather, satellite imagery, and crop travel. This chart comes from Feed Outlook, FDS-11f, June 13, 2011.
Tuesday, June 28, 2011
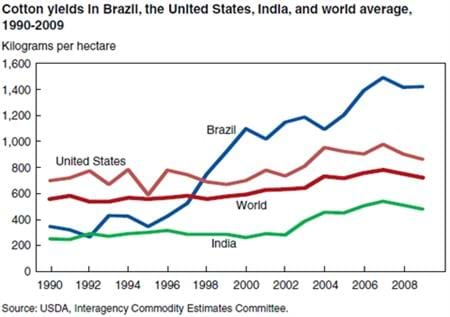
Brazil and India had similar yields in 1992, both below the United States and the world average. With the adoption of modern, large-scale farming and improved access to inputs-and due to the extremely favorable climate in Brazil's new production regions-Brazil's cotton yields have surged to more than double the world average. This chart is from the ERS report, Brazil's Cotton Industry: Economic Reform and Development, CWS-11D-01, June 2011.
Thursday, June 16, 2011
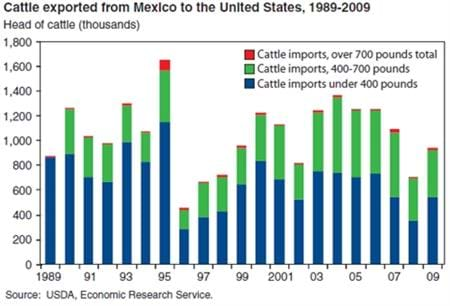
Cattle production provides vital economic activity for the large expanse of nonarable land in Mexico, and the United States is the primary export market. Cattle raised for export in Mexico represent, on average, more than half of all U.S. cattle imports. In 12 of the years between 1989 and 2009, Mexico exported over a million head of cattle, mostly steers and heifers for feeding, to the United States. In 1995, large numbers of cattle were exported from Mexico due to drought conditions. Over half of Mexican cattle imports to the United States are lightweight feeder cattle (less than 400 pounds). Exports of Mexican cattle to the United States have declined in recent years due to a decreased cattle inventory in that country. This chart originally appeared in Cow-Calf Beef Production in Mexico, LDP-M-196-01, November 2010.
Thursday, May 5, 2011
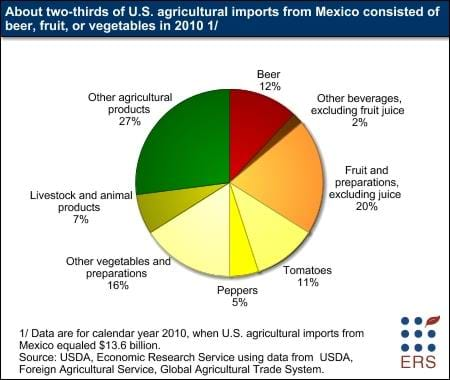
About two-thirds of U.S. agricultural imports from Mexico consists of beer, vegetables, and fruit. These imports are closely tied to Mexico's historical expertise in producing alcoholic beverages and a wide range of fruits and vegetables, along with a favorable climate whose growing season largely complements that of the United States. This chart is from the NAFTA briefing room, May 2011.
Wednesday, April 27, 2011
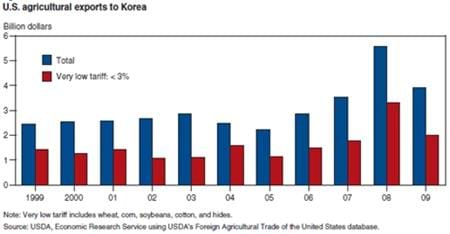
U.S. agricultural exports to Korea can be divided into two groups: inputs for Korean industries, and products that compete with the outputs of Korean industries. Some of the "input" goods include wheat, corn, soybeans, cotton, and hides used in processing that are imported with little or no tariff. This is because (1) they do not displace domestic Korean production, and (2) the industries that use them need low-cost inputs to compete in the Korean and global marketplaces. The products from which the United States could gain the most from a U.S.-Korea Trade Agreement include those: (1) where tariffs are currently high, (2) that are competitive with Korean producers, and (3) where Korean demand responds strongly to lower prices. This chart is from the ERS report, Selected Trade Agreements and Implications for U.S. Agriculture, ERR-115, April 2011.
Tuesday, April 26, 2011
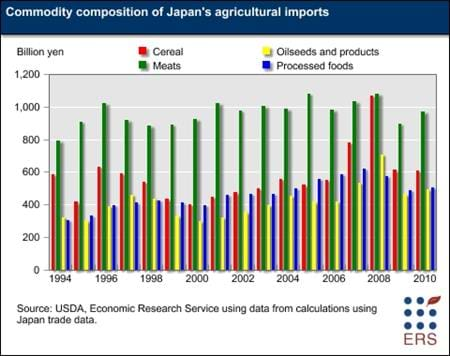
Meats are the largest component of Japan's agricultural imports-about 20 percent in recent years. Based on the value of imports, Japan is the largest meat-importing country in the world, purchasing large quantities of pork, beef, and poultry meat. Japan is also the world's largest corn importer, and a major importer of wheat. High global prices caused the value of cereal imports to spike in 2007 and 2008, almost equaling meat imports in 2008. Japan's oilseed-related imports remain important, but their composition is changing, as soymeal and palm oil imports rise and soybean imports for crushing decline. Processed food imports (here grain-based, fruit- and vegetable-based, and highly processed foods) have declined in recent years as the value of the yen has risen, allowing Japan to buy the same amount of food for fewer yen. This chart appeared in the ERS briefing room on Japan, March 2011.
Monday, April 18, 2011
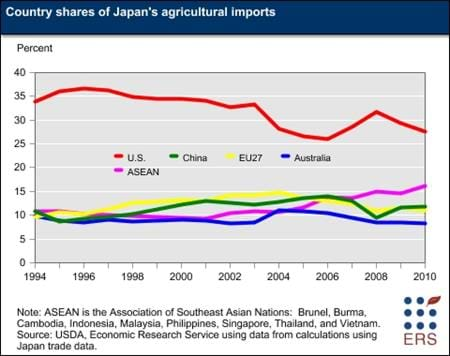
Japan's agricultural imports (about $50 billion in 2010) make it the world's third-largest importer, after the United States and the European Union (EU). Based on total calories consumed, Japan imports about 60 percent of its food each year, and it is also a major importer of other agricultural products, such as rubber. Imports from the United States (almost $14 billion, including shipping costs, in 2010) represent over one-fourth of Japan's total agricultural imports. Major imports from the United States include pork, corn, wheat, soybeans, and beef. Japan's imports from the United States dipped in 2004 and 2005 as BSE concerns temporarily stopped the billion-dollar trade in beef. Higher grain prices, and a resumption of beef imports boosted the U.S. share in 2007 and 2008, but the beef trade has yet to regain its earlier levels. Among the major import sources, only Southeast Asia (ASEAN) has seen consistent growth in share of Japan's market in the last 5 years. Rising rubber and palm oil prices have increased ASEAN's share of Japan's market since 2001. This chart appeared in the ERS briefing room on Japan, March 2011.
Friday, April 15, 2011
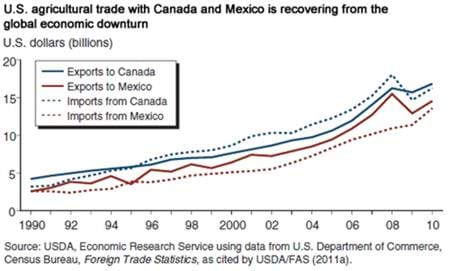
Agricultural trade within the NAFTA region is recovering from the recent global economic downturn. The total value (exports and imports) of U.S. agricultural trade with Canada and Mexico reached about $61.3 billion in 2010, compared with $60.7 billion in 2008 and $54.7 billion in 2009. Prior to the downturn, regional agricultural trade had enjoyed a long period of sustained growth with few interruptions. Even when accounting for the effects of the recent downturn, U.S. agricultural trade with Canada and Mexico has more than tripled since NAFTA's implementation in 1994. This chart is from the ERS report, NAFTA at 17: Full Implementation Leads To Increased Trade and Integration, WRS-11-01, March 2011.
Tuesday, March 8, 2011
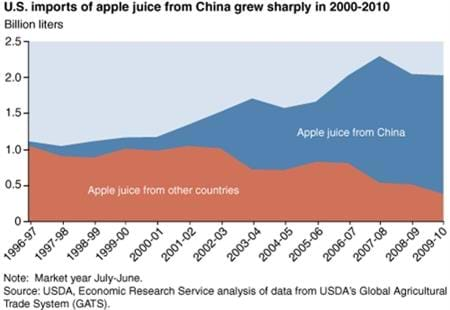
China is by far the world's largest supplier of apple juice concentrate, a key ingredient in consumer juice products and other beverages in the United States and other countries. About two-thirds of the U.S. apple juice supply now comes from China. China's prominent role in apple juice trade is remarkable, considering that its juice industry barely existed until the early 1990s. The industry emerged after market reforms in the 1980s encouraged Chinese farmers to diversify their incomes by planting apples and other horticultural crops. As production boomed, China's apple market was quickly saturated, and prices were depressed until a combination of Government, foreign, and private investment began building a juice processing industry that absorbed the glut of apples. The industry relies on exports for over 90 percent of its sales since apple juice is not traditionally part of the Chinese diet. The United States is the largest market. This chart originally appeared in the March 2011 issue of Amber Waves and is based on the ERS report, Investment in Processing Industry Turns Chinese Apples Into Juice Exports, FTS-344-01, October 2010.


