ERS Charts of Note
Subscribe to get highlights from our current and past research, Monday through Friday, or see our privacy policy.
Get the latest charts via email, or on our mobile app for  and
and 
Tuesday, September 8, 2015
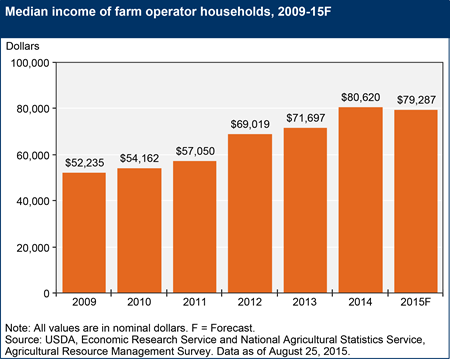
The median total income of farm households has increased steadily over the past 5 years (in both nominal and inflation-adjusted terms), peaking at an estimated $80,620 in 2014. However, it is forecast to decrease slightly in 2015, to $79,287. Households with commercial farms—operations which earn at least $350,000 in gross cash farm income—derive roughly three-fourths of their income from farming. Conversely, off-farm income contributes substantially to the total income of many farm households, especially those with smaller farms or a primary occupation other than farming. Farm households, on average, derive roughly 60 percent of their off-farm income from wages, salaries, and operating other businesses, while the remaining portion comes mostly from interest, dividends, and private and public transfer payments. Farm household median income remains higher than the median income of U.S. households, which was $51,939 in 2013 (the latest figure available). This chart is based on the Farm Household Well-Being Topic Page.
Tuesday, August 25, 2015
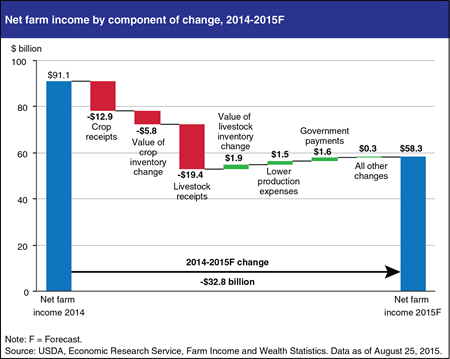
Net farm income (NFI) is forecast to decline for the second consecutive year, after reaching recent historic highs in 2013. NFI is expected to fall nearly $33 billion (36 percent) from 2014’s estimate to $58.3 billion in 2015. The 2015 forecast would be the lowest since 2010, and $29.1 billion (in real terms) below the 10-year average. Crop receipts are expected to decrease by $12.9 billion from 2014, led by a projected $7.1 billion decline in corn receipts and a $3.4 billion decline in soybean receipts. Livestock receipts are also expected to decline, with the largest decreases expected for hog and dairy receipts. Total production expenses are forecast to fall by $1.5 billion in 2015, the first decline since 2009. Government payments are projected to rise 16 percent ($1.6 billion) to $11.4 billion in 2015. This chart is based on information found in the 2015 Farm Sector Income Forecast, updated August 25, 2015.
Tuesday, July 14, 2015
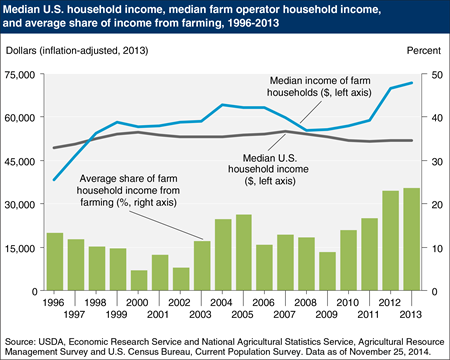
Since USDA’s Agricultural Resource Management Survey began collecting data in 1996, the median income of farm households has risen while real U.S. median household income has remained essentially flat. This may be due to a variety of factors, including farm consolidation, increasing commodity prices, and minimal increases in hourly wages for all U.S. workers. In 2013, the median household income of farm households was about $72,000, compared with $52,000 for all U.S. households. Farm households benefitted from high commodity prices in 2012 and 2013; however, many farm households experience considerable variability in their income from year-to-year compared with their non-farm counterparts. The share of farm household income from farming (shown in the green bars) varies, accounting for as little as 5 percent in the early 2000s and reaching a high of 24 percent in 2013. The importance of farm income to households also varies with the size of the operation. Households with smaller and intermediate size farms typically receive the majority of their income from off-farm sources, while large (commercial) farm households derive the bulk of total household income from their farm activities. The most recent ERS farm sector income forecast shows farm sector income for 2014 and 2015 returning to pre-2012 levels. Households operating large farms are the most vulnerable to decreases in farm income. This chart is based on data found in Farm Household Income and Characteristics and information found in the Farm Household Well-being topic page.
Friday, July 10, 2015
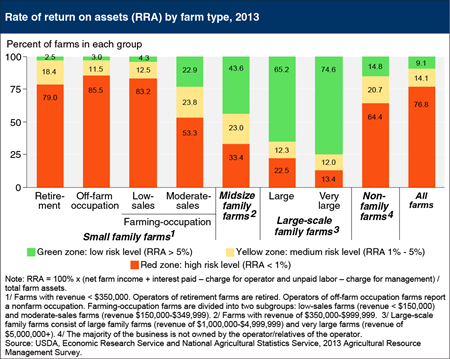
Profitability—measured here by the rate of return on assets (RRA)—is strongly associated with farm size. Seventy-nine to 86 percent of retirement, off-farm occupation, and low-sales farms are in the "red zone" (farms with an RRA of less than 1 percent), indicating a very low return to farming. The share of farms in the red zone drops rapidly for the remaining family farm types, those with moderate sales and higher. Likewise, the share of farms in the green zone—with a RRA greater than 5 percent—increases with farm size. Larger farms can often use their resources more productively than smaller farms, generating more dollars of sales per unit of capital. Given the high share of small farms in the red zone, many operators stay in business by undervaluing their labor, effectively ignoring the value of the unpaid labor they provide. Such small-farm households typically receive substantial off-farm income and do not rely primarily on their farms for their livelihood, often using off-farm income to cover farm expenses and make investments in their farm operations. This chart is found on the ERS topic page, Farm Structure and Organization, updated July 2015.
Thursday, June 11, 2015
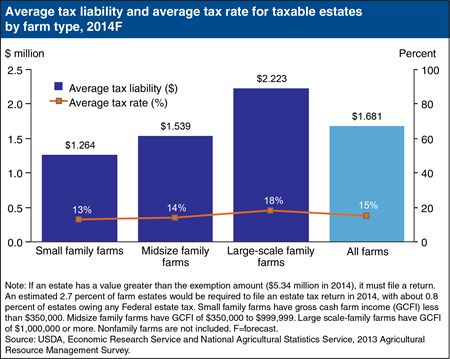
Since 1916, the Federal estate tax has been applied to the transfer of property at death. Under present law, the estate of a decedent, who at death owned assets in excess of the estate tax exemption amount ($5.43 million in 2015), must file a Federal estate tax return; those estates are subject to a 40 percent tax rate on the nonexempt amount. Based on simulations using farm-level survey data from the 2013 Agricultural Resource Management Survey (ARMS), for the 2014 tax year an estimated 2.7 percent of farm estates would be required to file an estate tax return, with a much smaller share of estates (about 0.8 percent) owing any Federal estate tax. On average, a farm estate that owed Federal estate tax had net worth of $11.1 million and a tax liability of $1.68 million, paying an average tax rate of 15 percent. Estates of small family farms (those with gross cash farm income (GCFI) below $350,000) faced the lowest average effective tax rate, while estates of large-scale family farms (those with GCFI of $1 million or more) were taxed at an average effective rate of 18 percent. This chart is found on the ERS topic page on Federal Estate Taxes, updated May 2015.
Wednesday, April 15, 2015
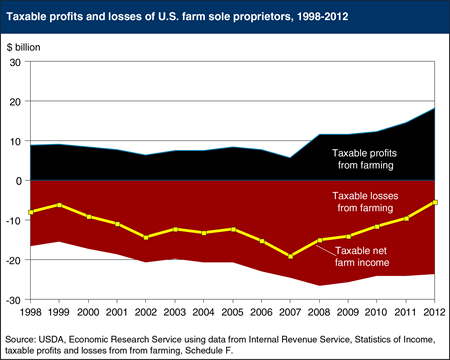
U.S. farm households generally receive income from both farm and off-farm activities, and for many, off-farm income largely determines the household’s income tax liability. Since 1980, farm sole proprietors, in aggregate, have reported negative net farm income for tax purposes. Over the 1998-2008 period, both the share of farm sole proprietors reporting losses and the amount of losses reported generally increased, due in part to deduction allowances for capital expenses. Since 2007, strong commodity prices have bolstered farm sector profits and the net losses from farming have declined. In 2012, the latest year for which complete data are available, U.S. Internal Revenue Service data showed that nearly 70 percent of farm sole proprietors reported a farm loss, totaling almost $24 billion. The remaining farms reported profits totaling $18.2 billion. This chart updates the chart found in the February 2013 Amber Waves feature, “Federal Income Tax Reform and the Potential Effects on Farm Households.”
Friday, March 13, 2015
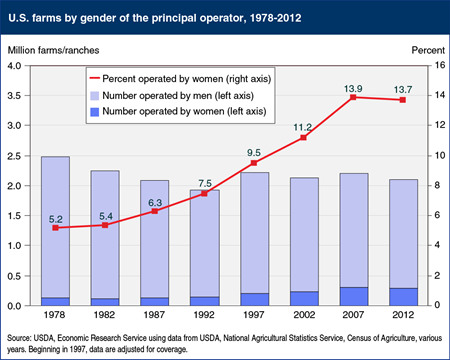
The share of U.S. farms operated by women nearly tripled over the past three decades, from 5 percent in 1978 to about 14 percent byThe share of U.S. farms operated by women nearly tripled over the past three decades, from 5 percent in 1978 to about 14 percent by 2012. Although there have always been women farm operators, national-level statistics to track their numbers and examine their characteristics were not available until the Census of Agriculture began asking for principal farm operators’ gender in 1978. 2012 marked the first census, however, in which the number (and share) of women-operated farms did not increase. The number of women-operated farms declined 6 percent between 2007 and 2012, similar to the 4-percent decline for men-operated farms. For both genders, most of the decline (about 75 percent) occurred in the smallest size category of farms (those with annual sales less than $1,000). Between the 1992 and 2007 censuses, the number of farms in this category increased substantially—in part because of increased efforts to find all small farms, including those operated by women. Fewer of these very small farms are overlooked now, resulting in more stable farm numbers. This chart updates one found in the ERS report, Characteristics of Women Farm Operators and Their Farms, EIB-111, April 2013. 2012. Although there have always been women farm operators, national-level statistics to track their numbers and examine their characteristics were not available until the Census of Agriculture began asking for principal farm operators? gender in 1978. 2012 marked the first census, however, in which the number (and share) of women-operated farms did not increase. The number of women-operated farms declined 6 percent between 2007 and 2012, similar to the 4-percent decline for men-operated farms. For both genders, most of the decline (about 75 percent) occurred in the smallest size category of farms (those with annual sales less than $1,000). Between the 1992 and 2007 censuses, the number of farms in this category increased substantially?in part because of increased efforts to find all small farms, including those operated by women. Fewer of these very small farms are overlooked now, resulting in more stable farm numbers. This chart updates one found in the ERS report, Characteristics of Women Farm Operators and Their Farms, EIB-111, April 2013.
Monday, March 2, 2015
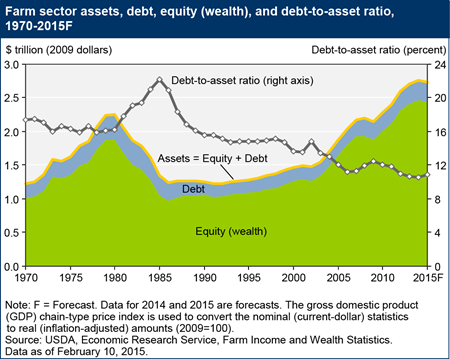
The rate of growth in U.S. farm sector assets and equity (assets minus debt) is forecast to moderate in 2015 compared with recent years, and to decline for the first time since 2009 after adjusting for inflation. Lower projected farm asset growth is primarily driven by decreases in financial assets and a small drop in farm real estate value. These declines reflect lower forecast net cash income for 2014-15, along with expectations of slightly higher interest rates. Farm sector debt is expected to increase in both nominal and inflation-adjusted terms in 2015. Debt is led higher by an increase in nonreal estate borrowing because lower cash income is expected to reduce cash available to cover operating expenses. As a result, the debt-to-asset ratio is expected to increase from 10.6 to 10.9 in 2015, marking the first increase since 2009. Dig deeper into the U.S. farm balance sheet with the data visualization released on February 10, 2015.
Tuesday, February 10, 2015
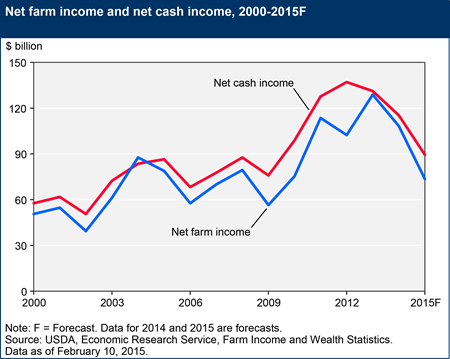
U.S. net farm income—a measure of the sector’s profitability—is forecast to be $73.6 billion in 2015, down nearly 32 percent from 2014’s forecast of $108 billion. The 2015 forecast would be the lowest since 2009 and a drop of nearly 43 percent from the record high of $129 billion in 2013. Lower crop receipts (-$15.6 billion) and livestock receipts (-$10.1 billion) are the main drivers of the change, as production expenses are projected up less than 1 percent ($2.5 billion) and government payments are forecast to increase about 15 percent ($1.6 billion) in 2015. Net cash income is forecast at $89.4 billion, down about 22 percent from the 2014 forecast. Net cash income is projected to decline less than net farm income primarily because it reflects the sale of carryover stocks from 2014. This chart is found in 2015 Farm Sector Income Forecast, released February 10, 2015.
Friday, January 16, 2015
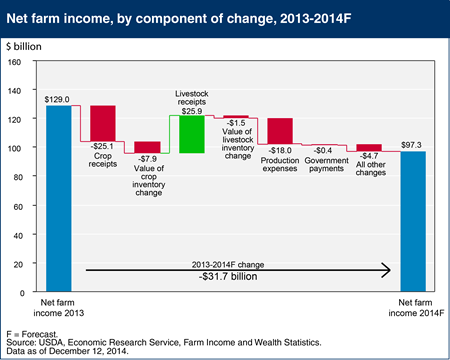
Net farm income is forecast to be $97.3 billion in 2014, down nearly $32 billion (25 percent) from 2013’s estimate. The 2014 forecast would be the lowest since 2010, but still $12.3 billion above the previous 10-year average. Crop receipts are expected to decrease by $25.1 billion, led by a projected $10.9-billion decline in corn receipts and a $9.5-billion decline in oil crop receipts, largely due to weak prices. Livestock value of production is expected to have strong gains, with increases across almost all livestock categories and the largest gains expected in cattle/calves and milk. Total production expenses are forecast to increase $18 billion in 2014, extending the upward movement in expenses for a fifth straight year. The elimination of direct payments under the Agricultural Act of 2014 resulted in a projected 4-percent decline in government payments due to offsetting supplemental and ad hoc disaster assistance payments related to drought. For additional analysis, see the 2014 Farm Sector Income Forecast, updated December 12, 2014.
Tuesday, January 13, 2015
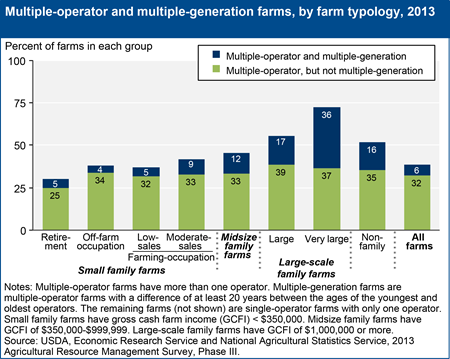
Larger farms often require more management and labor than an individual can provide. Additional operators can provide the necessary labor, management, and possibly other resources such as capital or farmland. Having a secondary operator may also provide a successor when an older principal operator phases out of farming. Multiple-operator farms are prevalent among large and very large family farms. In 2013, 38 percent of all U.S. farms were multiple-operator farms, while 73 percent of very large family farms had more than one operator. Since farms are generally family businesses, 68 percent of all secondary operators were spouses. About 16 percent of all multiple-operator farms (and 6 percent of all farms) were multiple-generation farms in 2013, with at least 20 years' difference between the ages of the oldest and youngest operators. The presence or absence of younger related operators may affect farm expansion and contraction decisions, depending on the principal operator's lifecycle position. This chart updates one found in the ERS report brochure, America’s Diverse Family Farms, EIB-133, December 2014.
Wednesday, January 7, 2015
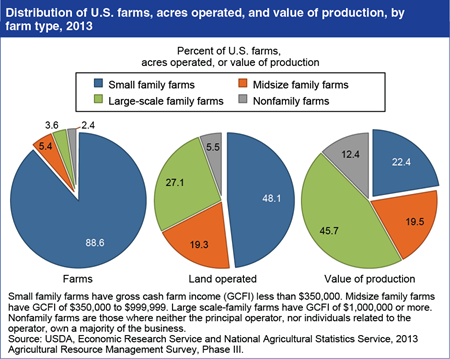
In 2013, 98 percent of U.S. farms were family farms, where the principal operator and his or her relatives owned the majority of the business. Two features of family farms stand out. First, there are many small family farms—those reporting less than $350,000 in gross cash farm income (GCFI)— and they account for 89 percent of all U.S. farms and operate 48 percent of U.S. farmland. Second, while most production—65 percent—occurs on the 9 percent of farms classified as midsize/large-scale family farms, small farms’ 22-percent share of production is larger than that of midsize farms alone (20 percent) or nonfamily farms (12 percent). This chart updates one found in Structure and Finances of U.S. Farms: Family Farm Report, 2014 Edition, EIB-132, December 2014.
Friday, December 19, 2014
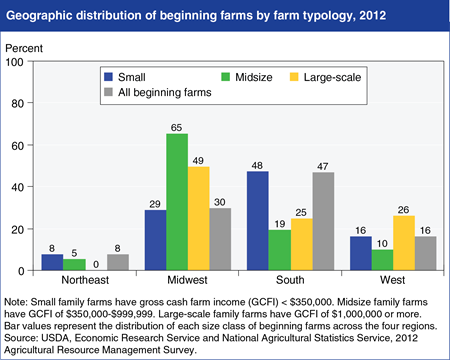
In large part, the regional distribution of beginning farms mirrors that of all farms, but there are some differences. Beginning farms are located all across the country, but overall, the South is home to the largest percentage of beginning farms: 47 percent, which is about 5 percent higher than its share of all farms. The South also has the largest percentage of small beginning farms. Large-scale beginning farms are most likely to be in the Midwest, but with 30 percent of the nation’s beginning farms, the Midwest has fewer than its 37 percent share of all farms. The concentration of cash grain farms in the Midwest, which on average are larger than farms specializing in other types of commodities, not only explains the region’s higher shares of mid-size and large scale beginning farms, but may also explain the fact that fewer of its farms are operated by beginning farmers. This chart is found in the ERS topic page on Beginning & Disadvantaged Farmers, updated October 2014.
Wednesday, December 17, 2014
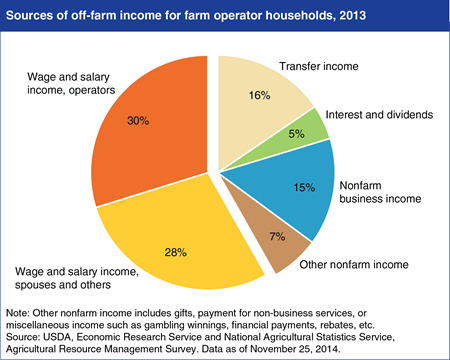
In 2013, only about one-quarter of total farm household income came from farming. Because of the broad USDA definition of a farm (which includes places with the potential for as little as $1,000 in annual sales), more than half of farm operator households consistently incur a net loss from farming activities in any given year, and far more do not earn the equivalent of a market wage for their on-farm labor. As a result, most farm operator households rely heavily on off-farm income. Of the total off-farm income earned by all farm operator households, the majority comes from wages and salaries earned by household members through nonfarm jobs, followed by income transfers (e.g., Social Security) and profits from nonfarm businesses owned by farm household members. As a group, U.S. farm operator households earn their income from a wide range of activities, reflecting the diverse set of skills, knowledge, and economic goals held by farm operators and their families. This chart is found in the ERS topic page, Farm Household Well-Being, updated November 2014.
Tuesday, November 25, 2014
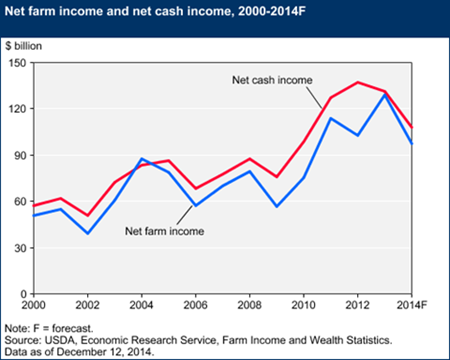
U.S. net farm income—a measure of the sector’s profitability—is forecast to be $96.9 billion in 2014, down over 20 percent from 2013’s estimate. The 2014 forecast would be the seventh highest value since 1970 after adjusting for inflation. Higher production expenses are the main driver of the 2013-14 change in net farm income, as changes in crop and livestock receipts are offsetting. Crop receipts are expected to decrease by 12.3 percent in 2014, led by declines in corn and soybean receipts, while livestock receipts are forecast to increase by 14 percent, largely due to anticipated record prices for beef cattle and milk. Total production expenses are forecast to increase 5.7 percent in 2014 extending a 4-year upward trend in expenses. Net cash income is forecast at $108.2 billion, down over 19 percent from its 2013 estimate, and is projected to decline less than net farm income primarily because it includes the sale of carryover stocks from 2013. This chart is found in 2014 Farm Sector Income Forecast, updated November 25, 2014.
Monday, October 6, 2014
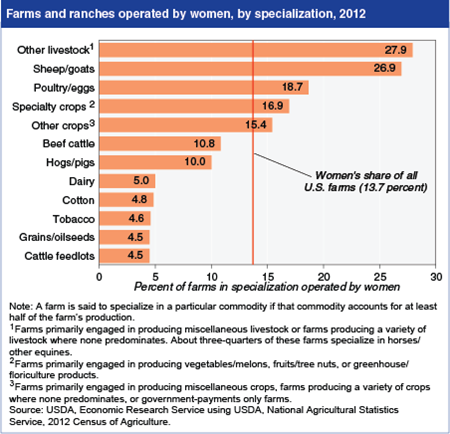
According to the 2012 Census of Agriculture, women are the principal operators of nearly 14 percent of U.S. farms, but their share varies widely by farm specialization. Women operate a disproportionately large portion of sheep/goat farms and “other livestock farms,” three-quarters of which are horse farms. Farms in these two categories tend to be small; 46 percent of sheep/goat farms and 57 percent of other livestock farms have sales less than $1,000, compared with only 20 percent of all U.S. farms. Establishments of this size qualify as farms under USDA’s definition because they have sufficient acres of crops or head of livestock to indicate they could normally have $1,000 or more in sales. For example, five horses or ponies would qualify an establishment as a farm even if the operator has no plans to sell the animals. On the other hand, 1 percent of farms with a woman principal operator (2,486 farms) have sales of $1 million or more. This chart is an update of one found in the ERS report, Characteristics of Women Farm Operators and Their Farms, EIB-111, April 2013.
Monday, September 15, 2014
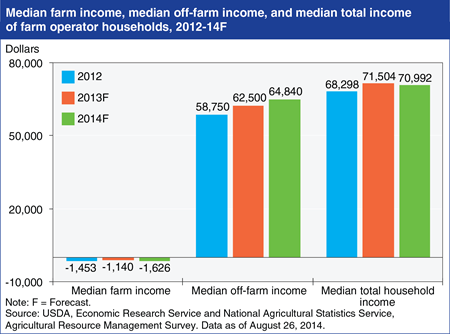
Median total farm household income is forecast to decline slightly in 2014 to $70,992, down from $71,504 forecast for 2013. Given the broad USDA definition of a farm and the large number of relatively small farms, most farm households earn all of their income from off-farm sources. In 2014, median off-farm income is projected to increase by 3.7 percent to $64,840. On the other hand, many farms are not profitable businesses even in the best farm income years; as a result, median income from farming is negative when calculated for all farm households. Sector-wide farm income is expected to dip in 2014, and median farm household income from farming is expected to decline to -$1,626. (Note: Because they are based on unique distributions, median total income will generally not equal the sum of median off-farm and median farm income.) This chart is found in the ERS topics page, Farm Household Well-being, updated August 26, 2014.
Tuesday, August 26, 2014
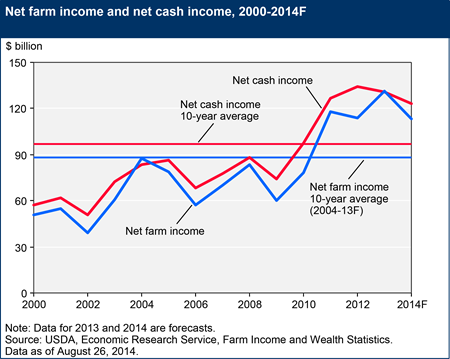
Net farm income is forecast at $113.2 billion in 2014, down about 14 percent from the 2013 forecast of $131.3 billion. If realized, the 2014 forecast would be the fourth-highest value since 1970 after adjusting for inflation. Lower cash receipts for crops, and to a lesser degree, higher production expenses and reduced government farm payments, drive the expected drop in net farm income. Net cash income is forecast at $123 billion, down almost 6 percent from the 2013 forecast. Net cash income is projected to decline less than net farm income primarily because it reflects the sale of more than $10 billion in carryover stocks from 2013. Despite expected record-setting harvests, crop receipts are expected to decrease more than 7 percent in 2014 due to lower prices. Livestock receipts are forecast to increase by more than 15 percent in 2014, largely due to higher prices. This chart is found in the topic page on the 2014 Farm Sector Income Forecast on the ERS website, updated August 26, 2014.
Thursday, August 14, 2014
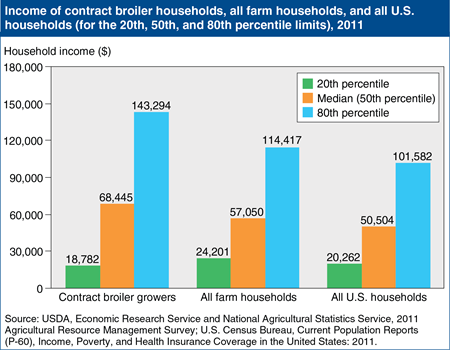
For farmers, household income combines the income that the household receives from off-farm activities with the income that the household receives from the farm business, net of expenses and payments to other stakeholders in the business. Households that raise broilers have higher median incomes than other farm households, and other U.S. households. In 2011, the median income among all U.S. households was $50,504, while the median income among farm households was $57,050. The median for contract broiler growers was higher, at $68,455. However, median income doesn’t tell the whole story; the range of household incomes earned by broiler growers is also wider than other groups, even though contract growers are a much more demographically homogeneous than both the U.S. population and the overall farm population. The wider range reflects, in part, the financial risks associated with contract broiler production. Grower costs can vary widely, and flat annual broiler production in recent years has increased the risk that growers will get fewer chicks placed, or that their contracts won’t be renewed. This chart is found in the August 2014 Amber Waves feature, “Financial Risks and Incomes in Contract Broiler Production.”
Tuesday, June 17, 2014
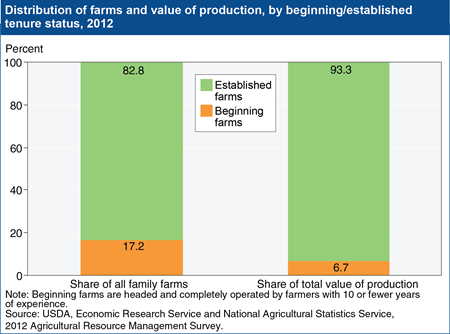
With the number of new entrants declining, encouraging and supporting new farmers is a continuing policy goal. According to Census of Agriculture data, 38 percent of principal operators had less than 10 years of farming experience in 1982; by 2007, only 26 percent had such experience. In 2012, beginning farms—farms headed and completely operated by farmers with 10 or fewer years of experience—made up 17.2 percent of family farms and collectively accounted for only about 6-7 percent of the land in farms and the value of farm production. Beginning farm operators tend to hold fewer farm assets and have a median farm net worth that is roughly half the median farm net worth of established farmers. Not all beginning farmers are young; on average, the principal operator of a beginning farm is 49 years old. The unique demographic and production profiles of beginning farmers suggest the strategies for supporting them may need to be different than those aimed at established farmers. This chart is found in “Beginning Farmers and Ranchers and the Agricultural Act of 2014” in the June 2014 Amber Waves online magazine.


