
Median income of farm households exceeds that of U.S. households
- by Daniel Prager
- 7/14/2015
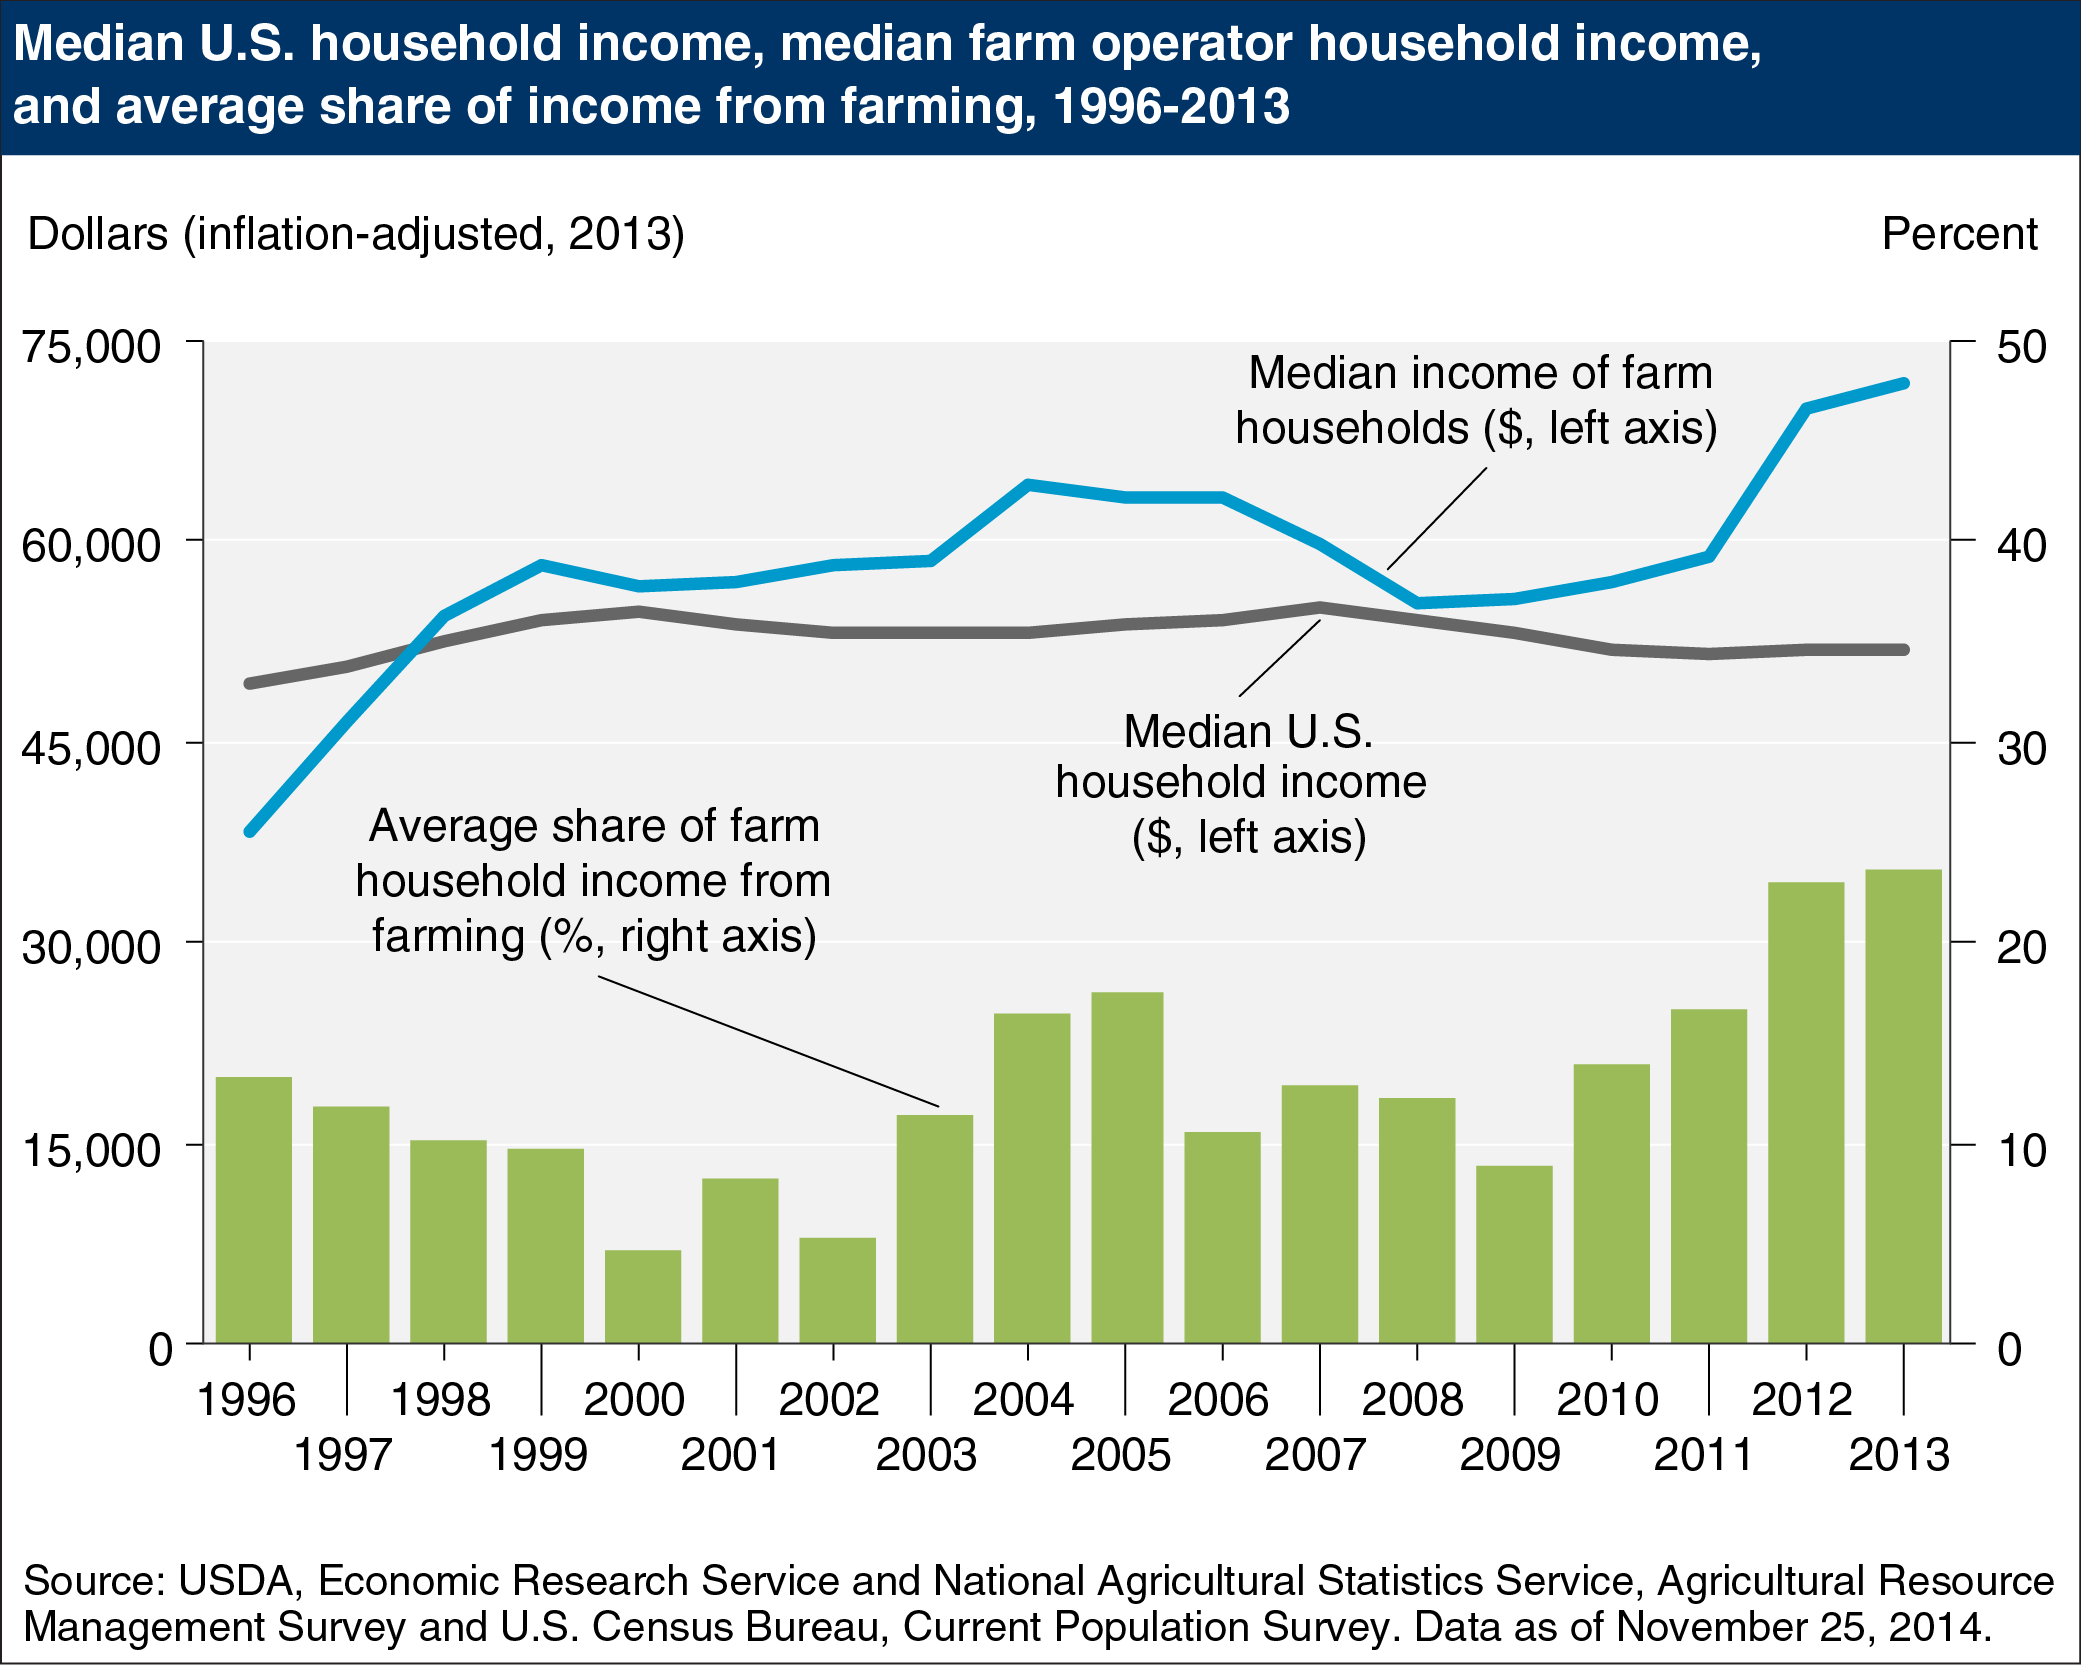
Since USDA’s Agricultural Resource Management Survey began collecting data in 1996, the median income of farm households has risen while real U.S. median household income has remained essentially flat. This may be due to a variety of factors, including farm consolidation, increasing commodity prices, and minimal increases in hourly wages for all U.S. workers. In 2013, the median household income of farm households was about $72,000, compared with $52,000 for all U.S. households. Farm households benefitted from high commodity prices in 2012 and 2013; however, many farm households experience considerable variability in their income from year-to-year compared with their non-farm counterparts. The share of farm household income from farming (shown in the green bars) varies, accounting for as little as 5 percent in the early 2000s and reaching a high of 24 percent in 2013. The importance of farm income to households also varies with the size of the operation. Households with smaller and intermediate size farms typically receive the majority of their income from off-farm sources, while large (commercial) farm households derive the bulk of total household income from their farm activities. The most recent ERS farm sector income forecast shows farm sector income for 2014 and 2015 returning to pre-2012 levels. Households operating large farms are the most vulnerable to decreases in farm income. This chart is based on data found in Farm Household Income and Characteristics and information found in the Farm Household Well-being topic page.