ERS Charts of Note
Subscribe to get highlights from our current and past research, Monday through Friday, or see our privacy policy.
Get the latest charts via email, or on our mobile app for  and
and 
Wednesday, July 9, 2014
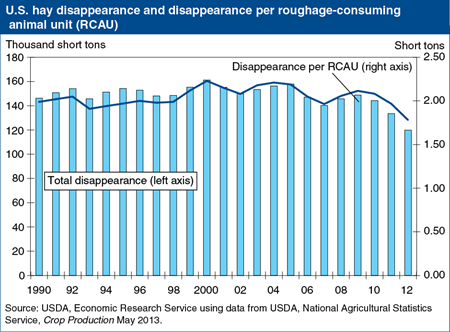
U.S. hay disappearance (production adjusted for net trade and changes in stocks) declined in 2012/13 (May/April), with both total disappearance and disappearance per roughage-consuming animal unit (RCAU) falling to the lowest levels on recent record. Disappearance per RCAU relates hay disappearance to the size and composition of the livestock herd (dairy cows, dairy heifers, cattle on feed, sheep, goats, horses, etc.) and the feed rations of different types of livestock. A decline in hay disappearance per RCAU indicates declining use of hay relative to standard feed rations. December-May disappearance for the 2012/13 crop year was the lowest since the 1978/79 crop year. The May 10 USDA-NASS Crop Production report placed U.S. onfarm hay stocks on May 1, 2013 at 14.16 million tons, the lowest on record. Tight supplies and high prices are behind declining disappearance; the average all-hay price for April of $203 per ton was the highest on record. However, high hay prices during 2012/13 have not raised farmers’ intentions to harvest significantly more acres in 2013/14 as concerns about water availability and competition from other crops contribute to reduced harvested area, particularly in New England and Midwestern States. This chart can be found in the Feed Grains Chart Gallery.
Friday, June 27, 2014
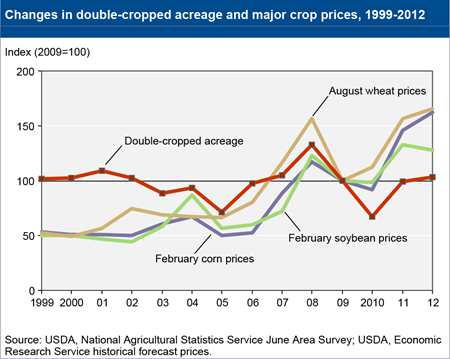
Double-cropped acreage has varied from year to year. Because decisions about double cropping are made annually, fluctuations are likely as farmers respond to changing market and weather conditions. For example, higher commodity prices give farmers more incentive to intensify production and could offset revenue shortfalls from lower potential yields when double cropping. From 2004 to 2012, total double-cropped acreage roughly paralleled soybean, winter wheat, and corn prices. When commodity prices at the time of planting decisions were increasing or relatively high, total double-cropped acreage also increased. Total double-cropped acreage peaked at 10.9 million acres in 2008, when prices for soybeans, winter wheat, and corn also peaked. In 2005 and 2010, nearly every region witnessed declines in double-cropped acreage amid commodity price declines. This chart is found in the ERS report, Multi-Cropping Practices: Recent Trends in Double-Cropping, EIB-125, May 2014.
Wednesday, June 25, 2014
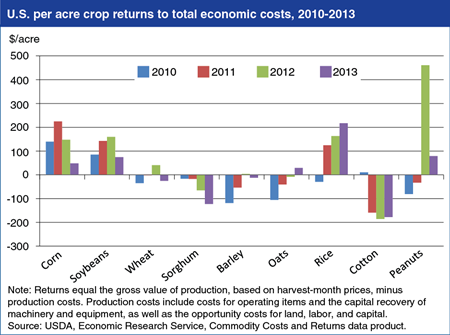
Estimates of U.S. crop returns per acre reveal large differences in crop profitability across commodities and over time during 2010-13. Returns to crop production are defined as the gross value of production less total economic costs. Total economic costs include operating costs such as seeds, fertilizer, and pesticides; the capital recovery cost for machinery and equipment; and the costs—known as opportunity costs—of employing land, labor, capital and other owned resources that have alternative uses. While returns to total economic costs for corn, soybeans, rice, and peanuts were positive, on average, for the 2010-13 period, average returns for other major crops were negative. For most crops, changes in farm prices and the gross value of production per acre, rather than changes in production costs, have driven returns to total economic costs. Lower prices contributed to reduced returns for corn, soybeans, wheat, sorghum, and peanuts in 2013, while price and yield increases improved returns for oats and rice. The negative returns over total economic costs for some crops indicate that that those producers realized a lower rate of return to their land, labor, and capital than the benchmark rates of return used in ERS commodity cost and returns accounts; returns over operating costs alone were positive for all crops throughout the period. This chart is based on data found in Commodity Costs and Returns.
Monday, June 23, 2014
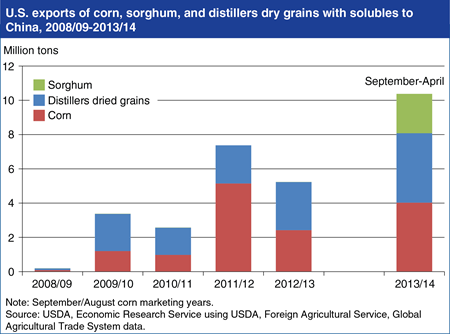
With record shipments so far in 2013/14 (September/August marketing year), China has emerged as a major buyer of U.S. feed grains, but this trade is now being disrupted by China’s rejection of U.S. shipments containing unapproved genetically modified (GM) material. U.S. corn exports to China have reached 4.0 million tons so far in 2013/14 and China has also, for the first time, initiated large-scale imports of U.S. sorghum, with imports of 2.3 million tons in the first 7 months of 2013/14. China has become the largest U.S. export market for distillers dry grains with solubles (DDGS, a byproduct from production of corn-based ethanol) with sales to China of 2.8 million tons in 2012/13 and 4.0 million tons so far in 2013/14. Feed sales to China are being driven by the continued expansion of meat and feed consumption, high Chinese corn prices, and demand by animal product producers for cost-efficient feed ingredients. Until recently, China’s trade policies have helped channel demand toward DDGS and sorghum, which face relatively low tariffs and—unlike corn—are not subject to import quotas. But, so far in 2013/14, China has rejected about 1.1 million tons of U.S. corn and DDGS containing unapproved GM material, specifically the MIR 162 strain, and other shipments have been cancelled or diverted to other destinations. More recently, China has halted issuance of licenses for imports of any U.S. DDGS. These developments place prospects for U.S feed grain exports to China in 2013/14 and beyond in question. For further analysis, see China’s Market for Distillers Dried Grains and the Key Influences on Its Longer Run Potential.
Thursday, June 12, 2014
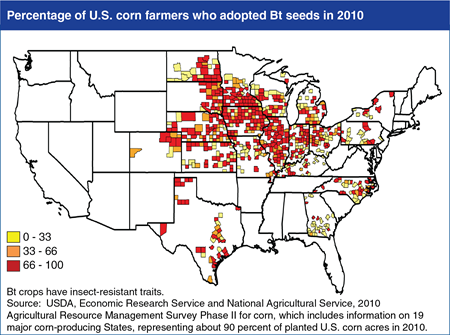
Genetically engineered (GE) crops are being developed with various traits; the most widely-adopted GE crops to date are designed to help farmers control insect and weed pests. To control insect damage, Bt corn is genetically engineered to carry the gene from the soil bacterium Bacillus thuringiensis, which produces a protein that is toxic when ingested by certain insects. Bt corn with traits to control the European corn borer was introduced commercially in 1996, with additional traits to control other types of insects introduced beginning in 2003. Farmers planting Bt crops benefit from decreased dependence on weather conditions affecting the timing and effectiveness of traditional insecticide applications because the Bt toxin remains active in the plant throughout the crop year. By improving pest control, Bt corn produces higher yields when pest infestation is a problem. More than 60 percent of U.S. corn farmers planted Bt corn in 2010 in response to the threat of highly localized insect infestations. This chart is found in the ERS report, Genetically Engineered Crops in the United States, ERR-162, February 2014.
Thursday, May 22, 2014
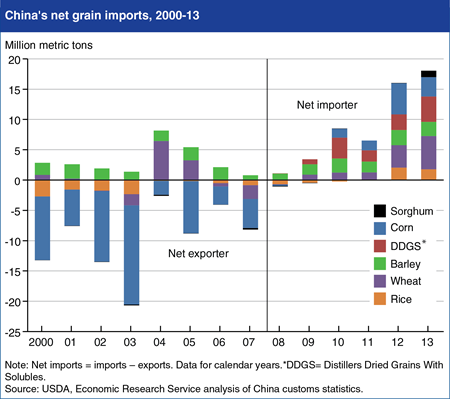
China’s demand for imported grains, much of it from the United States, has surged recently, with imports of cereal grains rising to 16 million tons in 2012 and 18 million in 2013. Imports in 2013 included 3 million tons of corn and 4 million tons of DDGS (distillers dried grains with solubles; a co-product of U.S. corn ethanol production used for feed) from the United States. In 2013, the United States supplied 70 percent of China’s wheat imports and, for the first time, China became a major market for U.S. sorghum. China’s demand for feed grains appears to have reached a turning point, as a tightening labor supply and rising feed costs force structural change in China’s livestock sector. Labor scarcity, animal disease pressures, and rising living standards are prompting rural households to abandon “backyard” livestock production and shift more production to specialized farm enterprises that rely more heavily on commercial feed. Because of this, China has switched from being a corn exporter to importing 3-5 million tons annually since 2009. Rising feed demand has also pushed up costs and motivated feed mills and livestock producers to explore new feed ingredients like DDGS and sorghum. Find this chart and additional analysis in "China in the Next Decade: Rising Meat Demand and Growing Imports of Feed" in the April Amber Waves.
Tuesday, May 6, 2014
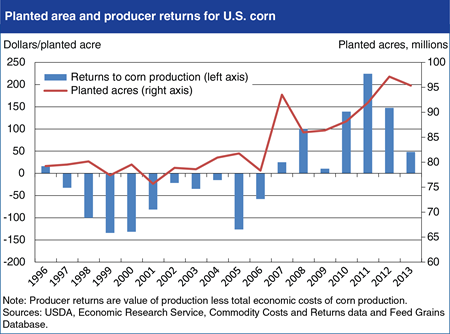
Positive grower returns have supported the expansion of U.S. corn area since the late 2000s. Returns to corn production—the value above total economic costs that include opportunity costs of land, labor, and other owned resources—have been positive since 2007. Returns reached a high of $224 per planted acre in 2011 before declining to $48 in 2013. With economic profit available from corn production, planted corn acres increased nearly 25 percent nationally from about 78 million in 2006 to a record of more than 97 million in 2012. In 2013, however, lower corn price expectations pushed down planted area, and lower corn prices, along with higher land costs, reduced returns to corn production. From 1997 to 2006, economic returns to corn production had been negative, averaging -$74 per planted acre. During this time, planted corn acreage was relatively stable between about 75 and 80 million acres. This chart is based on data found in Commodity Costs and Returns and the Feed Grains Database.
Tuesday, April 29, 2014
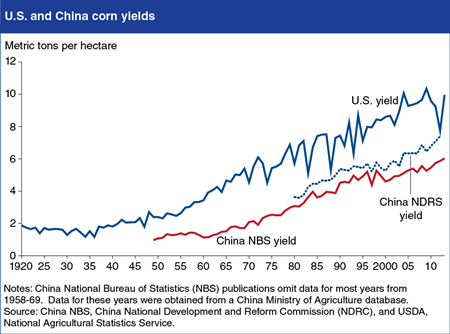
Data sources indicate that China’s corn yields continue to lag behind yields achieved in the United States (the world’s leading producer) with implications for China’s ability to meet future corn demand through domestic production. Both China’s official yield estimates provided by the National Bureau of Statistics (NBS) and alternative survey-based estimates provided by China’s National Development and Reform Commission (NDRC) show China’s average corn yields to be both lower and growing more slowly than U.S. average yields. A key factor constraining yield growth in China is slow progress in breeding appropriate varieties to build on past gains achieved from the adoption of hybrid corn. While fertilizer use is already high by world standards, improvements in pest protection and drought resistance—potentially through the adoption of genetically modified varieties—may offer yield gains. Current USDA corn supply and demand projections for China indicate that demand is likely to outpace production, leading to expanding corn imports. Find this chart and additional analysis in Prospects for China’s Corn Yields and Imports.
Wednesday, April 2, 2014
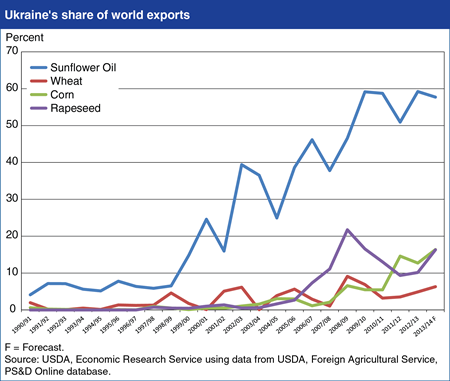
Over the last 15 years, Ukraine has emerged as a major supplier to world markets for several agricultural commodities, including wheat, corn, sunflower oil, and rapeseed. Wheat is a traditional export, with annual shipments varying with crop size. For 2013/14 (July/June marketing year), Ukraine’s wheat exports are forecast at 10 million tons, or about 6 percent of world wheat trade. During the last decade, Ukraine’s corn production and exports have expanded, with 2013/14 (October/September) exports forecast at 18.5 million tons, making Ukraine the world’s third-largest corn exporter. Robust production growth is also behind Ukraine’s emergence as the world’s dominant supplier of sunflowerseed oil, with 2013/14 (September/August) exports forecast at nearly 4.1 million tons, or about 57 percent of global trade. Ukraine has also become a significant exporter of rapeseed, with 2013/14 (July/June) exports forecast at about 2.2 million tons, or 16 percent of world trade. Despite recent political developments in Ukraine, so far there is no evidence of significant shipping disruptions that might alter the 2013/14 Ukraine export forecasts. Find additional analysis Wheat Outlook: March 2014, Feed Outlook: March 2014, and Oil Crops Outlook: March 2014.
Thursday, March 27, 2014
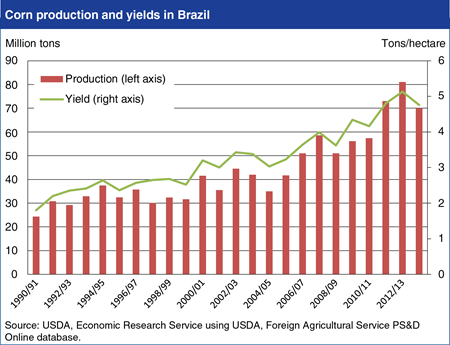
Rising yields have been the primary driver of growth in Brazil’s corn production since the mid-2000s. Production gains have allowed Brazil to meet rising domestic corn demand, as well as emerge as a major corn exporter. New high-yielding varieties, the introduction of GMO corn, improved cultural practices, and a shift to higher-yielding land has supported long-term yield growth. A large share of second-crop corn is planted following soybeans in the frontier agricultural State of Mato Grosso, where corn production quadrupled over the past decade. In 2011/12 and 2012/13 (March/February marketing year), above-average rains in Mato Grosso pushed corn yields and production to record levels. For 2013/14, lower corn prices caused reductions in corn area and, with the assumption of more normal weather, corn yields are forecast below the 2012/13 record. Brazil is the world’s third largest corn producer after the United States and China. Brazil became the world’s largest corn exporter in 2012/13 when the U.S. corn crop was damaged by drought, but is forecast to be the second largest exporter in in 2013/14. Find additional analysis of corn market developments in Feed Outlook: March 2014.
Monday, February 24, 2014
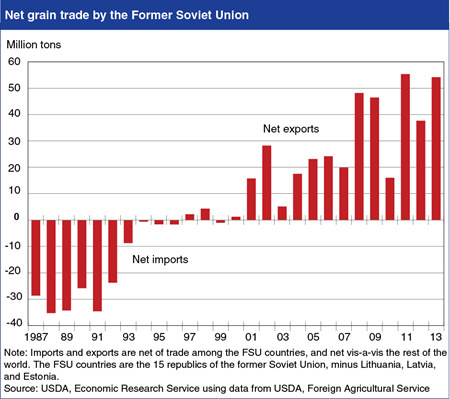
Since the breakup of the former Soviet Union (FSU) in the early 1990s, the region has transitioned from major grain importer to major grain exporter, with important implications for global markets. The region was a large importer of grains—primarily wheat and corn—during the last decade of the FSU, with net imports in some years exceeding 30 million tons. Grain imports largely ceased during the 1990s, but the region emerged as a grain exporter beginning in 2001. Although FSU grain production and exports can vary significantly due to weather conditions, net exports have exceeded 50 million tons in some recent years, representing a swing of roughly 80 million tons of grain available on the world market compared with the 1980s. The vast bulk of the FSU exports are wheat, barley, and corn from the three main agricultural countries of the region – Russia, Ukraine, and Kazakhstan. The trade turnaround has occurred for two main reasons, the first being the contraction of the region’s livestock sector by about half during the 1990s following withdrawal of subsidies under the Soviet system, reducing the need for large imports of animal feed. The second factor is significant gains in grain yields and production during the 2000s, which has created surpluses for export. For more information, see Rising Grain Exports by the Former Soviet Union Region.
Monday, January 27, 2014
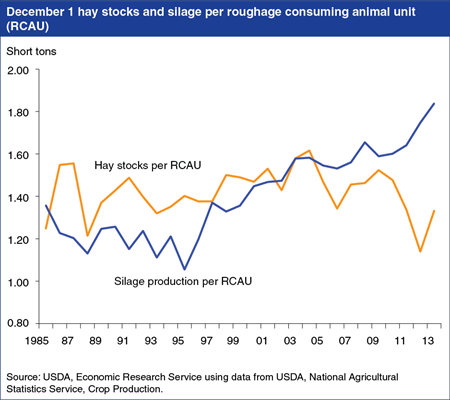
U.S. livestock producers were faced with reduced supplies of hay and silage (fermented, high-moisture stored animal feed which can be fed to cattle or sheep) following the 2012 drought, but recent USDA estimates indicate a rebound in supplies during 2013. Estimates of hay stocks and silage production per roughage consuming animal unit (RCAU) provide a means of comparing supplies to the size of the livestock herd while accounting for the varying roughage consumption of different animal types. All hay production for 2013 is estimated at 135.9 million tons, a 13-percent increase from the drought-affected total in 2012. As a result, hay stocks per RCAU rebounded in 2013, but remain below the recent 10-year average (2003-12) of 1.44 short tons per RCAU. U.S. corn and sorghum silage production is estimated at 123.3 million tons in 2013, up 4.8 percent from 2012 and the highest since 1982. With higher production, silage available per RCAU is 1.84 tons per unit, up from 1.75 tons per unit in 2012. Increased availability of roughage via hay and silage sources provided additional options to livestock producers facing tightening grain supplies during the summer and early fall of 2013. The December all hay price of $168 per ton is 11 percent lower than the comparable 2012 price of $189, but well above the 10-year average (2003-12) of $121 per ton. This chart can be found in the Feed Grain Chart Gallery, with accompanying analysis in Feed Outlook: January 2014.
Friday, January 24, 2014
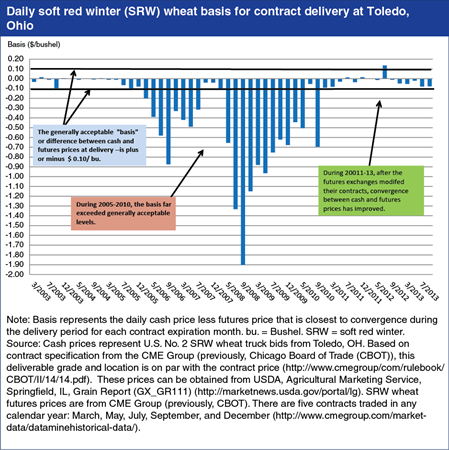
Futures markets play an important role in price discovery (determination of prices through the interaction of market supply and demand) for major agricultural commodities, and provide a tool for growers, traders, and processors to mitigate risk. For futures markets to perform these functions effectively, the price of a commodity held in a futures contract must match (or “converge”) with its price in the cash—or spot—market when the futures contract expires. During 2005-2011, cash and futures prices for soft red winter (SRW) wheat failed to converge to the generally acceptable “basis”—or difference between the cash price and futures price—of plus or minus $0.10/bushel. At times the basis exceeded $1.00/bushel. In response, the futures exchanges modified their SRW contracts to better align contract terms with changes occurring in cash markets for factors including storage rates, major delivery locations for SRW, and quality specifications. Following these changes, cash and futures market prices for SRW have moved closer together, improving the effectiveness of futures contracts in determining prices and as a tool to manage risk. This chart is based on Recent Convergence Performance of Futures and Cash Prices for Corn, Soybeans, and Wheat, FDS-13L-01, released December 30, 2013.
Tuesday, January 7, 2014
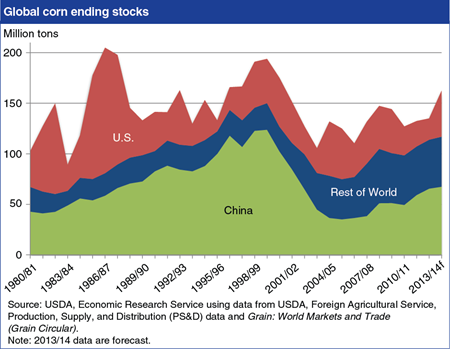
Despite higher December forecasts for U.S. corn use for feed and ethanol, USDA continues to forecast significantly higher U.S. and global corn stocks and lower prices for corn in 2013/14 (September/August marketing year). Total U.S. corn production is forecast at 355.3 million tons, up 30 percent from the drought-damaged 2012/13 crop, while total use is forecast to rise 12 percent from 2012/13. Key sources of demand growth for corn in 2013/14 are a 20 percent increase in feed and residual use, and a 6 percent increase in the use of corn for ethanol production. Lower corn prices combined with relatively high prices for ethanol and distillers dried grains (DDG) have boosted ethanol production. Even with increased use, U.S. ending stocks of corn are forecast at 45.5 million tons, more than twice the estimate of U.S. ending stocks for 2012/13 and accounting for nearly all the forecast rise in global stocks. The U.S. corn price received by farmers for 2013/14 is forecast at $4.05 to $4.75 per bushel, with the midpoint forecast of $4.40/bushel down sharply from the record season-average price of $6.89 per bushel in 2012/13. This chart can be found in the Feed Grain Chart Gallery, with accompanying analysis in Feed Outlook: December 2013.
Thursday, August 15, 2013
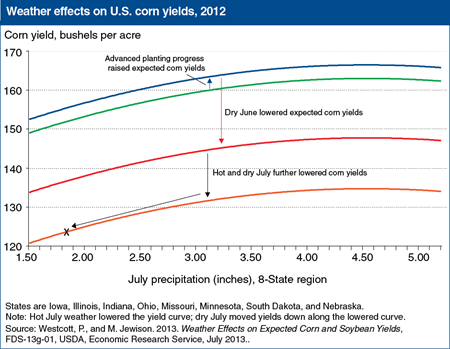
The most severe and extensive drought in at least 25 years combined with high temperatures to seriously affect U.S. agriculture in 2012. Corn yields were the lowest since 1995, and the chart illustrates the impacts of drought and hot weather on 2012 corn yields. The 2012 season actually got off to a good start, with good weather initially permitting early planting of the corn crop, a typically beneficial factor that increased initial yield expectations for the crop. But then poor weather during the growing season hindered yields. An extremely dry June is estimated to have lowered 2012 corn yields by close to 19 bushels per acre. Hot and dry July weather further reduced yields an estimated 22-23 bushels per acre. This yield reduction breaks into two parts. First, the reduction due to high temperatures shifts the yield curve down 13 bushels per acre. Dry weather in July 2012 was the primary cause of the rest of the reduction in corn yields (to 123.4 bushels per acre), represented by the indicated movement downward along the lowered yield curve. This chart appears in Weather Effects on Expected Corn and Soybean Yields, FDS 13g 01, July 2013.
Monday, August 12, 2013
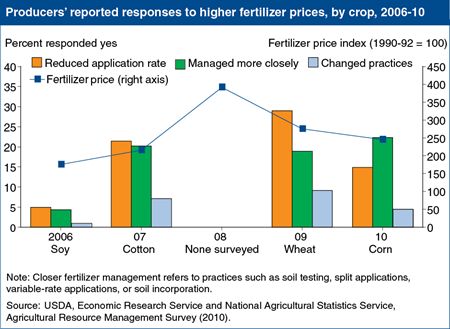
Fertilizer prices have increased overall since 2006, reaching historical highs in 2008. Fertilizers are an important input into farming and higher prices have forced farmers to alter their use. Beginning in 2006, USDA’s Agricultural Resource Management Survey (ARMS) asked farm operators how they adjusted their operations in response to higher fertilizer and fuel prices. For most crops (soy, cotton, and wheat) farmers responded to higher prices by reducing their application rate. However, the largest users of fertilizer—corn farmers—responded most often that they managed fertilizer use more closely, for example by using practices such as soil testing, split applications, variable-rate applications, or soil incorporation. This chart is found in the ERS report, Agriculture's Supply and Demand for Energy and Energy Products, EIB-112, May 2012.
Thursday, August 1, 2013
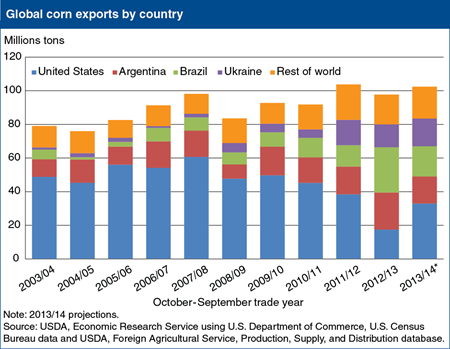
For most of the last century, U.S. corn accounted for between 50 and 75 percent of world corn exports, but over the last decade the United States has lost its dominance in world corn markets. The U.S. ethanol program provided underlying support for corn prices after 2005 and, together with rising global feed demand and policies in some foreign countries, encouraged expansion in foreign corn production, with Brazil and Ukraine notably successful. In 2012/13 (October/September), with several years of below trend U.S. yields compounded by severe drought, foreign corn has become increasingly competitive in world markets. U.S. corn export market share is forecast to fall to less than 20 percent in 2012/13. With record U.S. corn production projected for 2013/14, U.S. export share is expected to increase and the United States is expected to return as the largest exporter. But the U.S. market share is forecast to remain well below 50 percent, while Brazil, Ukraine, and Argentina are each forecast to account for 15 to 20 percent of world corn trade. This chart is adapted from the Feed Grains Chart Gallery.
Tuesday, July 30, 2013
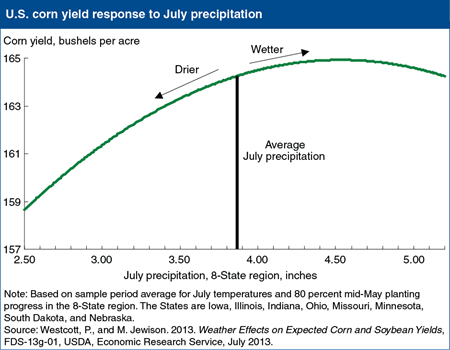
Weather during the growing season is critical for the development of the U.S. corn crop. In particular, weather in July tends to be the most important factor in the determination of corn yields. A corn yield model based on historical data covering the past 25 years provides estimates of the effects of weather and other factors. When other explanatory variables in the model are held constant, the model illustrates that the response of corn yields to variations in July precipitation is asymmetric—reductions in July precipitation below its average result in larger declines in corn yields than the gains in yields resulting from equal increases in July precipitation above its average. This chart is from Weather Effects on Expected Corn and Soybean Yields, FDS-13g-01.
Tuesday, June 11, 2013
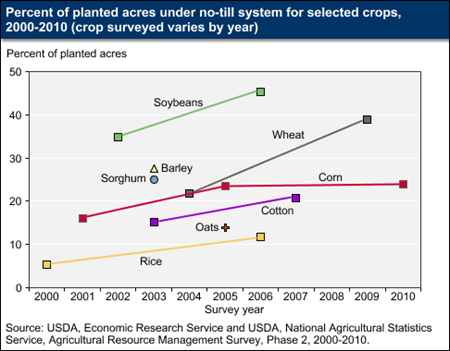
Farmers have choices for how they prepare the soil; reduce weed growth; incorporate fertilizer, manure and organic matter into the soil; and seed their crops, including the number of tillage operations and tillage depth. Tillage practices affect soil carbon, water pollution, and farmers’ energy and pesticide use. No-till is generally the least intensive form of tillage. Approximately 35 percent of U.S. cropland (88 million acres) planted to eight major crops had no-till operations in 2009, according to ERS researchers who estimated tillage trends based on 2000-07 data from USDA’s Agricultural Resource Management Survey (ARMS). Furthermore, the use of no-till increased over time for corn, cotton, soybeans, rice and wheat, the crops for which the ARMS data were sufficient to calculate a trend. While a more recent estimate of nationwide use of no-till by all major crop producers is not available, based on the results of recent surveys of wheat producers in 2009 and corn producers in 2010, it seems likely that no-till’s use continues to spread, albeit at a much reduced pace among corn producers. This chart is found on the ERS topic page, Soil Tillage and Crop Rotation, and in the ERS report, Agriculture’s Supply and Demand for Energy and Energy Products, EIB-112, May 2013.
Monday, June 3, 2013
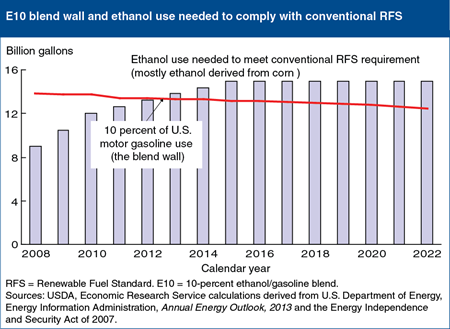
Declining use of gasoline in the United States, combined with market constraints to growth in the blending of biofuel, have resulted in U.S. ethanol use falling short of the Federal Renewable Fuel Standard (RFS), energy legislation that mandates minimum annual levels of biofuel consumption in the United States. Annual U.S. gasoline use has declined from its 142-billion-gallon peak in 2007 to about 133 billion gallons now, reducing the size of the existing U.S. market for ethanol. Nearly all retail gasoline sold in the United States is a 10-percent ethanol blend (E10). The limited ability to expand use of higher ethanol blends creates an effective constraint on total ethanol use at near 10 percent of total gasoline consumption—the E10 blend wall. As a result, ethanol use is falling short of the portion of the RFS mandate that can be met with corn-based ethanol. This gap is expected to widen in the future as gasoline consumption declines further and the RFS mandates higher levels of biofuel consumption. This chart appears in High RIN Prices Signal Constraints to U.S. Ethanol Expansion, Feed Outlook special article, April 2013.


