ERS Charts of Note
Subscribe to get highlights from our current and past research, Monday through Friday, or see our privacy policy.
Get the latest charts via email, or on our mobile app for  and
and 
Wednesday, April 3, 2019
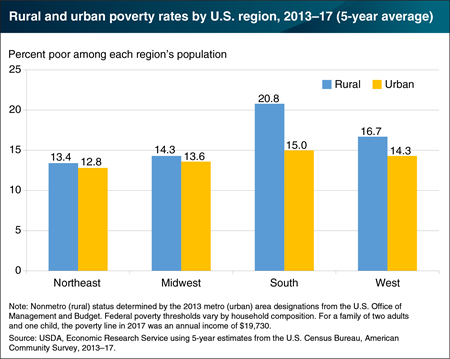
Poverty rates in rural (nonmetro) areas have historically been higher than in urban (metro) areas, and the rural/urban poverty gap is greater in some regions of the country than others. For example, the gap has historically been largest in the South. In 2013–17, the South had an average rural poverty rate of 20.8 percent—nearly 6 percentage points higher than the average rate in the region’s urban areas. The difference in the South’s poverty rates is particularly important because an estimated 42.6 percent of the Nation’s rural population and 51.1 percent of the Nation’s rural poor lived in this region between 2013 and 2017. By comparison, 36.9 percent of the urban population and 39.1 percent of the urban poor lived in the South during that period. The poverty gap was smallest in the Midwest and the Northeast—with less than a percentage point difference between rural and urban poverty rates. This chart appears on the ERS topic page “Rural Poverty & Well-being,” updated March 2019.
Friday, March 29, 2019
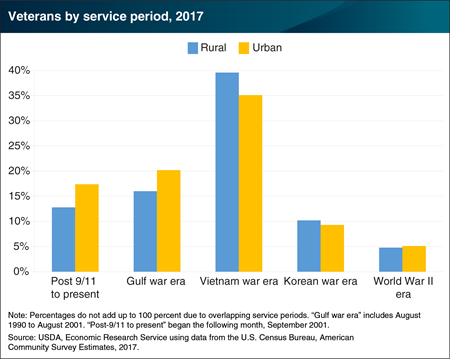
Between 1964 and 1973, an estimated 8.8 million persons were drafted or volunteered to serve in the U.S. armed forces during the period of the Vietnam war, according to U.S. Census Bureau reports. As of 2017, there were about 6.8 million Vietnam-era veterans in the United States, ranging in age from 55 to nearly 100 (average age, 68). About 1.3 million, or 19.2 percent, of them lived in rural America. In total, Vietnam-era veterans made up 39.6 percent of all rural veterans and 52.1 percent of rural veterans who served during wartime. By comparison, Vietnam-era veterans represented 35.1 percent of all urban veterans and 45.4 percent of urban veterans who served during wartime. Among rural Vietnam veterans, 4.2 percent of them also served in post-Vietnam conflicts. However, Vietnam-era veterans represent a very different sociodemographic group compared to other post-Vietnam veterans. Not only are they older on average, but they are also less diverse in gender and race. Vietnam veterans are also more likely to be disabled (although not necessarily service-related), have higher educational attainment rates, and lower poverty rates than post-Vietnam veterans. This chart uses data from the ERS data product Atlas of Rural and Small-Town America, updated February 2019.
Friday, March 8, 2019
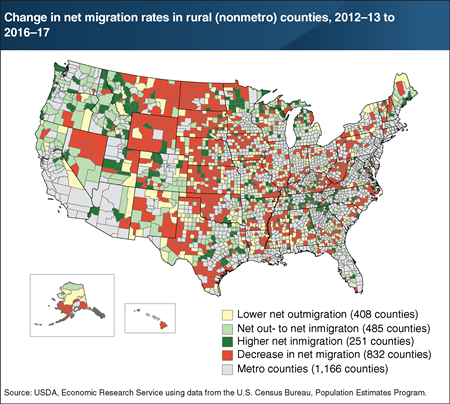
People moving to rural areas tend to favor more densely settled areas with attractive scenic qualities, or those near large cities. Over 1,100 rural counties (58 percent) showed positive changes in net migration (inmigrants minus outmigrants) between 2012–13 and 2016–17. These counties are often located in recreation and retirement destinations attractive to newcomers—such as the Upper Great Lakes, the Pacific Northwest, the southern Appalachians, Florida, and the Hill Country of central Texas. Nearly 500 of these counties switched from net outmigration in 2012–13 to net inmigration in 2016–17. Fewer people are moving to sparsely settled, less scenic, and remote locations, which compounds economic development challenges in those areas. Despite increasing net migration generally, 42 percent of rural counties experienced a decrease in net migration between 2012–13 and 2016–17. These counties are in low-density, remote areas in the Nation’s Heartland, in Appalachia from eastern Kentucky to Maine, and in high-poverty areas in the Southeast and border areas of the Southwest. Some of these areas have suffered job losses related to lower oil and gas production. This chart appears in the November 2018 ERS report Rural America at a Glance, 2018 Edition.
Monday, January 28, 2019
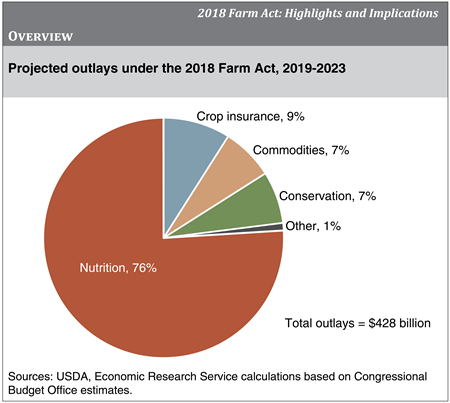
The Agriculture Improvement Act of 2018 (2018 Farm Act) was signed into law December 20, 2018, and will remain in force through the end of fiscal year 2023, although some provisions extend beyond 2023. The Congressional Budget Office (CBO) projects that the new Farm Act will mandate spending of $428 billion dollars over the next 5 fiscal years (2019-2023). A large majority of projected spending—76 percent ($326.02 billion)—will fund nutrition programs, with most going to the Supplemental Nutrition Assistance Program (SNAP). Crop insurance ($38.01 billion), farm commodity programs ($31.44 billion), and conservation programs ($29.27 billion) account for nearly all of the remaining outlays. Approximately 0.8 percent ($3.54 billion) will fund all other programs, including trade, credit, rural development, research and extension, forestry, energy, horticulture, and miscellaneous programs. Overall, the new Farm Act makes fewer changes to food and farm policy than the 2014 Farm Act. Nutrition policy, particularly SNAP, will continue with minor changes. Crop insurance options and agricultural commodity programs will continue largely as under the 2014 Farm Act. All major conservation programs will continue, although some were modified significantly. This chart appears in “The Agriculture Improvement Act of 2018: Highlights and Implications,” December 20, 2018.
Thursday, November 29, 2018
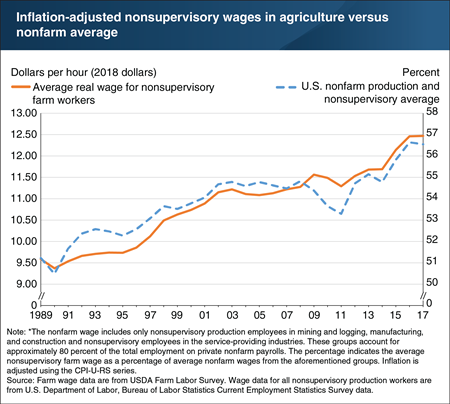
In recent years, farmers have reported rising labor shortages. These anecdotal reports are supported by USDA data, which show average wages for nonsupervisory farm laborers rose more quickly since 2014 than previously. Economists consider inflation-adjusted wage growth to strongly indicate labor shortages in a given industry. From 2014 to 2017, the farm wage grew faster than the nonfarm wage, rising from 55 percent to 57 of the nonfarm wage. Between 2014 and 2017, the average hourly wage for nonsupervisory hired farmworkers rose from $11.69 to $12.47, an increase of 7 percent. In contrast, over the same period, the rise in hourly wage for all nonsupervisory production workers outside of agriculture rose from $21.34 to $22.05, an increase of just over 3 percent. Inflation-adjusted wage growth slowed in 2017 because of lower rates of nominal (non-adjusted) wage growth and an uptick in inflation—a trend that has continued into 2018. As of April 2018, nonsupervisory farm wages averaged $12.74 per hour in nominal terms, an increase of 3 percent over April 2017. This chart appears in the ERS report, “Farm Labor Markets in the United States and Mexico Pose Challenges for U.S. Agriculture,” released in November 2018.
Thursday, November 15, 2018
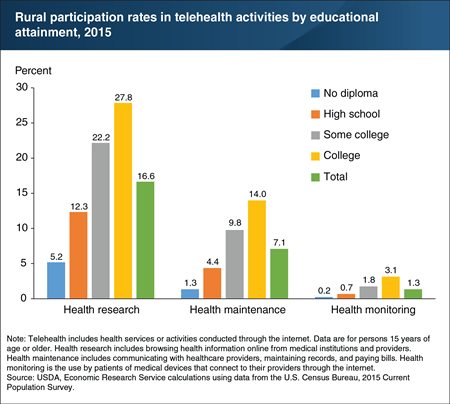
Compared to traditional medical delivery systems, telehealth—health services or activities conducted through the internet—allows people to more actively participate in their health care. It also facilitates timely and convenient monitoring of ongoing conditions. To better understand the factors affecting telehealth use, ERS researchers examined rural residents’ participation in three telehealth activities: online health research, online health maintenance (such as contacting providers, maintaining records, and paying bills), and online health monitoring (the transmission of data gathered by remote medical devices to medical personnel). The ERS analysis looked at a number of socioeconomic factors—including family income, educational attainment, age, and employment type and status—that may affect a person’s choice to engage in telehealth activities. Findings show that participation rates for telehealth activities in 2015 increased with the level of educational attainment. For example, rural residents with college degrees were over 5 times more likely to conduct online health research than residents without a high school diploma, and more than 10 times as likely to engage in the other telehealth activities. This chart appears in the November 2018 ERS report, Rural Individuals’ Telehealth Practices: An Overview.
Friday, November 9, 2018
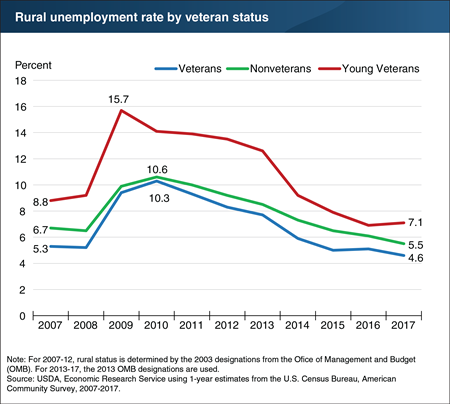
Rural veterans find themselves in a better employment position today than they did in the years following the Great Recession. The unemployment rate for rural veterans has declined since peaking at 10.3 percent in 2010. In 2017, it stood at 4.6 percent, its lowest rate in the last decade. The unemployment rate for young rural veterans (ages 18 to 34) has seen a large decline too—from a high of 15.7 percent in 2009 to 7.1 percent in 2017. Young transitioning veterans can face high unemployment due to service-related disability or a lack of civilian work experience, which become greater obstacles when the economy is weak. Although the post-recession national economic upturn is driving a drop in unemployment for all veterans, a concerted national effort to hire veterans also appears to be helping close the employment gap for young veterans. That effort includes greater recognition of the skills veterans learn during their service—such as discipline and timeliness—and the value of those skills on the job. This chart provides an update to the ERS report, Rural Veterans at a Glance.
Thursday, November 8, 2018
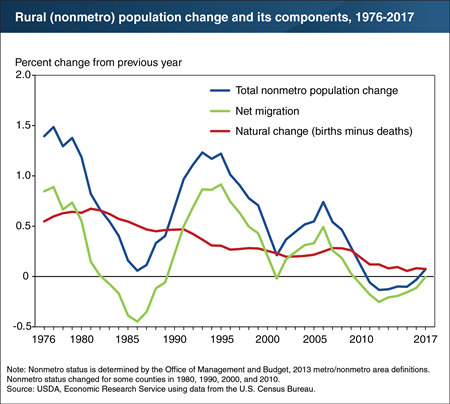
The decline in U.S. rural population, which began in 2010, has reversed for the first time this decade. In 2016-17, the rural population increased by 0.1 percent (adding 33,000 people). This recent upturn in rural population growth stems from increasing rates of net migration, which includes urban-to-rural migration as well as immigration from foreign countries. Rural net migration increased from −0.25 percent in 2011-12 to essentially zero in 2016-17. During the same period, population growth from natural change (births minus deaths) dropped from 0.12 percent to 0.08 percent. This continues a long-term downward trend in growth rates from natural change due to lower fertility rates, an aging population, and, more recently, increasing mortality rates for some age groups. While natural change has gradually trended downward over time, net migration rates tend to fluctuate in response to economic conditions. With growth from natural change projected to continue falling, future population growth in rural America will depend more on increasing net migration—which has coincided with declining rural unemployment, rising incomes, and declining poverty since 2013. These improved labor market conditions have allowed rural areas to retain more residents and attract more newcomers. The total rural population has remained close to 46.1 million since 2013. This chart appears in the November 2018 ERS report Rural America at a Glance, 2018 Edition.
Monday, October 22, 2018
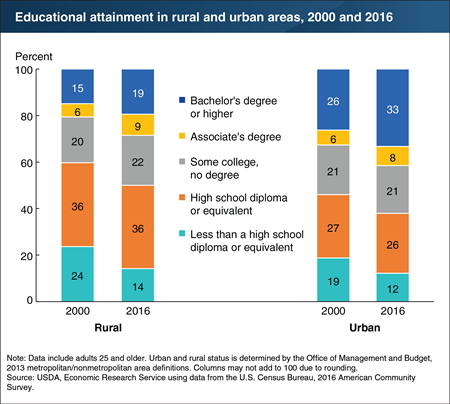
Although the overall educational attainment of rural adults has increased markedly over time, the share of adults with at least a bachelor’s degree is still higher in urban areas. Between 2000 and 2016, the share of urban adults with a bachelor’s degree or higher grew from 26 percent to 33 percent, while in rural areas the share grew from 15 percent to 19 percent. This gap may be partly due to the higher pay premiums offered in urban areas to workers with college degrees. Also, between 2000 and 2016, the share of rural adults with less than a high school diploma or equivalent decreased from 24 percent to 14 percent. That decline closed the rural-urban gap in high school completion rates: over the same period, the share of urban adults without a high school degree or equivalent fell from 19 percent to 12 percent. This chart appears on the ERS topic page for Rural Education, updated August 2018.
Friday, September 7, 2018
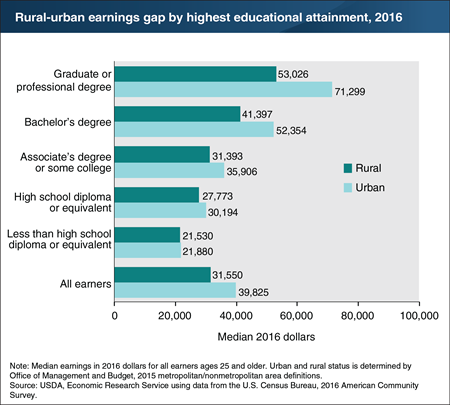
The most recent data from the U.S. Census Bureau’s 2016 American Community Survey show that workers with higher levels of education had higher median earnings, both in rural and urban areas. For example, median earnings for rural working adults with a high school diploma were $27,773 in 2016, which was $6,243 more than the median for rural working adults without a high school diploma or equivalent. Urban workers without a high school diploma earned about the same as their rural counterparts. However, at every higher level of educational attainment, the typical urban worker earned increasingly more than the typical rural worker with the same education. This rural-urban earnings gap was lowest ($350) for workers with less than a high school diploma or equivalent and largest ($18,273) for those with graduate or professional degrees. Educational attainment is only one of many potential characteristics that determine the wages that workers earn. Other characteristics not shown in the chart—such as work experience, job tenure, and ability—may also contribute to earnings. This chart appears on the ERS topic page for Rural Education, updated August 2018.
Wednesday, July 25, 2018
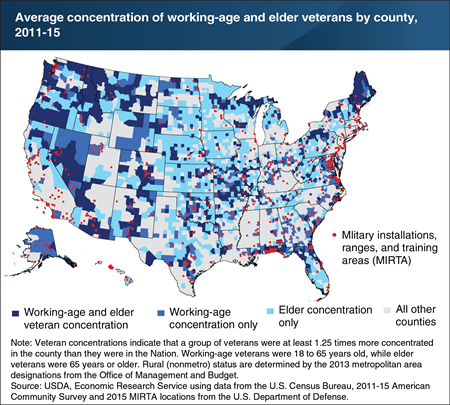
Veterans constitute a rapidly aging and increasingly diverse group disproportionally living in rural America. Nearly 18 percent of veterans lived in rural (nonmetro) counties in 2015, compared to 15 percent of the U.S. adult civilian population. Veterans were also overrepresented in some rural counties: about 10 percent of all rural civilian adults were veterans, but in some rural counties, that share reached as high as 25 percent. The U.S. counties with the highest shares of veterans tended to have significant concentrations of elder veterans (65 years or older), relative to the Nation as a whole. About 24 percent of all U.S. counties—often completely rural counties not adjacent to metro areas—had concentrations of elder veterans. By comparison, 28 percent of all U.S. counties—predominantly large urban counties (not shown)—contained concentrations of working-age veterans (18 to 65 years old). Areas with concentrations of both groups were mostly in rural counties adjacent to metro areas (19 percent). Many of these counties contained or were near military installations, reserve bases, or training areas. This chart appears in the September 2017 Amber Waves data feature, “Veterans Are Positioned To Contribute Economically to Rural Communities.”
Monday, June 11, 2018
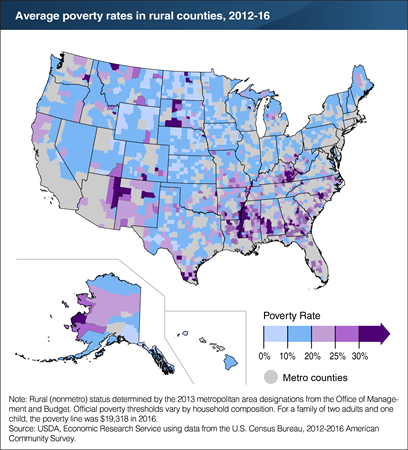
Rural Americans living in poverty tend to be clustered in certain U.S. regions and counties. Rural (nonmetro) counties with a high incidence of poverty are mainly concentrated in the South, which had an average poverty rate of over 21 percent between 2012 and 2016. By comparison, urban (metro) counties in the South had an average poverty rate of about 16 percent. Rural counties with the most severe poverty are found in historically poor areas of the Southeast—including the Mississippi Delta and Appalachia—as well as on Native American lands. The incidence of rural poverty is relatively low elsewhere, but generally more widespread than in the past. This chart appears in the ERS topic page for Rural Poverty & Well-being, updated April 2018.
Tuesday, May 29, 2018
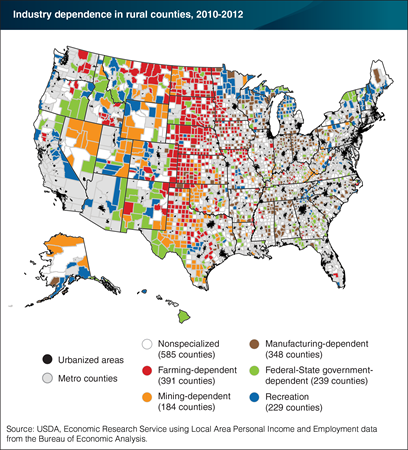
On May 29, 2018, the Chart of Note article “Rural economies depend on different industries” was reposted to correct the industry classification of a few counties and, in the legend, show the number of rural counties only, instead of all counties.
Rural counties depend on different industries to support their economies. Counties’ employment levels are more sensitive to economic trends that strongly affect their leading industries. For example, trends in agricultural prices have a disproportionate effect on farming-dependent counties, which accounted for nearly 20 percent of all rural counties and 6 percent of the rural population in 2017. Likewise, the boom in U.S. oil and natural gas production that peaked in 2012 increased employment in many mining-dependent rural counties. Meanwhile, the decline in manufacturing employment has particularly affected manufacturing-dependent counties, which accounted for about 18 percent of rural counties and 22 percent of the rural population in 2017. This chart is based on the ERS data product for County Typology Codes, updated May 2017.
Friday, May 18, 2018
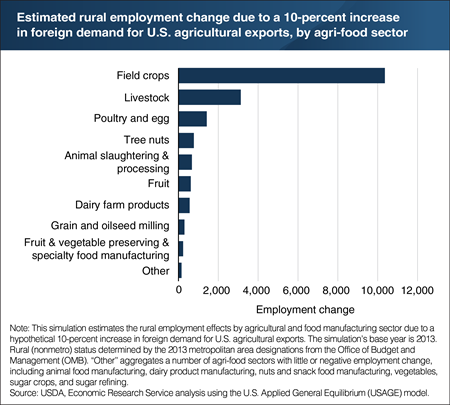
ERS estimates that U.S. agricultural exports, totaling about $135 billion in 2016, supported about 1.1 million full-time, civilian jobs. Using a model of the U.S. economy with a base year of 2013, ERS researchers found that a hypothetical 10-percent increase in foreign demand for U.S. agricultural exports would add about 41,500 jobs, or about a 0.03-percent increase in total U.S. employment. About 42 percent would be in rural areas—where employment in agriculture and food manufacturing would increase by about 18,200 jobs, while employment in other sectors would decrease by nearly 700 jobs as some labor shifts into agriculture. The net effect on employment was positive for 17 of the 20 agri-food sectors in the analysis, with the largest increases in field crops, livestock, and poultry and egg. This reflects the large initial shares of exports and employment in these sectors, relative to other agri-food sectors. Field crops alone accounted for nearly 57 percent of the increase in agri-food rural employment. This chart is based on data that appears in the April 2017 ERS report The Potential Effects of Increased Demand for U.S. Agricultural Exports on Metro and Nonmetro Employment.
Monday, April 2, 2018
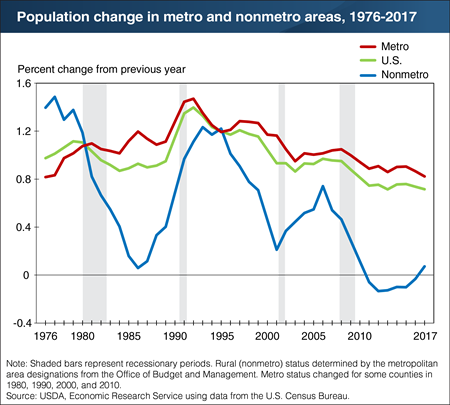
Between July 2016 and July 2017, rural (nonmetro) counties increased in population for the first time this decade, according to the most recent estimates released last month by the U.S. Census Bureau. The shift in rural population change was quite small, from a loss of 15,000 people in 2015-16 to a gain of 33,000 in 2016-17. However, it continues an upward trend in all but one year since 2011-12, when rural counties declined by 61,000 people. Population growth rates for rural areas have been significantly lower than in urban (metro) areas since the mid-1990s, and the gap widened considerably after the housing-market crisis in 2007 and the Great Recession that followed. The gap between rural and urban growth rates has narrowed slightly in recent years, but remains significant. Urban areas grew by 0.82 percent in 2016-17, compared with 0.07 percent growth in rural areas. The recovery in population growth for rural America during this decade has been much more gradual compared with previous rural population downturns. This chart updates data found in the September 2017 Amber Waves data feature, "Rural Areas Show Overall Population Decline and Shifting Regional Patterns of Population Change."
Wednesday, March 28, 2018
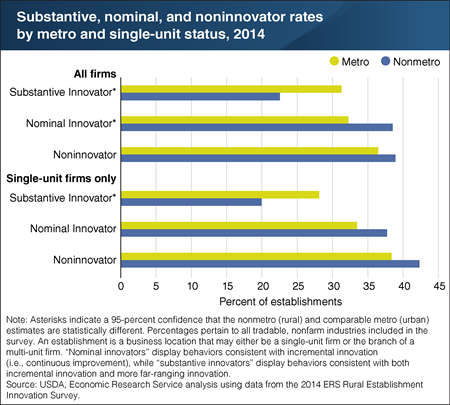
Innovation—the introduction of new products or ways of doing business that consumers value—is widely regarded as an essential component of resilient local economies. Using a comprehensive measure of innovation, ERS researchers found a higher prevalence of substantive innovators in urban (metro) areas. Over 31 percent of urban establishments (100 employees or more) were classified as substantive innovators, compared with nearly 23 percent of rural (nonmetro) establishments. This gap may reflect the potential innovation advantages stemming from denser business and consumer networks in urban areas. Researchers also examined the substantive innovation rates of single-unit firms to determine whether substantive innovation in rural areas was truly a rural phenomenon—not just innovation strategies of national or multi-national firms with rural production locations. About 20 percent of single-unit firms in rural areas were classified as substantive innovators, compared to nearly 23 percent overall, confirming that some wholly rural firms are pursuing more far-ranging innovation. This chart appears in the ERS report, Innovation in the Rural Nonfarm Economy: Its Effect on Job and Earnings Growth, 2010-2014, released September 2017.
Thursday, March 8, 2018
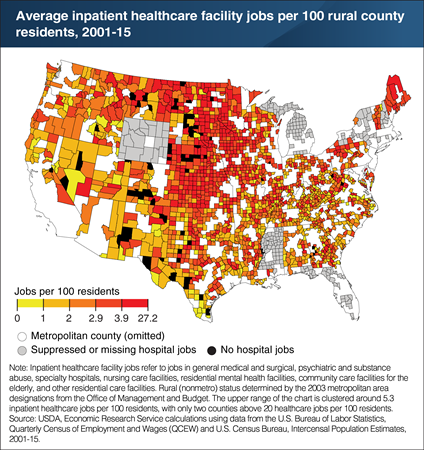
Rural inpatient healthcare facilities—such as general hospitals, nursing care facilities, and residential mental health facilities—can improve the health and economic well-being of local communities. At its peak in 2011, rural inpatient healthcare employment reached over 1.25 million wage and salary jobs, or about 8.5 percent of total rural (wage and salary) employment. However, employment in the rural inpatient healthcare sector varies by region. Between 2001 and 2015, rural counties with the most inpatient healthcare facility jobs per resident were concentrated in the Upper Midwest and Northern Great Plains. Regions with fewer inpatient healthcare jobs per resident include much of the West, the Southern Great Plains, and the South. The regional variation in rural healthcare employment per resident may reflect in part the relatively heavier dependence of some sparsely populated areas on hospital employment, and the difficulty many rural communities face in attracting and retaining physicians and other healthcare professionals. One study found, for example, that over 85 percent of rural counties had a shortage of primary care health professionals in 2005. Additionally, between January 2010 and December 2016, 78 rural hospitals closed—about 4 percent of the 1,855 total rural hospitals. This chart appears in the ERS report, Employment Spillover Effects of Rural Inpatient Healthcare Facilities, released November 2017.
Tuesday, February 13, 2018
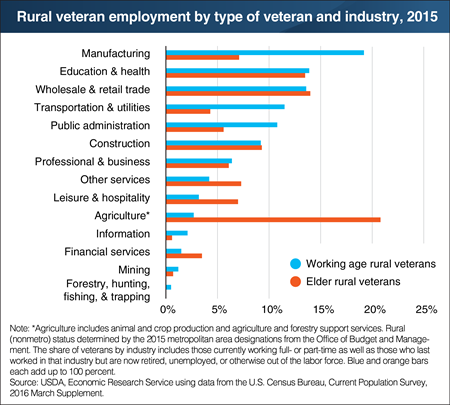
Nearly 19 million veterans lived in the United States in 2015. Almost 18 percent of them lived in rural (nonmetro) counties, compared to 15 percent of the U.S. adult civilian population. About 45 percent of rural veterans were working age (18 to 64 years old); the rest were elder veterans (65 years or older). Overall, about 21 percent of elder rural veterans reported currently working (full- or part-time) or having last worked (if retired or unemployed) in the agriculture industry. By comparison, less than 3 percent of working-age veterans reported the same. Instead, working-age veterans relied more on the manufacturing industry for employment. About 19 percent of working age veterans reported currently working or having last worked in manufacturing, compared to 7 percent of elder veterans. Both working age and elder veterans relied about equally for employment in some industries—including education and health, wholesale and retail trade, and construction. This chart appears in the September 2017 Amber Waves data feature, "Veterans Are Positioned To Contribute Economically to Rural Communities."
Monday, January 29, 2018
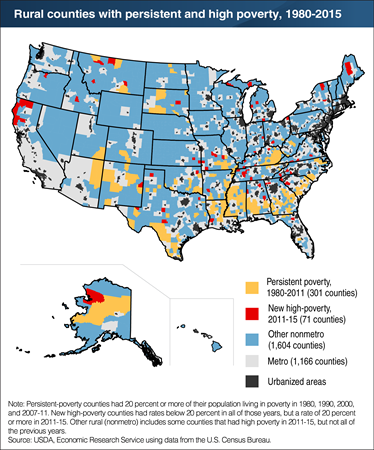
Rural poverty is regionally entrenched, especially in the South where nearly 22 percent of rural (nonmetro) residents live in families with below-poverty incomes. Rural poverty is also entrenched in parts of the Southwest and northern Great Plains. Over 300 rural counties (15 percent of all rural counties) are persistently poor, compared with just 50 urban counties (4 percent of all urban counties). Many of these counties are not entirely poor, but rather contain multiple and diverse pockets of poverty and affluence. Rural poverty rates rose during the Great Recession and in initial post-recession years. Persistent poverty is currently measured from 1980 to 2007-11, which captures the effects of the Great Recession (2007-09). More recent data identifies 71 new high-poverty rural counties in 2011-15 that were not high poverty at any point from 1980 to 2007-11. Most of these new high-poverty counties were outside current persistent regions, including northern California and counties in the Southeast and Midwest that were affected by the loss of manufacturing jobs during the Great Recession. This chart appears in the ERS report Rural America at a Glance, 2017 Edition, released November 2017.
Wednesday, January 17, 2018
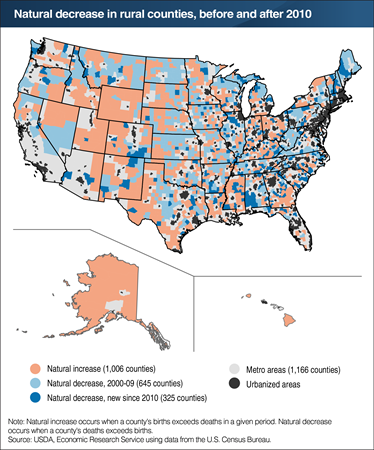
Declining birth rates, increasing mortality rates among working-age adults, and an aging population have led to the emergence of natural decrease (more deaths than births) in hundreds of U.S. counties—most of them rural counties. During 2010-16, 325 rural counties experienced sustained natural decrease for the first time, adding to 645 rural counties with natural decrease during 2000-09. Areas that recently began experiencing natural decrease (the dark blue areas) are found in New England, northern Michigan, and high-poverty areas in the southern Coastal Plains. Such counties also are found in and around the margins of Appalachia, expanding a large region of natural decrease extending from Maine through northern Alabama. Between 2000 and 2016, over a thousand rural counties still experienced population growth from natural increase (more births than deaths). This chart appears in the September 2017 Amber Waves data feature, "Rural Areas Show Overall Population Decline and Shifting Regional Patterns of Population Change."


