
Poverty rates in rural and urban areas vary across U.S. regions
- by Tracey Farrigan
- 4/3/2019
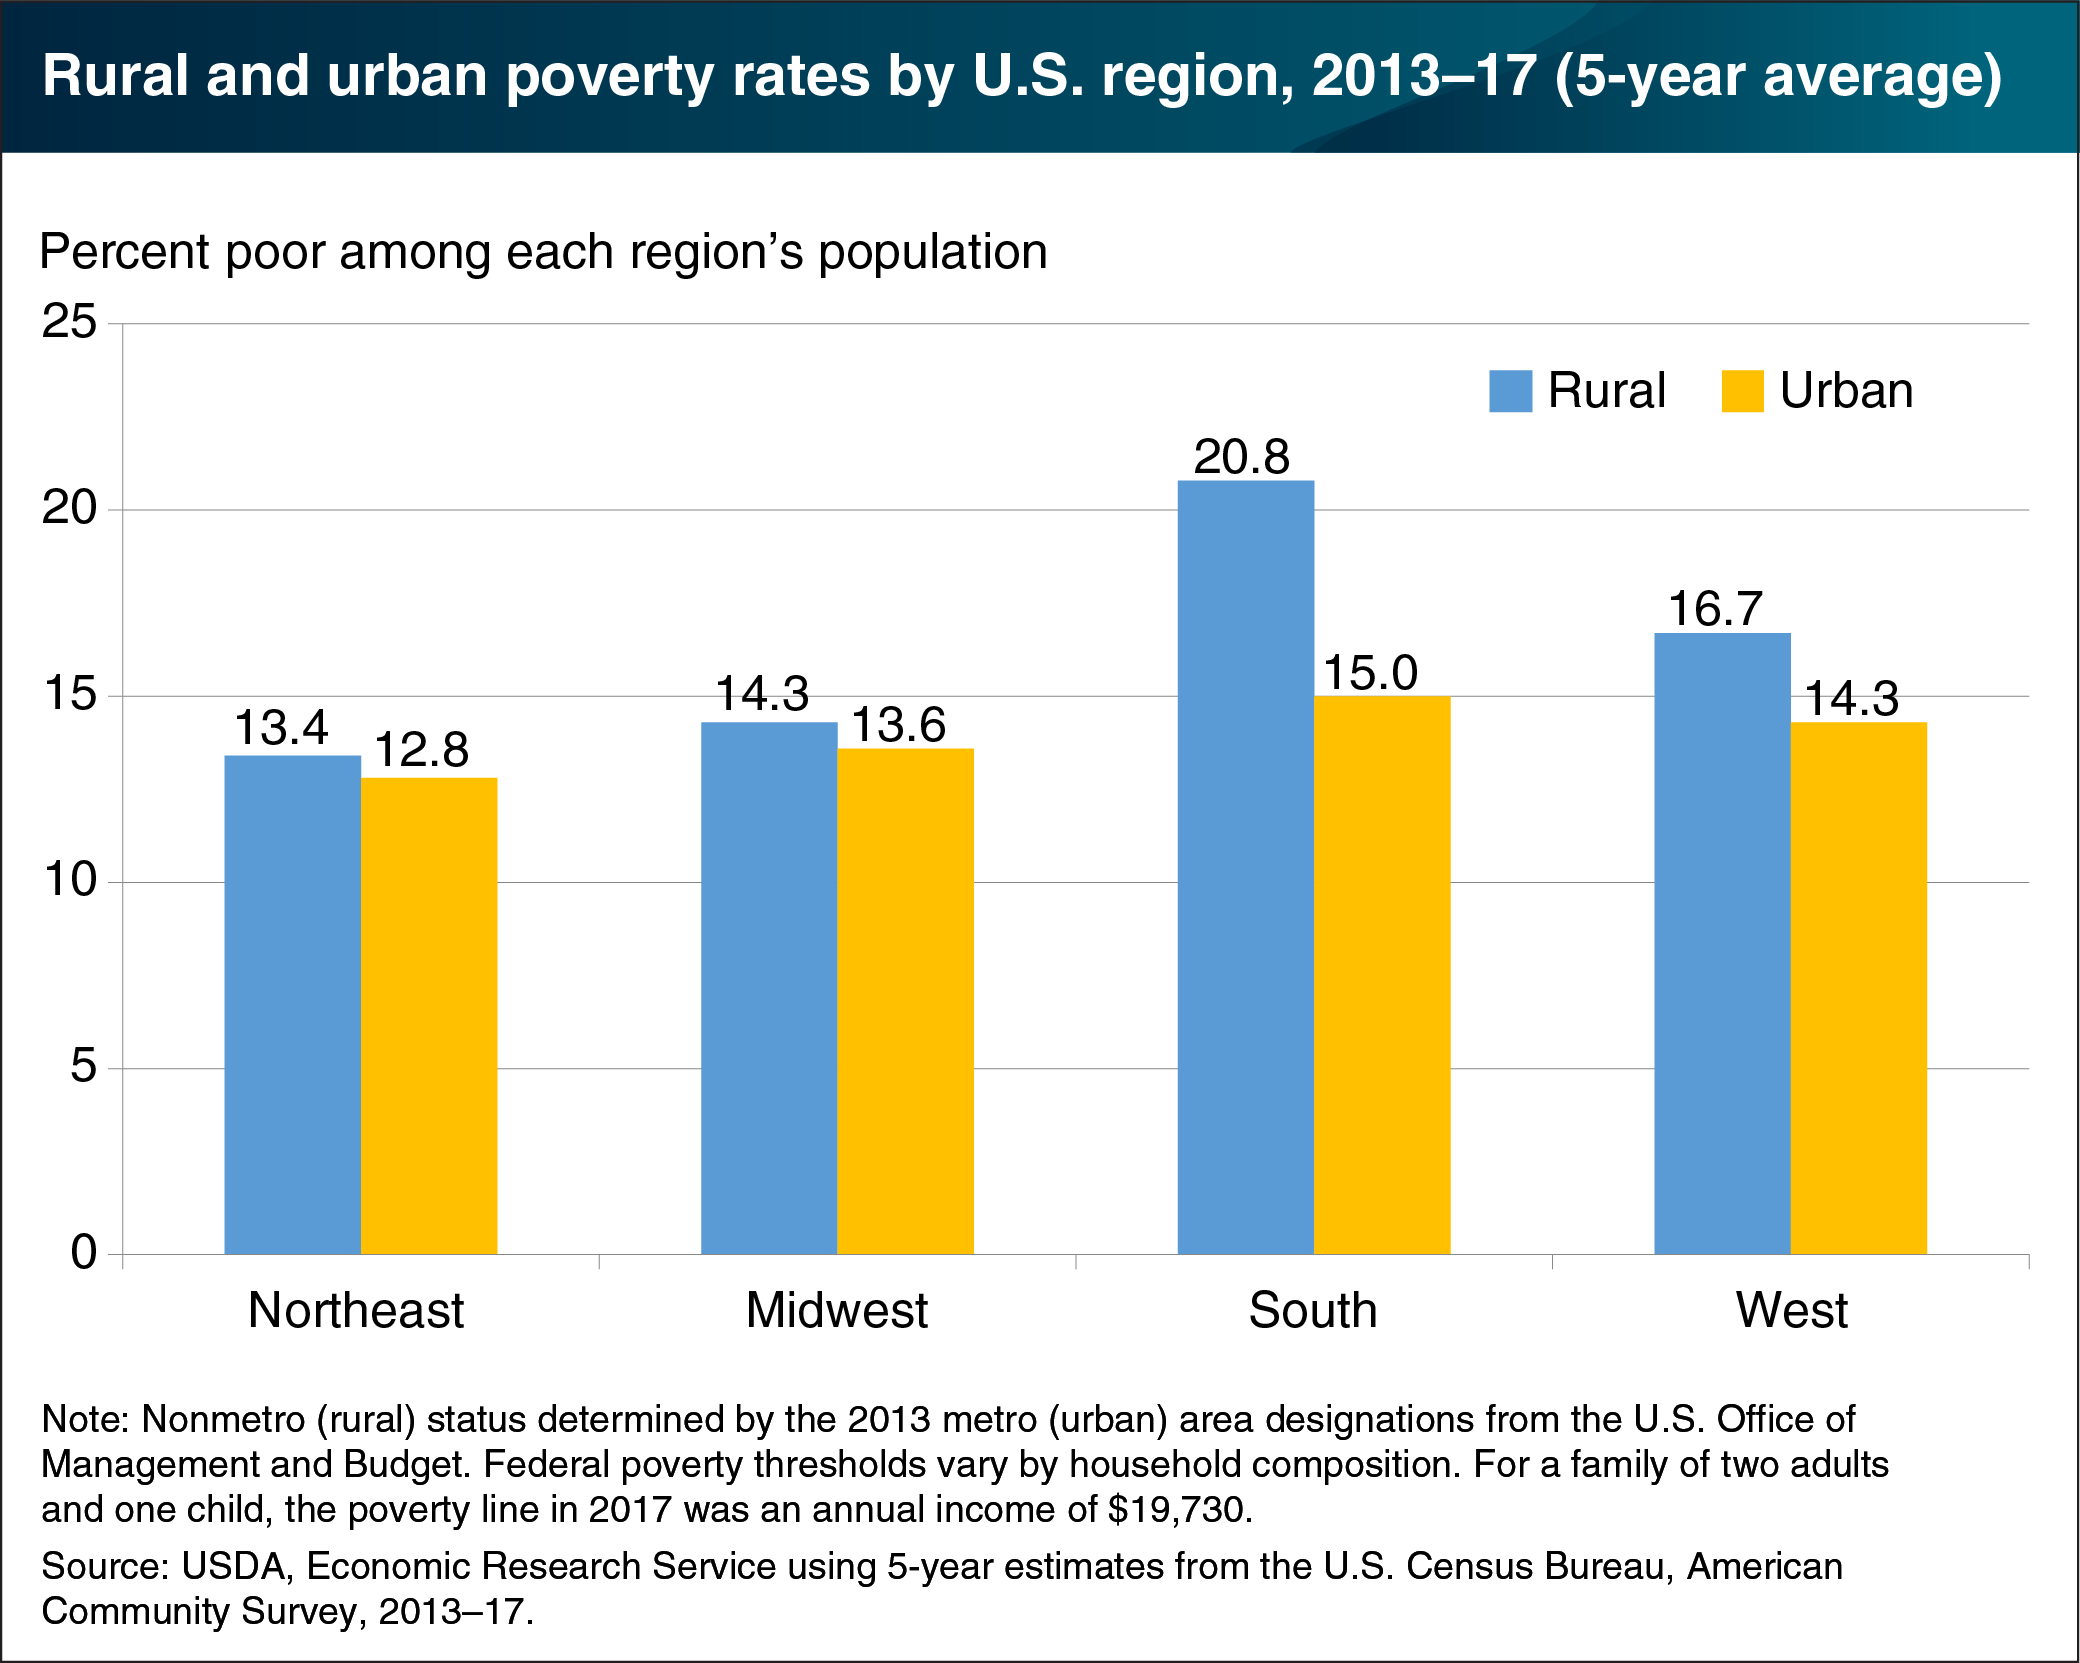
Poverty rates in rural (nonmetro) areas have historically been higher than in urban (metro) areas, and the rural/urban poverty gap is greater in some regions of the country than others. For example, the gap has historically been largest in the South. In 2013–17, the South had an average rural poverty rate of 20.8 percent—nearly 6 percentage points higher than the average rate in the region’s urban areas. The difference in the South’s poverty rates is particularly important because an estimated 42.6 percent of the Nation’s rural population and 51.1 percent of the Nation’s rural poor lived in this region between 2013 and 2017. By comparison, 36.9 percent of the urban population and 39.1 percent of the urban poor lived in the South during that period. The poverty gap was smallest in the Midwest and the Northeast—with less than a percentage point difference between rural and urban poverty rates. This chart appears on the ERS topic page “Rural Poverty & Well-being,” updated March 2019.