ERS Charts of Note
Subscribe to get highlights from our current and past research, Monday through Friday, or see our privacy policy.
Get the latest charts via email, or on our mobile app for  and
and 
Tuesday, June 9, 2015
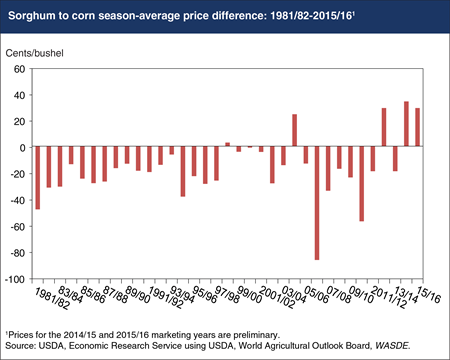
In recent years, the price of sorghum has been supported by unusually strong export demand, particularly from China. Sorghum is a common substitute for corn in feed rations and is also used for ethanol production in the United States. In most countries, corn tends to be preferred over sorghum for livestock feed, so sorghum typically sells at a discount to corn in global markets. However, since sorghum does not face import quotas and other constraints that often delay or restrict shipments of corn and distillers dried grains (DDGS) from entering the country, China’s demand for U.S. sorghum has surged. Imports by China were negligible prior to 2013, but it is now the principal buyer of U.S. sorghum and is expected to account for more than 90% of the 350 million bushels of sorghum the United States is forecast to export in the 2014/15 marketing year. The strong increase in demand has pushed U.S. sorghum prices higher, resulting in a premium over corn that is expected to persist for the second consecutive marketing year. While not without precedent, the season average price of sorghum has exceeded the price of corn only in 4 previous marketing years since 1981/82, and only 18 times in the 96-year history of sorghum price reporting. This chart is based on the ERS report, Feed Outlook: May 2015,.
Wednesday, April 8, 2015
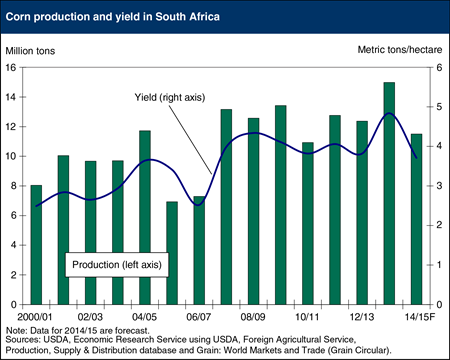
South Africa’s 2014/15 corn production is forecast at 11.5 million tons, down 23 percent from the previous year. Area harvested is expected to be unchanged from a year earlier, but yields are forecast to drop 10 percent from the 5-year average due to heat and dryness during critical growth stages. South Africa is normally one of the world’s top 10 corn exporters, with exports averaging 2.1 million tons over the last 5 years. While favorable weather and growing conditions in most major corn producing countries is supporting record world corn yields in 2014/15, South Africa, one of the last countries to harvest corn in the 2014/15 marketing year, is expected to lower corn exports by half to 1 million tons. South Africa produces both white and yellow corn, and both types are experiencing poor weather conditions this year. White corn is a staple food in South Africa, and due to the production shortfall it will require a price premium over yellow corn to channel it into human food use and away from feeding to animals. This chart is based on the March 2015 Feed Outlook report.
Monday, March 16, 2015
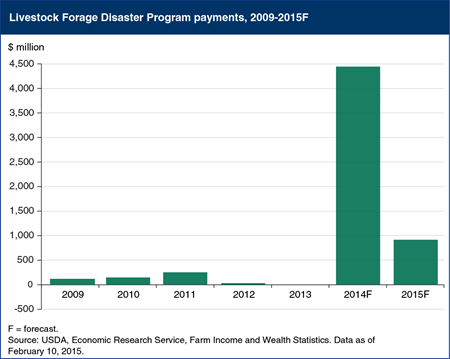
The Livestock Forage Disaster Program (LFP) was initially authorized by the Food, Conservation, and Energy Act of 2008 to reimburse eligible farmers and ranchers for grazing losses due to a qualifying drought or fire through September 30, 2011 (the end of the period covered by the 2008 Act). The 2014 Farm Act made LFP a permanent program, and included payments retroactive to October 1, 2011. ERS’s farm income forecast for 2014 includes $4.4 billion in expected LFP payments, incorporated in the direct government payments category “ad hoc and disaster assistance payments.” The 2014 forecast is an over 700-percent increase over the sum of LFP payments made during the previous 5 years. This large spike—generally regarded as a one-time event—reflects large retroactive payments for 2012 and 2013, which account for 84.2 percent of the 2014 expected payout. The 2014 Farm Act included a number of changes that could raise future LFP payments, although not to 2014’s extraordinary level. This chart is found in the Amber Waves finding, “Livestock Forage Disaster Program Payments Increase in 2014.”
Monday, February 2, 2015
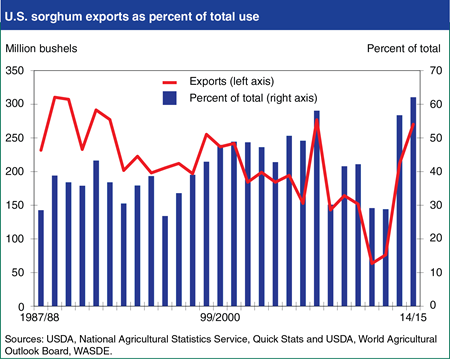
U.S. exports of sorghum have surged in the past two years, growing from less than 65 million bushels during the 2011/12 marketing year to 270 million forecast for 2014/15. Sorghum is a common substitute for corn in feed rations and is also used for ethanol production in the United States. Since in most countries corn tends to be preferred over sorghum for livestock feed, U.S. sorghum exports have been trending lower for several decades. But in recent years China has emerged as a leading destination for U.S. sorghum since sorghum does not face import quotas and other constraints that often delay or restrict shipments of corn and distillers dried grains (DDGS) from entering the country. For the current marketing year (2014/15), exports are forecast to account for 62 percent of total use, the highest proportion since 1975. The strength of the export market has also helped raise the price of sorghum, which is currently forecast to average 4 percent higher than the price of corn for the current marketing year, compared to the more common tendency for sorghum to sell at a 5 to 10 percent discount to corn. This chart is based on the January 2015 Feed Outlook report.
Tuesday, May 27, 2014
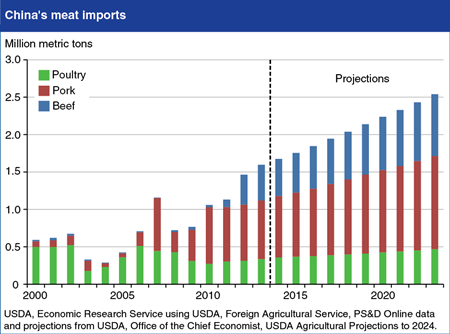
While USDA projects robust increases in China’s meat production and imports of feed grains, China’s meat imports are also projected to rise. Pork imports are projected to show the most growth, rising from about 750,000 tons in 2013 to 1.2 million tons by 2023. The United States, Canada, and European Union are the main suppliers of pork to China. China’s meat consumption is expected to expand at a pace similar to the trend of the past decade. Pork will continue to play a central role in China’s meat economy (China accounts for half of world production and consumption), however, poultry is gaining in popularity, largely because it is cheaper than pork. Restaurants, fast food chains, and cafeterias play a key role in diversifying meat consumption, since many feature specific kinds of meat or chicken. Beef and mutton are important parts of popular ethnic cuisines becoming popular among the broader population. Although China is expected to continue producing most of its own meat, China’s livestock sector is under pressure from rising costs, disease, environmental regulations, and resource constraints, which could lead to China’s meat imports rising even further if production cannot sustain its current pace of growth. Find this chart and more analysis in the April Amber Waves feature article "China in the Next Decade: Rising Meat Demand and Growing Imports of Feed."
Tuesday, April 29, 2014
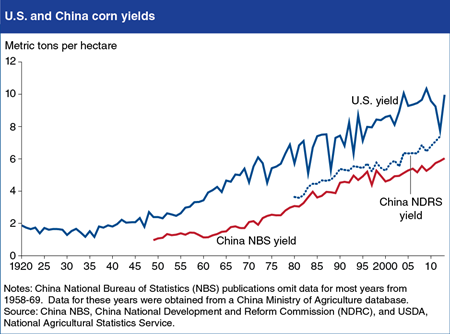
Data sources indicate that China’s corn yields continue to lag behind yields achieved in the United States (the world’s leading producer) with implications for China’s ability to meet future corn demand through domestic production. Both China’s official yield estimates provided by the National Bureau of Statistics (NBS) and alternative survey-based estimates provided by China’s National Development and Reform Commission (NDRC) show China’s average corn yields to be both lower and growing more slowly than U.S. average yields. A key factor constraining yield growth in China is slow progress in breeding appropriate varieties to build on past gains achieved from the adoption of hybrid corn. While fertilizer use is already high by world standards, improvements in pest protection and drought resistance—potentially through the adoption of genetically modified varieties—may offer yield gains. Current USDA corn supply and demand projections for China indicate that demand is likely to outpace production, leading to expanding corn imports. Find this chart and additional analysis in Prospects for China’s Corn Yields and Imports.
Friday, April 18, 2014
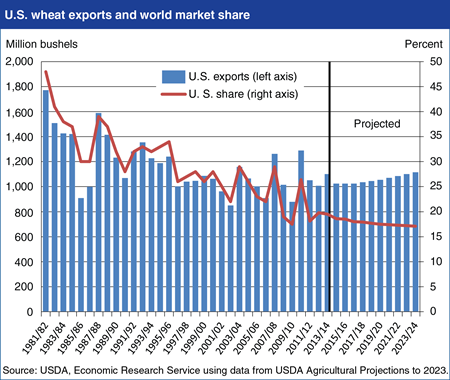
Although global and U.S. wheat exports are projected to rise over the next decade, the U.S. share of the world market is projected to continue to decline because of competition from other exporters. Global demand for wheat is expected to expand, driven primarily by income and population growth in developing country markets, including Sub-Saharan Africa, Egypt, Pakistan, Algeria, Indonesia, the Philippines, and Brazil. The number of major exporting countries has, however, expanded in recent years from the traditional wheat exporters--the United States, Argentina, Australia, Canada, and the European Union--to include Ukraine, Russia, and Kazakhstan. Although variable, the wheat export volume of those three Black Sea exporters together now rivals that of the United States. Low production costs and new investment in the agricultural sectors of the Black Sea region have enabled their world market share to climb, despite the region’s highly variable weather. Competition from the Black Sea region, as well as from traditional exporters, has resulted in a decline in the U.S. share of expanding world exports from an average of about 39 percent in the first half of the 1980s to an average of about 20 percent over the last 5 years. Find this chart and additional analysis on the Wheat topic page.
Friday, April 4, 2014
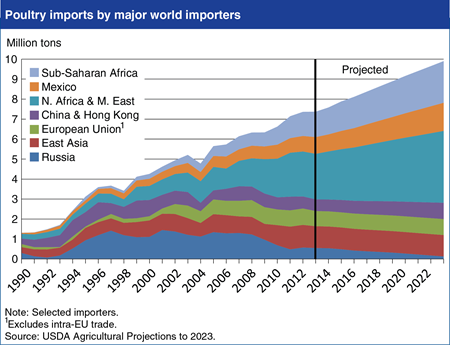
Poultry meat imports by major importers are projected to increase by 2.5 million tons (34 percent) between 2013 and 2023, led by rising import demand in North Africa and the Middle East (NAME), Mexico, and Sub-Saharan Africa (SSA). Similar factors are expected to drive import growth in each region. Rising incomes and the low cost of poultry meat relative to other meats are projected to favor growth in poultry meat consumption among the low- and middle-income consumers in each region. At the same time, limited local supplies of feed grains and feed protein in all three regions are expected to continue to limit the expansion of indigenous poultry meat production. The NAME region currently accounts for 47 percent of imports by the major poultry importers, and is projected to account for nearly 80 percent of the increase in their poultry meat imports between 2014 and 2023. In contrast, little import growth is projected for Russia, where policies continue to deter imports in favor of domestic producers, and for China, where domestic production is projected to keep pace with demand. Find this chart and additional analysis in USDA Agricultural Projections to 2023.
Thursday, March 20, 2014
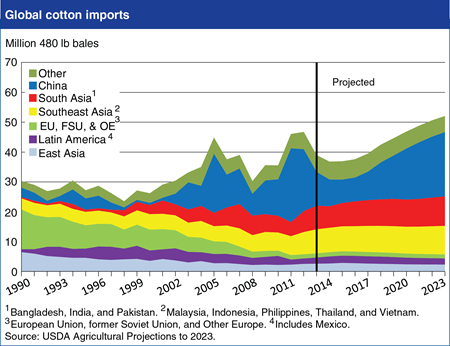
Although world cotton trade is projected to expand at a rapid 3.8-percent growth rate between 2014/15 (August/July marketing years) and 2023/24, cotton trade is expected to contract in the medium term as China reduces its imports. China—the world’s largest cotton importer—is expected to slow its imports through 2016/17 because of its announced intention to reform cotton price supports, likely reducing its currently large cotton stocks. China’s cotton imports are projected to initially decline to less than 40 percent of peak levels, but resume growth by 2017/18 and support the expansion of world cotton trade to record levels by 2020/21 and beyond. China’s reforms are expected to allow it to recover part of the share of world cotton consumption that it lost between 2009 and 2013 when, because of relatively high prices of Chinese cotton, some textile production and cotton import demand shifted to other countries, including Bangladesh, Turkey, Vietnam, and Pakistan. China is projected to remain the world’s largest importer in 2023, followed by Bangladesh, Turkey, and Vietnam. Find this chart and additional analysis in USDA Agricultural Projections to 2023.
Monday, March 3, 2014
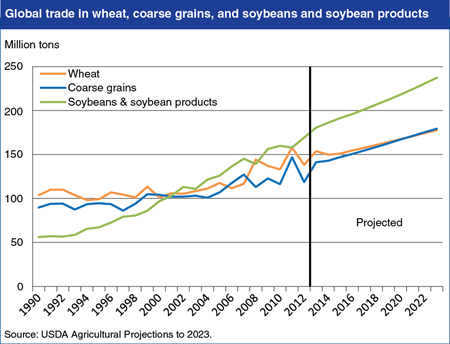
Soybeans and soybean products—including soybeans, soybean meal, and soybean oil—is projected to lead the growth in world bulk agricultural commodity trade over the next decade (2014-2023). Trade in soybeans and soybean products has increased rapidly since the early 1990s, surpassing trade in wheat and coarse grains (corn, barley, sorghum, rye, oats, millet, and mixed grains). Continued strong growth in global demand for vegetable oil and protein meal, particularly in China and other Asian countries, is expected to maintain soybean and soybean products trade above both wheat and coarse grain trade during the next decade. World coarse grain trade is projected to increase 25 percent over the next 10 years, with corn expected to gain an increasing share of the coarse grain market. The expansion of livestock production in feed-deficit areas, including China, Mexico, and Africa and the Middle East, continues to be the principal driver of growth in coarse grain trade. World wheat trade is projected to expand 19 percent over the decade, with growth in imports concentrated in developing countries in West and Sub-Saharan Africa, North Africa and the Middle East, Indonesia, and Pakistan. Find this chart and additional analysis in USDA Agricultural Projections to 2023.
Wednesday, February 19, 2014
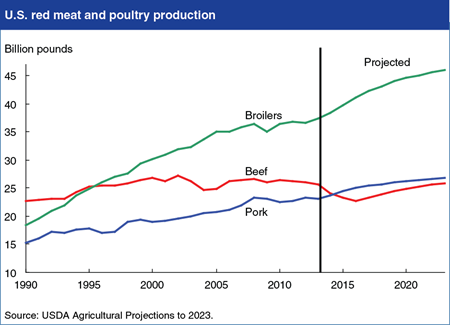
The U.S. livestock sector is slowly recovering from high feed prices and drought in the Southern Plains of the United States over the last few years. Improving returns have provided incentives for increased production in the livestock sector. As a result, total U.S. red meat and poultry production is projected to grow over the next decade. Low cow inventories are expected to limit recovery from recent drought conditions for several years and reduce beef production through 2016, but production is projected to grow in the longer term as returns support continued herd expansion and higher slaughter weights. In the near term, declining feed costs are expected to lead to increased hog farrowing, and pork production is projected to rise over the next decade, supported by continued (albeit slower) productivity gains in the breeding herd and increased slaughter weights. Poultry production is expected to expand over the next decade, but at lower rates than in the 1980s and 1990s. Increasing demand is expected to strengthen broiler prices, although poultry is expected to face competition from increasing red meat production beyond 2016. Find this chart and additional analysis in USDA Agricultural Projections to 2023.
Friday, February 14, 2014
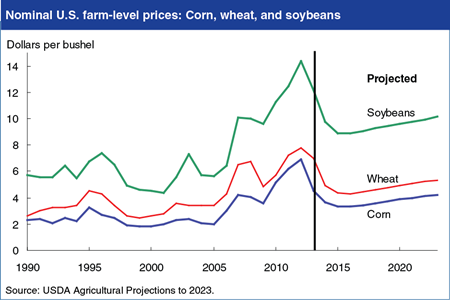
Although market responses to high crop prices in recent years, both in the United States and in other countries, are projected to lower U.S. crop prices over the next couple of years, in the longer term prices for corn, wheat, and soybeans are projected to remain high relative to historical prices. The continuing influence of several long-term factors—including global growth in population and per capita income, a low-valued U.S. dollar, increasing costs for crude petroleum, and rising biofuel production—underlies these price projections. Corn prices are projected to decline through 2015/16, but then begin increasing in 2016/17 as ending stocks tighten due to growth in feed use, exports, and demand for corn by ethanol producers. Soybean prices are expected to initially fall from recent highs but then rise moderately after 2015/16, reflecting strengthening demand for soybeans and soybean products. Wheat prices are projected to fall through 2016/17, in response to rising wheat stocks and falling corn prices, but strengthen in the longer term due to export growth, moderate gains in food use, and declining stocks. Find this chart and additional analysis in USDA Agricultural Projections to 2023.
Tuesday, February 11, 2014
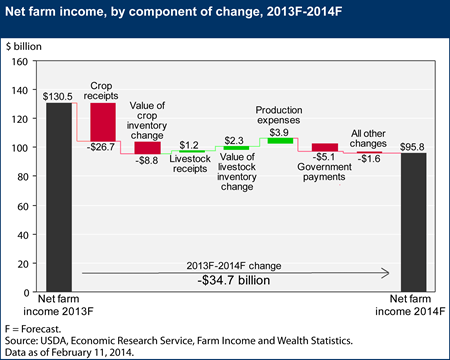
USDA’s initial forecast for 2014 net farm income is $34.7 billion lower than current expectations for 2013, but is $8 billion higher than the average of the previous 10 years. Lower crop cash receipts, and, to a lesser degree, a change in the value of crop inventories and reduced government farm payments, drive the expected drop in net farm income. Crop receipts are expected to decrease more than 12 percent in 2014, led by an expected $11-billion decline in corn receipts and a $6-billion decline in soybean receipts. Elimination of direct payments under the Agricultural Act of 2014 and uncertainty about program enrollment during 2014 result in a projected $5.1 billion decline in government payments. On the other hand, total production expenses are forecast to decline $3.9 billion in 2014, which would be only the second decline in the last 10 years. Livestock receipts and value of inventory change also are expected to increase a combined $3.5 billion in 2014, largely due to higher dairy receipts and the potential for expansion of the beef cattle herd for the first time since 2007. This chart is based on the data available in Farm Income and Wealth Statistics, updated February 11, 2014.
Tuesday, November 19, 2013
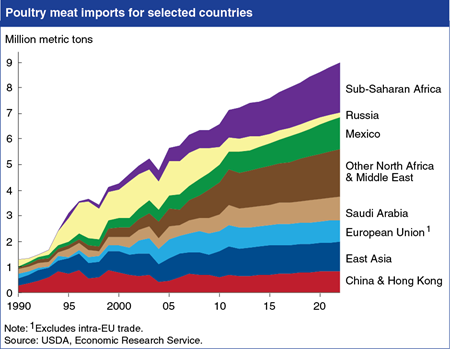
The United States is the world’s second largest poultry meat exporter behind Brazil, with U.S. exports valued at $4.2 billion and accounting for 20 percent of U.S. broiler meat production in 2012. According to USDA’s long-term projections, world import demand for poultry meat is expected to grow 1.56 million tons over the next 10 years. Brazil’s poultry exports—aided by relatively low production costs—are expected to grow 27 percent by 2022, compared with 11 percent projected growth in U.S. exports. Strong growth in poultry imports is projected for much of the world, except for Russia and the European Union. Continued growth is projected in the Africa and the Middle East region—including Sub-Saharan Africa, Saudi Arabia, and Other North Africa and Middle East—which now accounts for more than 40 percent of poultry imports by major importers. In this and other developing regions, rising consumer incomes, population growth, urbanization, and the typically low cost of poultry meat relative to other meats are key drivers of expanding poultry demand. This chart can be found in Assessing Growth in U.S. Broiler and Poultry Meat Exports, LDPM-231-01, released November 8, 2013.
Friday, November 15, 2013
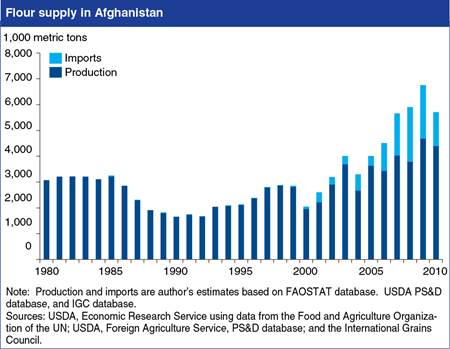
Afghanistan is among the world’s largest importers of wheat flour, with imports growing since 2000 because of a recovery in internal demand, and inadequate water supplies that continue to limit domestic wheat production. Afghan flour production—the nation’s largest official agro-industry—faces competition from imported flour, much of it from neighboring Pakistan where wheat producers and flour millers benefit from Government support. Efforts to support Afghanistan’s flour-milling sector by increasing border protections on flour and wheat—if enforceable along the country’s rugged borders—would have uncertain impact on water-constrained wheat production, and impose higher costs on consumers. Unhindered wheat and flour imports, including imports from Pakistan, may support growth in domestic flour consumption, with relatively small losses in farm output. This chart appears in Afghanistan’s Wheat Flour Market: Policies and Prospects.
Thursday, August 22, 2013
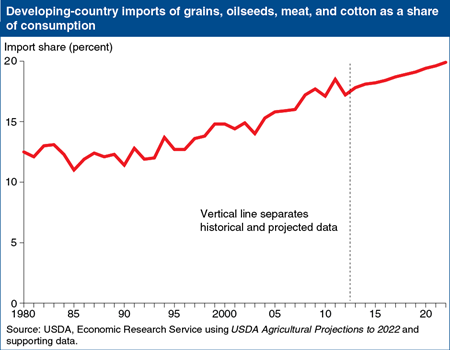
According to USDA?s baseline projections, developing-country demand for agricultural products is expected to increase faster than production in those countries, leading to continued growth in import demand. Developing countries are projected to account for 92 percent of the total increase in world meat imports, 92 percent of the increase in total grains and oilseeds imports, and nearly all of the increase in world cotton imports. The growth rate for developing-country consumption of total grains and oilseeds is projected to be about 17 percent faster than the rate for production. As a result, the gap between consumption and production will continue to widen, and these countries will become more import dependent. While these trends will create new opportunities for the United States to expand agricultural exports, they also present new challenges to U.S. exporters. Instead of a limited number of large importing countries, the global market now includes more countries with smaller import needs, requiring new marketing strategies by U.S. and other exporters. This chart can be found in Developing Countries Dominate World Demand for Agricultural Products in the August 2013 Amber Waves.
Thursday, August 8, 2013
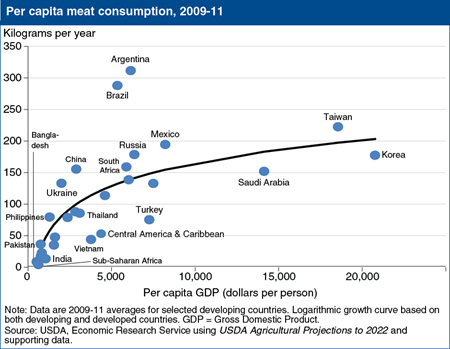
According to USDA’s baseline projections, developing countries will account for much of the increase in projected growth in global consumption of meats and crops in 2013-22. For meats—including beef, pork, and poultry—developing countries are projected to account for 81 percent of projected growth in global consumption and 92 percent of the total increase in world imports between 2013 and 2022. Rising incomes, along with urbanization and changes in consumer preferences, are key factors in both the historical and projected growth in meat demand and trade. As incomes rise, consumers in low- and middle-income countries not only buy more food but also tend to eat more varied diets, increasing their consumption of meat, dairy products, eggs, vegetable oils, and processed foods. Over the next decade, increases in meat consumption in developing countries are projected to average 2.4 percent annually, compared with 0.9 percent in developed countries. Per capita poultry meat consumption in developing countries is projected to rise 2.8 percent per year during 2013-22, much faster than that of pork (2.2 percent) and beef (1.9 percent). This chart can be found in "Developing Countries Dominate World Demand for Agricultural Products" in the August 2013 Amber Waves.
Monday, June 3, 2013
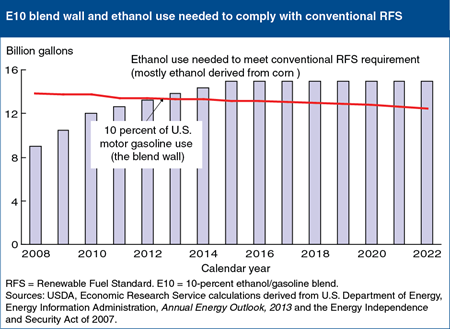
Declining use of gasoline in the United States, combined with market constraints to growth in the blending of biofuel, have resulted in U.S. ethanol use falling short of the Federal Renewable Fuel Standard (RFS), energy legislation that mandates minimum annual levels of biofuel consumption in the United States. Annual U.S. gasoline use has declined from its 142-billion-gallon peak in 2007 to about 133 billion gallons now, reducing the size of the existing U.S. market for ethanol. Nearly all retail gasoline sold in the United States is a 10-percent ethanol blend (E10). The limited ability to expand use of higher ethanol blends creates an effective constraint on total ethanol use at near 10 percent of total gasoline consumption—the E10 blend wall. As a result, ethanol use is falling short of the portion of the RFS mandate that can be met with corn-based ethanol. This gap is expected to widen in the future as gasoline consumption declines further and the RFS mandates higher levels of biofuel consumption. This chart appears in High RIN Prices Signal Constraints to U.S. Ethanol Expansion, Feed Outlook special article, April 2013.
Tuesday, May 7, 2013
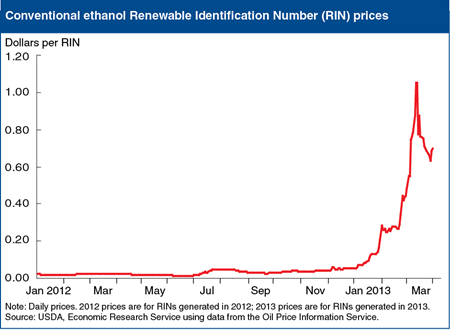
Renewable Identification Numbers (RINs) are codes assigned to batches of renewable fuel used to administer the federal Renewable Fuel Standard (RFS), which specifies minimum annual levels of U.S. biofuel consumption. Obligated parties under the RFS use RINs to report qualifying biofuel use to the U.S. Environmental Protection Agency to demonstrate compliance with their annual RFS requirements. After many years of relatively low prices for conventional ethanol RINs, those prices have recently risen sharply because RFS ethanol mandates now exceed ethanol use. This result reflects declining gasoline use and technical constraints on blending more than 10 percent ethanol in U.S. gasoline—the so-called E10 blend wall. The gap between ethanol mandates and ethanol use, together with the anticipated depletion of excess RINs from prior years, are driving up RIN prices. Additional factors that may be affecting RIN prices include uncertainties regarding potential regulatory and legislative actions. This chart appears in “High RIN Prices Signal Constraints to U.S. Ethanol Expansion,” in Feed Outlook: April 2013 (pages 18-22).
Monday, March 11, 2013
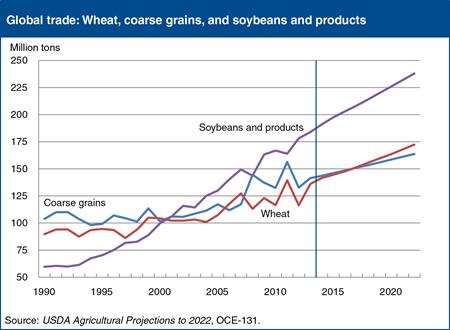
Rising incomes, particularly in developing countries, are projected to provide a foundation for continued gains in world demand and trade for grains, oilseeds, and other agricultural products during 2012-22. Developing countries, where food consumption and feed use are particularly responsive to income growth, are projected to be the main source of growth in import demand for grains and oilseeds. Trade in soybeans and soybean products has risen rapidly since the early 1990s, and continued strong demand, particularly in China and other Asian countries, is expected during the next decade. Growth in global wheat imports also remains concentrated in developing countries, but per capita wheat use has peaked in many countries, leading to more modest projected growth in wheat trade. These projections are based on a conditional, longrun scenario that assumes normal weather, a continuation of current U.S. farm legislation, and specific U.S. and international macroeconomic conditions and U.S. and foreign agricultural and trade policies. This chart is from USDA Agricultural Projections to 2022, OCE-131, February 2013.


