ERS Charts of Note
Subscribe to get highlights from our current and past research, Monday through Friday, or see our privacy policy.
Get the latest charts via email, or on our mobile app for  and
and 
Friday, February 1, 2013
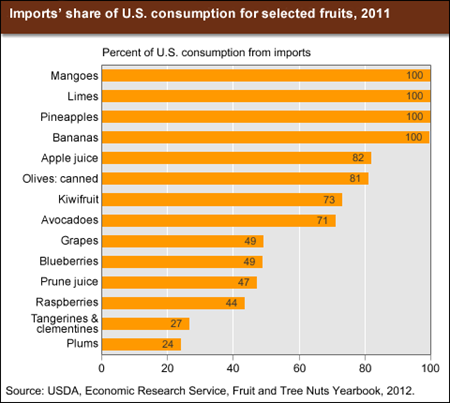
While the United States is one of the largest world producers of fruits and nuts, imports accounted for about 38 percent of the volume of U.S. consumption of fresh, processed, and frozen fruits and tree nuts in 2011. Imports account for important shares of U.S. consumption when products—primarily tropical products—cannot be produced in sufficient quantities domestically, or when imports can complement the seasonality of U.S. production. Bananas, pineapples, mangoes, and limes are examples of major tropical product imports, while grapes, plums, and blueberries are examples of important seasonal imports. Still other imports, such as clementines and raspberries, compete directly with U.S. products. Over the past decade, U.S. edible fruit and nut imports rose dramatically in value due to the growing demand for offseason fruit, an expanding ethnic population, and the interest of consumers in sampling new temperate and tropical fruits. Mexico and Chile dominate U.S. fruit imports, with a combined share of about 40 percent of the U.S. import value in 2011. This chart is updated from one that appears in Fruit and Tree Nut Outlook, December 2012.
Tuesday, January 29, 2013
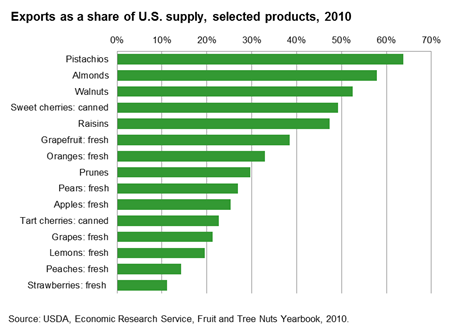
The United States exports a wide variety of fresh and processed fruit and tree nut products, with exports accounting for significant shares of U.S. supplies. For example, more than half of U.S. supplies of pistachios, almonds, and walnuts, and between 30 and 40 percent of U.S. fresh orange and grapefruit supplies, are exported. In terms of value, the leading fresh fruit exports are apples (exports averaging $772 million in 2008-10), grapes ($609 million), and oranges ($463 million). Major U.S. processed fruit exports include frozen and other orange juice ($383 million) and raisins ($304 million). The United States trails only China in production of tree nuts but is the world’s largest exporter, trading nearly a third of the world’s tree nuts. By value, almonds are the leading U.S. horticultural export commodity ($2.0 billion), with the United States accounting for nearly 75 percent of world almond exports in 2010. Other important tree nut exports include walnuts ($659 million) and pistachios ($572 million). In 2008-10, Hong Kong and China purchased 17 percent of U.S. tree nut exports, followed by Canada (5 percent) and Korea (3 percent). This chart appears in Fruit and Tree Nuts Outlook, FTS-354, December 18, 2012.
Wednesday, December 26, 2012
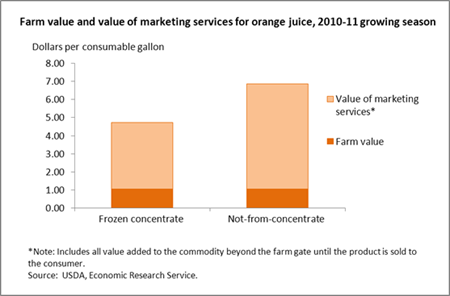
In 2010, Americans consumed 3.4 gallons of orange juice per person. While some families may have squeezed their own, most probably chose other options for their at-home consumption of orange juice, including purchasing frozen concentrated juice to be mixed with water, or ready-to-drink, not from concentrate (NFC) juice. Greater costs for marketing services like packaging and transportation for NFC juices show up in their higher retail prices. For the 2010-11 growing season, NFC orange juice sold in retail stores for $6.86 per gallon, on average, and frozen concentrate for $4.73 per gallon when reconstituted. While the amount of value-adding services is higher for NFC juice, the farm value of fresh Florida oranges used in both types of juice is the same--$1.04 per gallon in 2010-11. Thus, the farm share of retail price is higher for frozen concentrated orange juice. In 2010-11, the farm share was 22 percent for frozen concentrate, compared to 15 percent for NFC. This chart is based on ERS’s farm share statistics found in the Price Spreads from Farm to Consumer data product, updated November 2012.
Tuesday, December 18, 2012
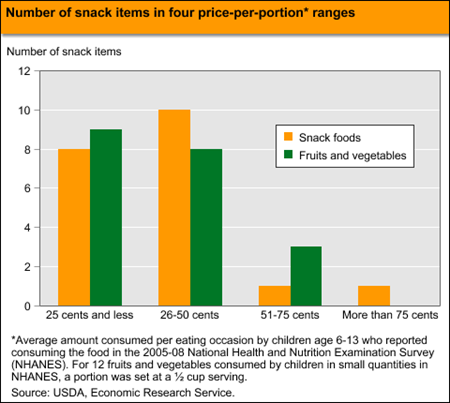
Replacing calorie-dense snack foods with calorie-sparse fruits and vegetables can be one step in addressing childhood obesity and does not have to compromise a family’s food budget. An ERS analysis of prices per portion for 20 common snack foods and 20 potential fruit and vegetable substitutes found that 9 of the 20 fruits and vegetables and 8 of the 20 snack foods cost 25 cents per portion or less; an additional 8 fruits and vegetables and 10 snack foods cost between 26 and 50 cents per portion. On average, the 20 fruits and vegetables cost 31 cents per portion and the 20 snack foods cost 33 cents per portion. A household making all possible 400 substitutions between the 20 snack foods and the 20 fruits and vegetables would save an average of 2 cents and 126 calories per swap. The statistics in this chart are from "Gobbling Up Snacks: Cause or Potential Cure for Childhood Obesity?" in the December 2012 issue of ERS’ Amber Waves magazine.
Friday, October 19, 2012
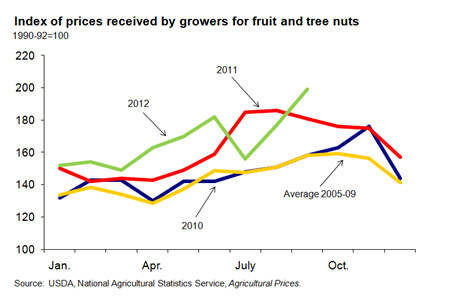
The index of prices received by fruit and tree nut growers in September rose above year-ago levels after falling behind in July and August of this year. At 199 (1990-92=100), the index reported in September increased 18 percent from the September 2011 index. Despite a significant decline in fresh lemon prices, grower price increases for fresh grapefruit, oranges, apples, grapes, peaches, pears, and strawberries in September boosted this year's September index. Unfavorable weather this growing season reduced production of most these crops, driving up their prices. Consumer prices for fresh fruit, however, declined 1 percent relative to last year. This chart updates the version from the Fruit and Tree Nut Outlook, FTS-353, September 2012.
Monday, September 10, 2012
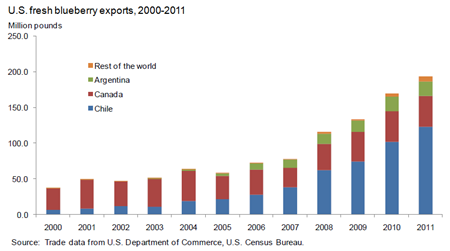
More than half of U.S. blueberries cater to the domestic market, but U.S. fresh blueberry exports have been increasing in the last decade. With fairly steady increases over the past 10 years, the U.S. blueberry industry achieved a record-breaking fresh-market export volume in 2011 of 78.5 million pounds, valued at $376 million. Export volume in 2011 relative to the previous year increased 21 percent to Chile but declined 2 percent to Canada. Chile has replaced Canada as the top export destination for U.S. fresh blueberries since 2007, averaging around 60 percent of total export volume in the past three years. Though still relatively small in comparison to Chile and Canada, Argentina has emerged as an important market for U.S. blueberries, with its share of total export volume climbing from a 2-percent average during the early 2000s to around 12 percent in recent years. This chart comes from the Fruit and Tree Nut Outlook, FTS-352, June 2012.
Thursday, August 2, 2012
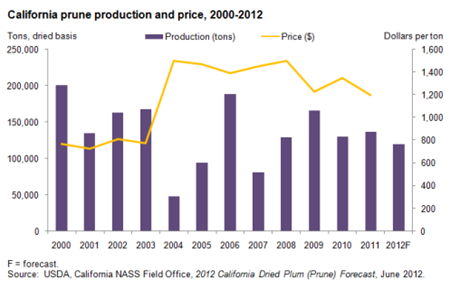
California dominates U.S. prune production with virtually all of its production destined for the processing sector—mostly to dried fruit processors. The California prune crop for 2012 is forecast at 120,000 dry tons, down 12 percent from the 2011 revised estimate of 137,000 tons and 15 percent smaller than the 2008-10 average crop size. In 2007, however, the crop totaled only 83,000 tons and in 2004, even smaller at 48,000 tons. Bearing acreage continues to decline for the third consecutive year in 2012 and the average yield per acre, at 2.18 dry tons, is 8 percent below the yield last year, reducing total crop size. As grower prices from 2009 to 2011 continued to fall below the 2008 average high of $1,500 per ton, prune trees were pulled after the 2011 harvest, reducing bearing acreage in 2012 to 55,000 acres, down 5 percent from a year ago. This chart comes from the Fruit and Tree Nut Outlook, FTS-352, June 2012.
Tuesday, July 3, 2012
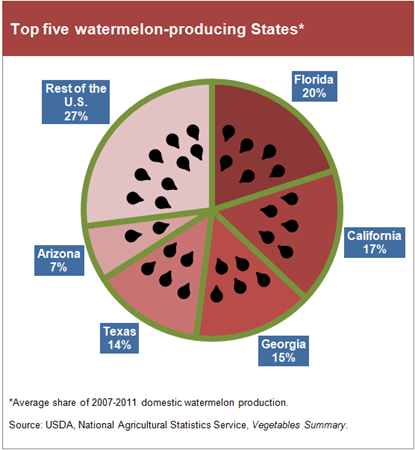
Watermelons are grown all across the United States, but require up to a 3-month-long growing season with consistently warm temperatures of 70-90 degrees Fahrenheit. Consequently, most commercial production is limited to the South and Southwest. From 2000-09, the U.S. saw overall yields increase an average of 42 percent and acreage decrease an average of 27 percent from the 1990s. Most of the top producing States, such as California and Texas, have followed the national trend of rising yields and declining acreage over the past decade. On the other hand, Florida recently saw a declining trend in yields coupled with a slight increase in number of acres harvested between 2006 and 2010. The data for this chart come from the Fruit and Tree Nut Outlook, FTS-352, June 2012.
Wednesday, June 20, 2012
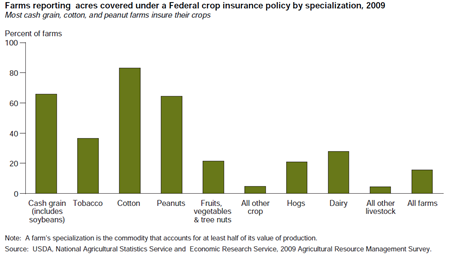
Most farms specializing in cash grains, cotton, and peanuts reported farmland covered under a Federal crop insurance policy in the 2009 Agricultural Resource Management Survey. Farms with other specializations participated in Federal crop insurance, but to a lesser degree. About a third of tobacco farms had insured land, as well as 20 to 30 percent of farms specializing in hogs, dairy, or fruits, vegetables, and tree nuts. Hog and dairy farms often grow crops to feed their livestock, and these crops are eligible for Federal crop insurance. This chart is found in Changing Farm Structure and the Distribution of Farm Payments and Federal Crop Insurance, EIB-91, February 2012.
Monday, April 23, 2012
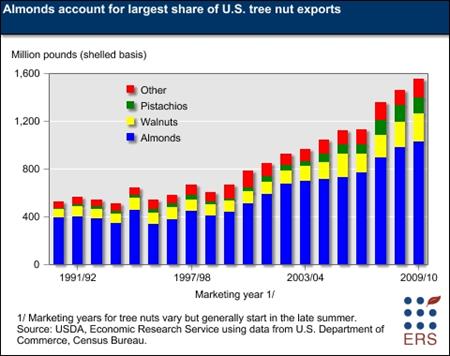
The United States leads the world in the production and export of tree nuts-producing more than one-tenth of the world's tree nuts and accounting for about a quarter of world exports. Over 45 percent of U.S. tree nut supplies were exported during the 2000s, on average. Almonds have accounted for nearly 70 percent of tree nut export volume in recent years, followed by walnuts (accounting for over 10 percent) and pistachios (about 9 percent). The major export destinations for U.S. tree nuts are Spain, Germany, and the Netherlands in the European Union; Canada and Mexico; and Hong Kong, Japan, India, China, South Korea, Vietnam, and Taiwan in Asia. This chart is found in the Fruit and Tree Nuts topic on the ERS website, updated February 2011.
Monday, April 16, 2012
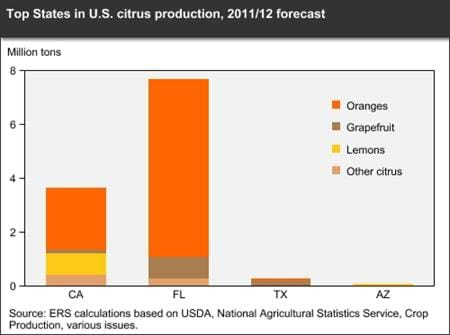
Although orange production is forecast higher in 2011/12, decreases in all other citrus categories are expected to bring total production down, to 11.6 million tons from the previous season's 11.7 million tons. At 2.3 million tons, California's orange production is forecast down from the 2010/11 season due to an 8-percent smaller navel crop. Florida's 2011/12 orange crop is forecast at 6.6 million tons, up 5 percent from last season. California's lemon harvest is forecast down 7 percent and a freeze in Arizona that caused significant damage to the lemon crop is expected to result in a 72-percent decline in lemon production there. Imported lemons, mostly from Mexico, are helping shore up lower domestic production. This chart is based on data from Table 3 in the March 2012 Fruit and Tree Nuts Outlook, FTS-351.
Friday, April 13, 2012
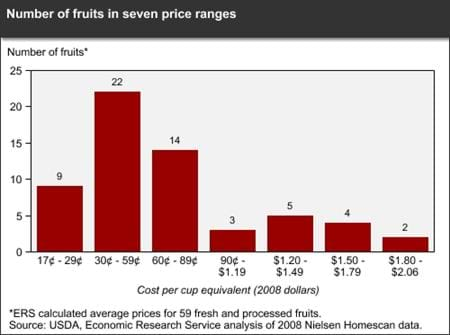
If your grandmother has told you, "An apple a day, keeps the doctor away," how much will it cost to follow her advice? ERS calculated average prices paid in 2008 for 59 fresh and processed fruits measured in cup equivalents. A cup equivalent is the edible portion that will generally fit in a 1-cup measuring cup; 1/2 cup for raisins and other dried fruits. The actual amount of fruits a person should eat per day depends on age, gender, and level of activity. For a 2,000-calorie diet, 2 cup equivalents of fruits per day is recommended. Fresh watermelon at 17 cents per cup equivalent and apple juice (made from concentrate) at 20 cents were the lowest priced fruits, while raspberries (fresh and frozen) and fresh blackberries were the priciest. Thirty-one fruits cost less than 60 cents per cup equivalent. And that apple, 28 cents per cup equivalent. The data in this chart are from ERS's Fruit and Vegetable Prices data product on the ERS website, updated February 2011.
Tuesday, March 6, 2012
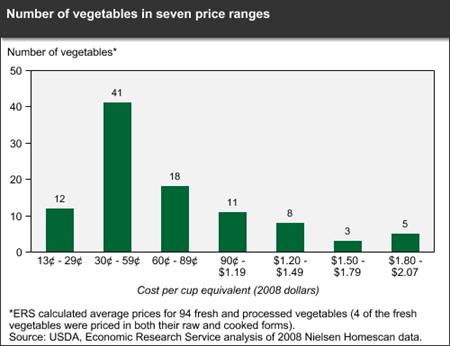
Eating a variety and sufficient quantity of vegetables is an important component of a healthy diet. But is price a barrier? ERS estimated average prices paid in 2008 for 94 fresh and processed vegetables (including beans and peas) measured in cup equivalents. A cup equivalent is the edible portion that will generally fit in a 1-cup measuring cup; 2 cups for lettuce and other raw leafy greens. The actual amount of vegetables a person should eat per day depends on age, gender, and level of activity. For example, for a 2,000-calorie diet, 2 and 1/2 cup equivalents of vegetables per day is recommended. ERS researchers found that fresh iceberg lettuce, fresh whole carrots, dried pinto beans, and 9 other products cost less than 30 cents per cup equivalent, while 41 vegetables, including fresh romaine lettuce, baby carrots, and canned tomatoes, cost between 30 and 59 cents per cup equivalent. The data in this chart are from ERS's Fruit and Vegetable Prices data product on the ERS website, updated February 2011.
Monday, January 30, 2012
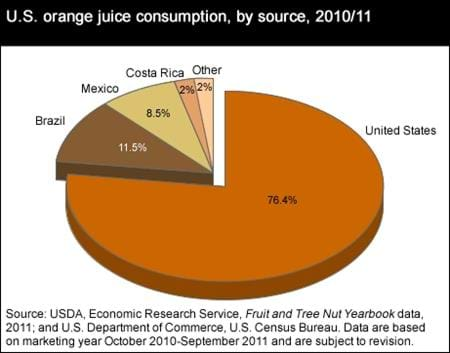
Orange juice represents only a small portion of the fruit and tree nut imports that the United States consumes every year, but imports represented roughly one-quarter of the orange juice the Nation consumed domestically during the 2010-11 marketing year. The leading source of imported orange juice was Brazil, providing nearly 12 percent of U.S. consumption, while nearly 9 percent of domestically consumed orange juice came from Mexico. The data for this chart come from USDA, Economic Research Service, Fruit and Tree Nut Yearbook data, 2011; and U.S. Department of Commerce, U.S. Census Bureau.
Wednesday, October 19, 2011
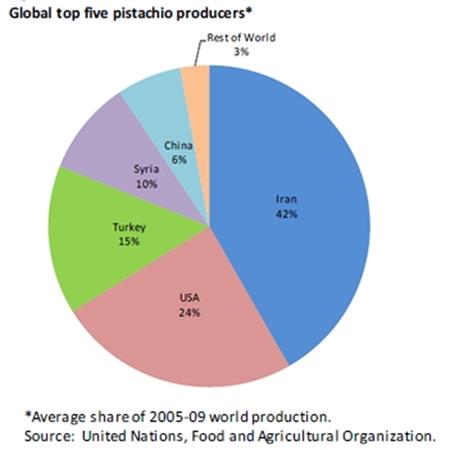
Since 1977, U.S. pistachio production has increased rapidly, starting at 1.8 million pounds (shelled basis) to 250.1 million pounds in 2010-a recordbreaking harvest. The rapid growth in U.S. pistachio production has made it the second largest producer in the world, after Iran. From 2005 to 2009, Iran provided 42 percent of the world total and the United States provided 24 percent. Previously the average of 1998-2001 world production had the U.S. producing 20 percent. Since then, the United States has increased its share of global production as have Turkey and Syria, while Iran has seen a decline in average production. This chart comes from the September 30, 2011 Fruit and Tree Nut Outlook, FTS-349.
Friday, August 26, 2011
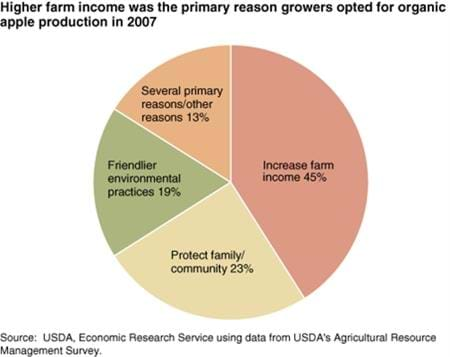
Apple growers indicated a variety of reasons for choosing to farm organically in 2007, including prospects for increased farm income. Conventional apple yields were higher than organic yields in 2007. However, organic apples-whether for fresh consumption or processing-commanded substantial price premiums. Grower prices for organic apples were more than double conventional prices for fresh apples and nearly double conventional prices for processing apples. This chart is found in the September 2011 issue of Amber Waves magazine.
Wednesday, August 10, 2011
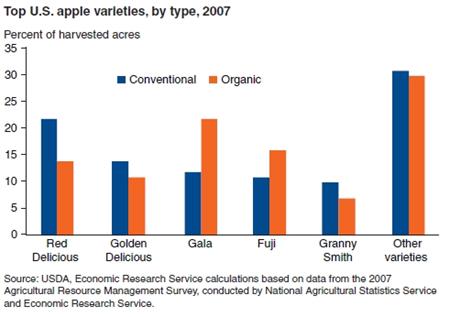
Data from the 2007 Agricultural Resource Management Survey show that the top five apple varieties-Red Delicious, Golden Delicious, Gala, Fuji, and Granny Smith-were the same in conventional and organic production, although the order differed between the two production systems. These five varieties accounted for over two-thirds of conventional and organic apple production in the surveyed States. Red Delicious, Gala, and Fuji are primarily fresh-market apples, while Golden Delicious and Granny Smith are "dual-purpose" apples that can be used in either fresh or processing markets. The top three varieties used by organic producers-Gala, Fuji, and Red Delicious-are all fresh-market apples, reflecting this sector's concentration in fresh-market production. This graph comes from Characteristics of Conventional and Organic Apple Production in the United States, FTS-347-01, July 2011.
Monday, August 8, 2011
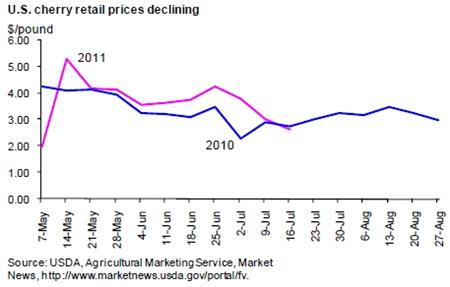
Despite the late start to this year's U.S. sweet cherry season, retailers will find plenty of promotional volumes for good quality cherries this summer, likely driving U.S. consumer prices for cherries down from a year ago during the latter half of the season. Retail advertised prices for U.S. cherries at the beginning of this season in May averaged $3.91 per pound, 5 percent below the May 2010 average price. While weekly average prices were higher than a year ago throughout most of May, sharply lower prices during the first week of the month drove the monthly average down. Heavy volume buildup from mid-July through mid-August is expected to put downward pressure on prices. This chart is from ERS' Fruit and Tree Nuts Outlook, FTS-348, published July 29, 2011.
Wednesday, August 3, 2011
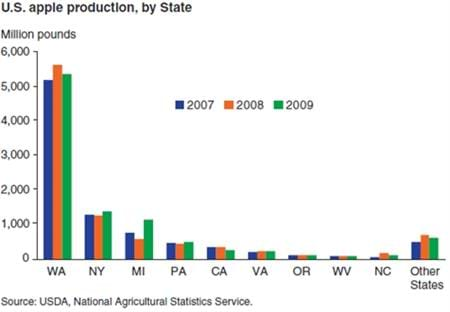
Washington State currently produces over half the Nation's domestically grown apples and has been the leading apple-growing State since the early 1920s. In 2009, Washington State produced 5.4 billion pounds of apples. New York and Michigan produced over 1 billion pounds each. Apple production has been somewhat stable in Washington State, New York, and Michigan since the 1990s, but production in many other States has declined.This graph comes from Characteristics of Conventional and Organic Apple Production in the United States, FTS-347-01, July 2011.
Monday, June 27, 2011
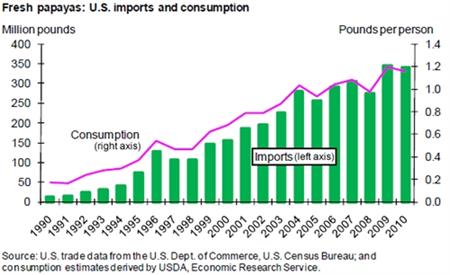
Imports play a crucial role in serving the growing market for papayas in the United States. Domestic production, which is concentrated in Hawaii, is relatively small and contracting. The number of farms growing papayas in Hawaii declined from 206 in 2001 to 177 in 2010 and production area fell from 2,720 acres to 1,250 acres. Imports, on the other hand, grew annually at an average rate of 9 percent during the same 10-year period, increasing from 186.1 million pounds to a record 344.8 million pounds in 2009. Imports fell slightly to 339.3 million pounds in 2010. With the growth in imports, fresh papaya per capita consumption in the United States grew more than 50 percent over this 10-year period, reaching an estimated 1.20 pounds in 2009-an all-time high. This chart appeared in the ERS report, Fruit and Tree Nuts Outlook, FTS-347, May 2011.


