ERS Charts of Note
Subscribe to get highlights from our current and past research, Monday through Friday, or see our privacy policy.
Get the latest charts via email, or on our mobile app for  and
and 
Friday, June 1, 2012
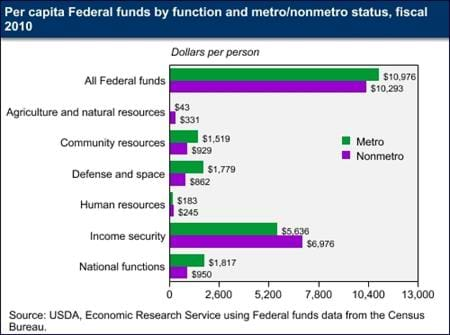
On average, the U.S. Government allocated $10,864 per person in Federal funds during the 2010 fiscal year. Federal programs specifically aimed at community resource issues (including public infrastructure, business assistance, and housing) are often considered central to rural development. ERS analysis finds that rural (nonmetropolitan) areas have historically received somewhat less community resources funding per capita than urban areas. Examining the data at a regional level indicates that the West is the only region where rural areas receive more Federal funds per capita than urban areas. Across the U.S., rural areas tend to receive more per capita funding in support of agriculture and natural resources, human resources (such as education, health/nutrition, job training/employment, and social services), and income security than urban areas. The data that support this chart are found in the Federal Funds data product on the ERS website, updated December 2011.
Thursday, April 19, 2012
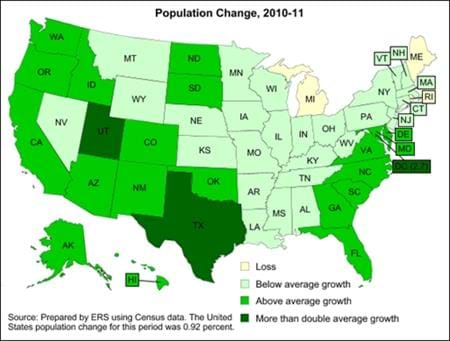
Recently released data from the Census Bureau show that the annual rate of U.S. population growth has slowed to 0.92 percent. Three States registered population loss in 2010-11: Rhode Island, Michigan, and Maine. Washington, North Dakota, Colorado, Alaska, Utah, and Texas all had growth rates over 1.5 percent. Washington D.C. topped the list with 2.7 percent population growth in 2010-11. This map is from County-Level Population Data on the ERS website, updated April 13, 2012.
Friday, February 10, 2012
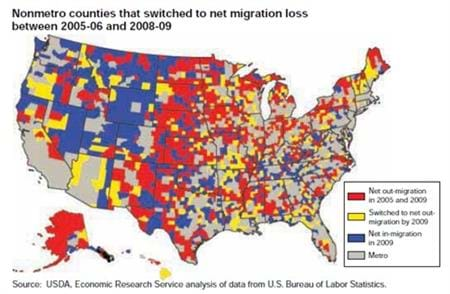
The percentage of Americans moving between counties dropped to historic lows between 2006 and 2009, reducing the rate of population growth throughout rural and small-town America, especially in areas that had previously been attracting large numbers of new residents (in-migrants). The change reflected a constellation of developments that inhibited retirement migration and other discretionary moves: a decline in wealth as home values and stock market values fell; the increased difficulty of financing home purchases in the wake of the mortgage crisis; a decline in speculative real estate construction; and falling incomes and declining job opportunities as the economy moved into recession. Between July 2008 and July 2009, the nonmetro population grew by 91,000, just a third of the population that was added during the corresponding 2005-06 period. Between 2005-06 and 2008-09, the number of nonmetro counties losing population rose from 995 to 1,123. Much of that population loss occurred in suburbanizing counties adjacent to metro areas, as well as in counties with scenic amenities. This map is found in the 2010 edition of Rural America At A Glance, EIB-68, September 2010.
Monday, December 5, 2011
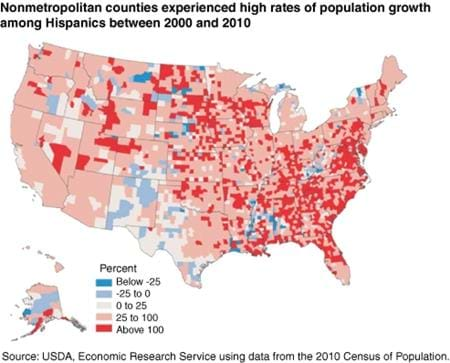
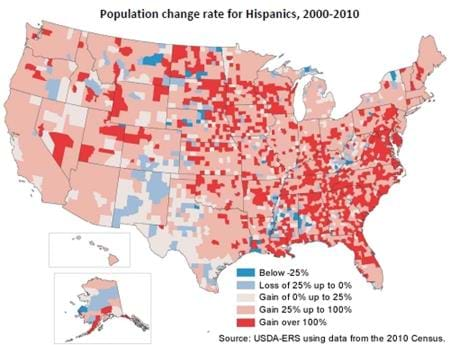
While the overall nonmetro population grew 4.5 percent in the 2000s, the nonmetro Hispanic population increased 45 percent. And Hispanic population growth was not confined to areas with large Hispanic concentrations in the Southwest. On a percentage basis, growth was significantly higher throughout much of the Southeast, Midwest, and Northwest. Hispanic populations more than doubled in most nonmetro counties in the South and in many otherwise slow-growing or declining sections of the Nation's Heartland. In 228 nonmetro counties, overall population loss was avoided because Hispanic population growth more than offset non-Hispanic population decline. This map is found in the December 2011 issue of Amber Waves magazine.
Friday, August 5, 2011
Hispanic populations more than doubled in most nonmetro counties in the South and in many otherwise slow-growing or declining sections of the Nation's Heartland. Much of this growth is fueled by demand for low-skill food-processing and manufacturing workers, but expanding service-sector jobs are also attracting Hispanics into many high-amenity areas in the West and elsewhere. This map can be found in the Atlas of Rural and Small Town America on the ERS website, updated June 29, 2011.
Wednesday, August 3, 2011
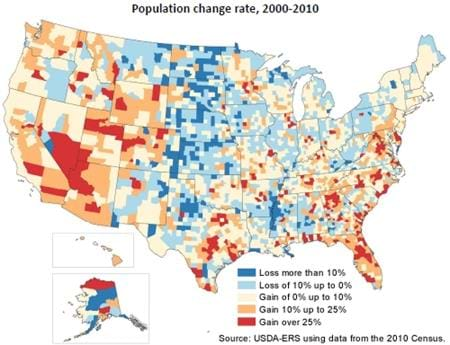
Persistent outmigration of youth and natural decrease (an excess of deaths over births) fuel severe population loss throughout the Great Plains and in the Mississippi Delta; suburban expansion and amenity-based migration explain rapid population growth in the South and West. This map can be found in the Atlas of Rural and Small Town America on the ERS website, updated June 29, 2011.
Wednesday, June 1, 2011
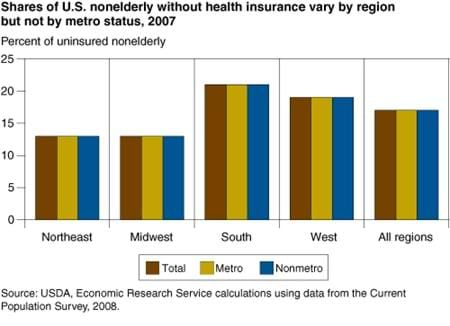
About 17 percent of all nonelderly individuals nationwide lack health insurance. Coverage rates are comparable for metro and nonmetro residents. (Because Medicare coverage starts at age 65, only a very small share of the elderly is uninsured.) Nonmetro coverage was lower as recently as the 1990s, and individuals in the more remote (noncore) counties still have lower coverage than urban residents. However, regional location appears to have more impact than rurality, with the Northeast and Midwest having consistently higher rates of health insurance coverage than the South and the West. This chart appeared in the September 2009 issue of Amber Waves.
Thursday, May 26, 2011
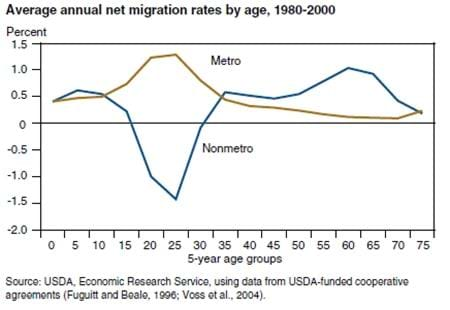
Nonmetro population loss from net migration is heavily concentrated among young adults, beginning with high school graduation. Urban destinations draw young singles seeking jobs, affordable rental housing, social opportunities, and creative cultural environments. Rural migration is highest early in the retirement process and declines sharply as physical activity becomes more limited and health care needs increase. The oldest baby boomers turn 74 years old in 2020 and, if long-term migration patterns persist, will be less likely to make moves to rural settings, will be more likely to move back to metro areas, and often will move to be closer to caretaker relatives. This chart appeared in the report, Baby Boom Migration and Its Impact on Rural America, ERR-79, August 2009.
Friday, April 29, 2011
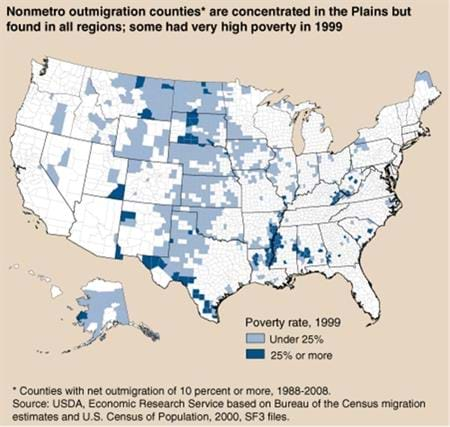
High net outmigration might be expected in areas with above-average poverty rates, since poverty suggests a lack of economic opportunity. The working-age population in particular is likely to react to economic opportunity in deciding where to live. In 1988-2008, however, this relationship held only in counties with poverty rates above 25 percent. While 60 percent of these "high-poverty" counties had high net outmigration, poverty rates below 25 percent had no apparent relevance, indicating that different factors underlie high net outmigration in most nonmetro areas. This map appeared in the December 2010 issue of Amber Waves magazine.
Monday, November 18, 2019
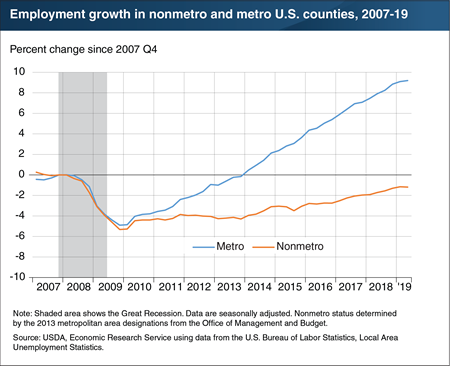
Employment in both nonmetro and metro counties fell by 5 percent between the end of 2007 and the end of 2009, reflecting the effects of the Great Recession. Since then, however, employment growth in rural areas has fallen behind metro employment growth. Between 2010 and 2018, nonmetro employment grew at an average annual rate of 0.4 percent, compared to 1.5 percent per year in metro areas. By the second quarter of 2019, nonmetro employment still remained more than 1 percent below the pre-recession level, while metro employment exceeded the pre-recession level by more than 9 percent. These differences in employment growth rates between nonmetro and metro areas may be related in part to differences in population growth. The slowest employment growth occurred in the same areas that had negative population growth—i.e., nonmetro counties with an urban population of less than 20,000. Employment growth since 2010 was faster than population growth in all groups of counties, indicating that a rising share of the population was employed. This chart appears in the November 2019 ERS report, Rural America at a Glance, 2019 Edition.


