
Population change for Hispanics, 2000-2010
- by Economic Research Service
- 8/5/2011
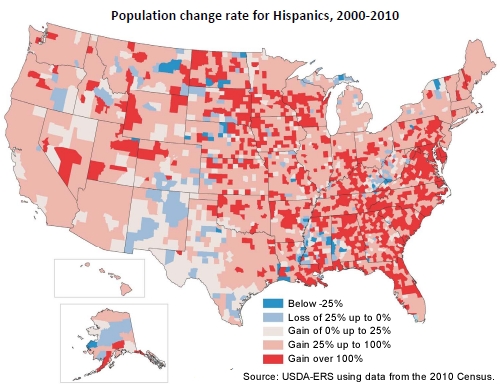
Hispanic populations more than doubled in most nonmetro counties in the South and in many otherwise slow-growing or declining sections of the Nation's Heartland. Much of this growth is fueled by demand for low-skill food-processing and manufacturing workers, but expanding service-sector jobs are also attracting Hispanics into many high-amenity areas in the West and elsewhere. This map can be found in the Atlas of Rural and Small Town America on the ERS website, updated June 29, 2011.