After a decade of population loss in the 2010s, the population in nonmetropolitan (nonmetro) areas has increased each year since 2020. The growth is from migration, which has offset a population loss in nonmetro areas caused by more deaths than births. Between 2020 and 2021, 92 percent of net migration to nonmetro counties was domestic (within the United States). However, between 2021 and 2024, domestic net migration decreased while international migration increased in nonmetro counties. About half (48 percent) of net migration gains in nonmetro counties between 2023 and 2024 were because of international migration. ERS tracks demographic changes in nonmetro areas and conducts research to help explain the relationship between population changes and the well-being of rural and small-town residents. This page summarizes key trends in the nonmetro population change:
Population Growth and Decline
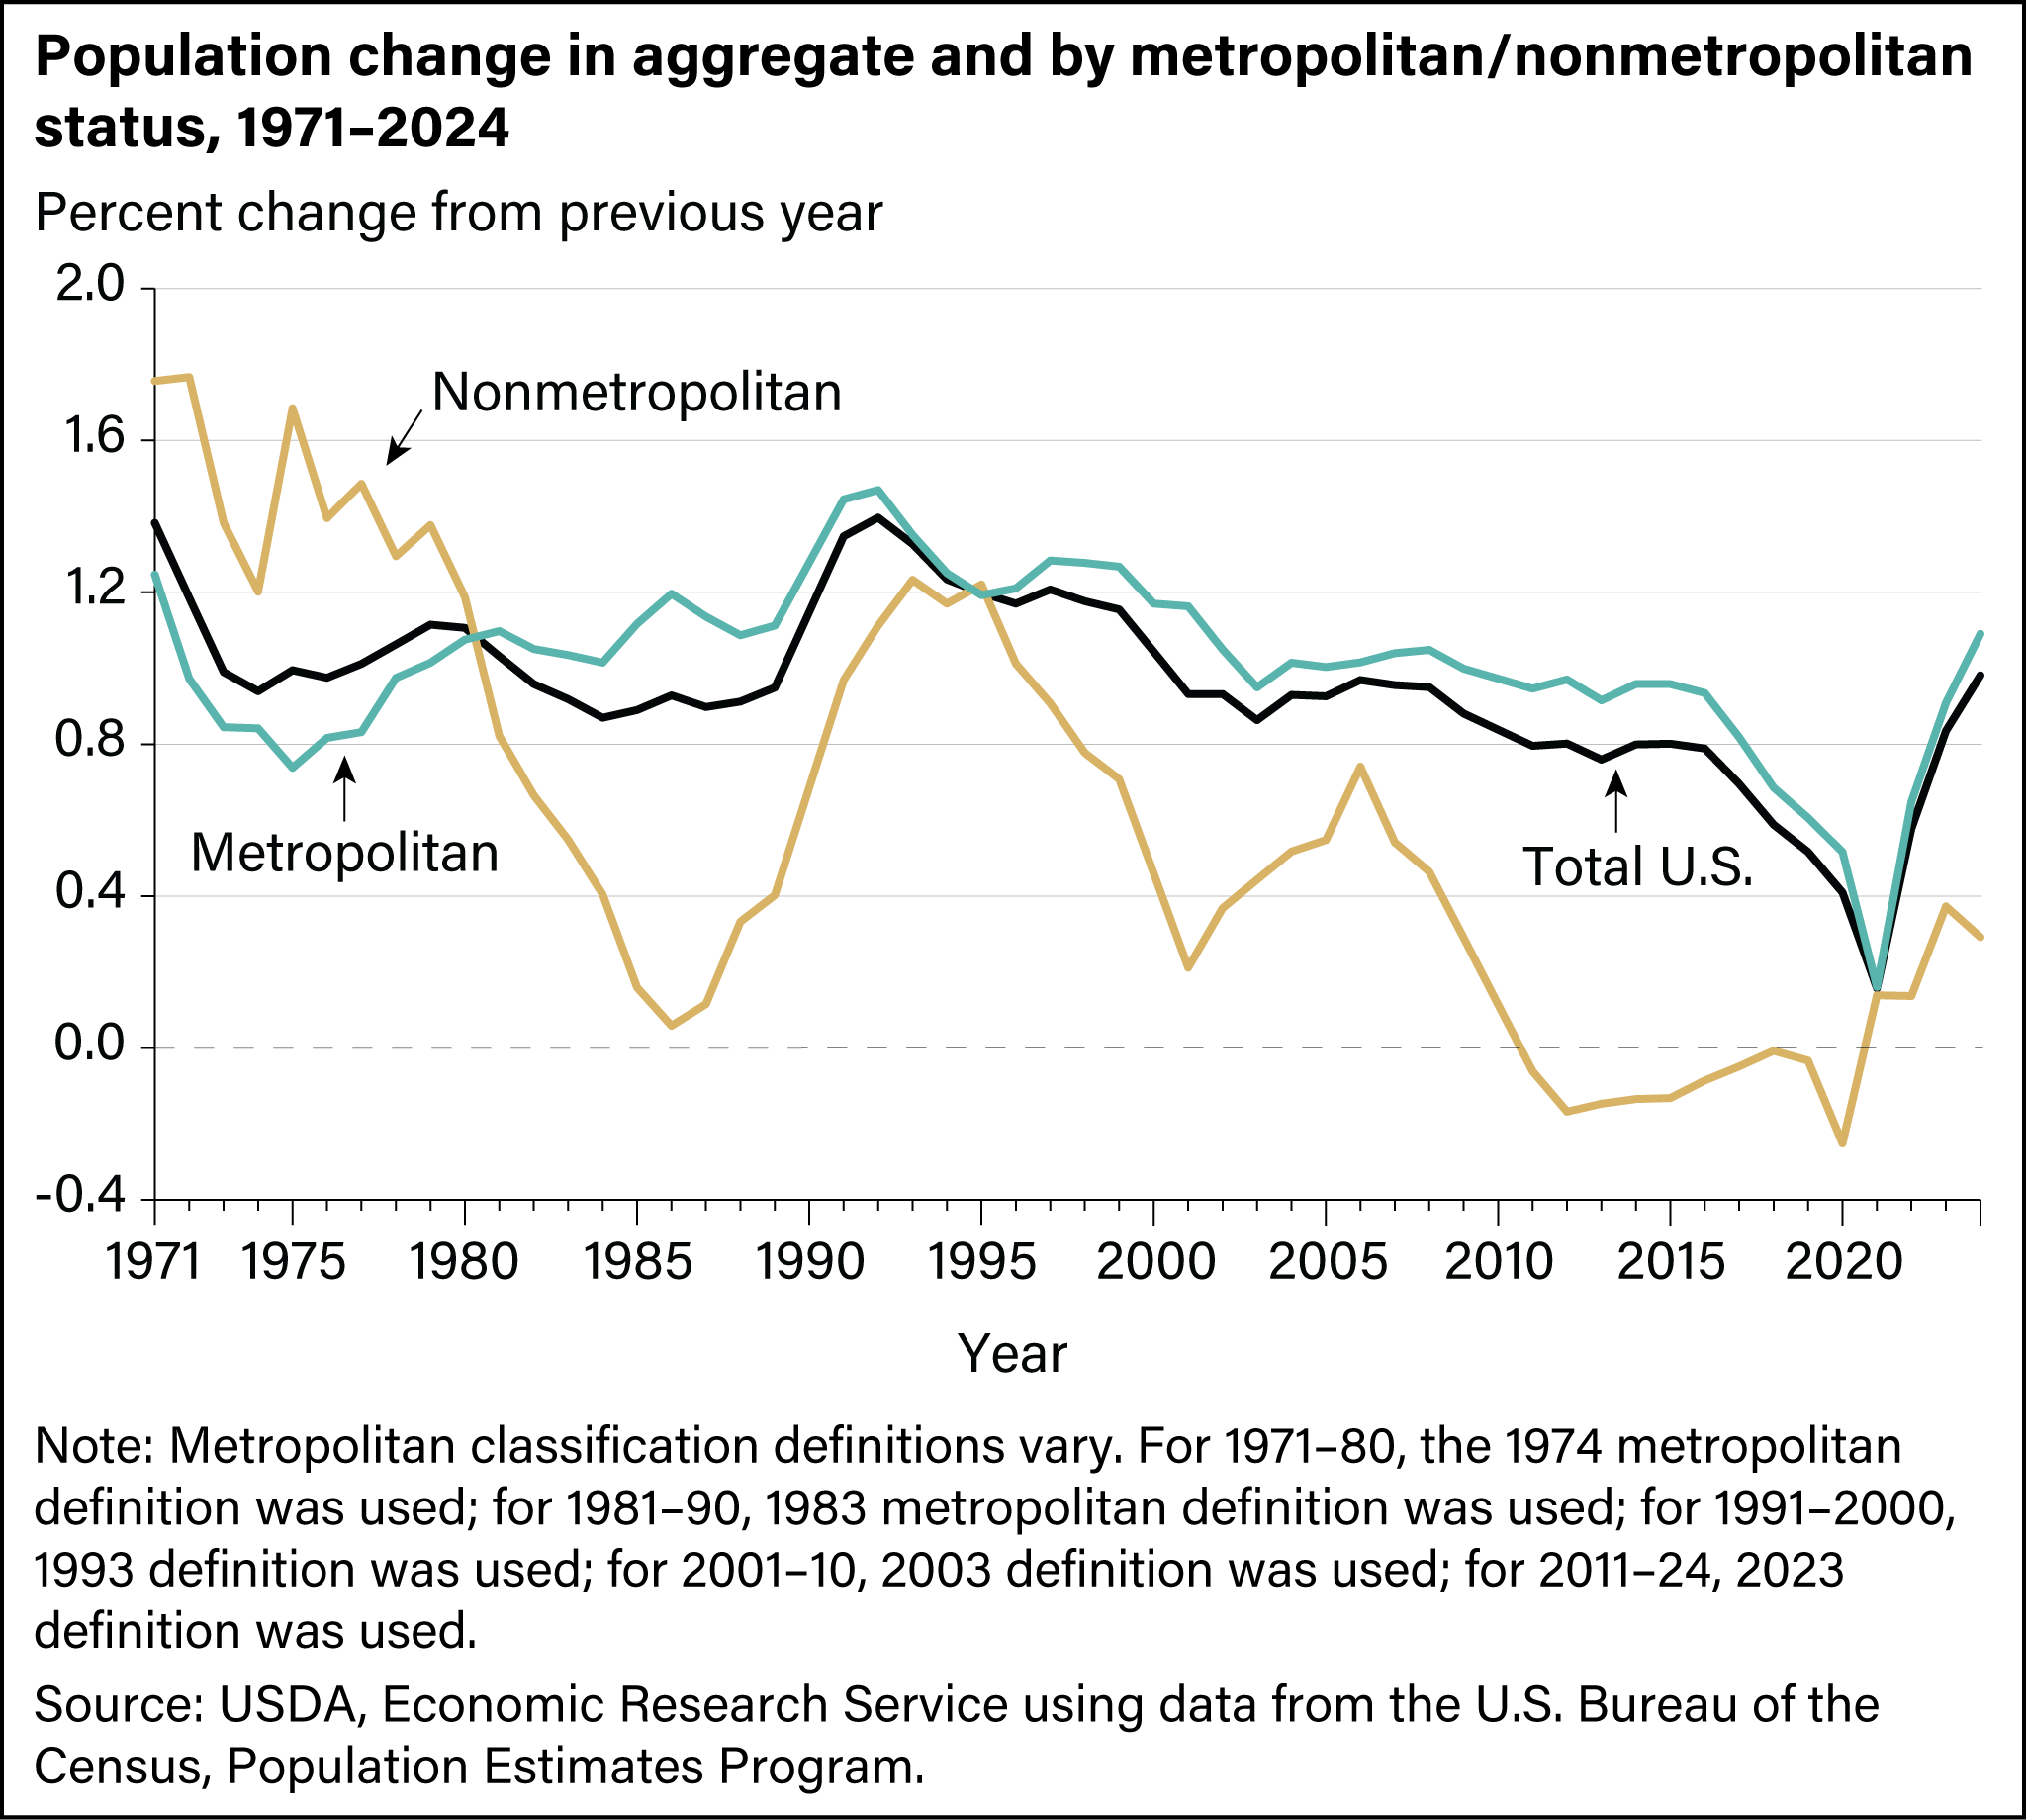
The total U.S. population in nonmetro counties stood at 46.2 million in July 2024. It constitutes 14 percent of U.S. residents spread across 72 percent of the nation's land area. The number of people living in nonmetro counties increased by 134,540 (0.29 percent) between 2023 and 2024. Still, the population in metropolitan (metro) areas continues to grow faster (1.1 percent). The metro and nonmetro growth rates were similar in 2020–21 during the height of the COVID-19 pandemic but the difference in growth rates has widened again.
Download chart image | Chart data
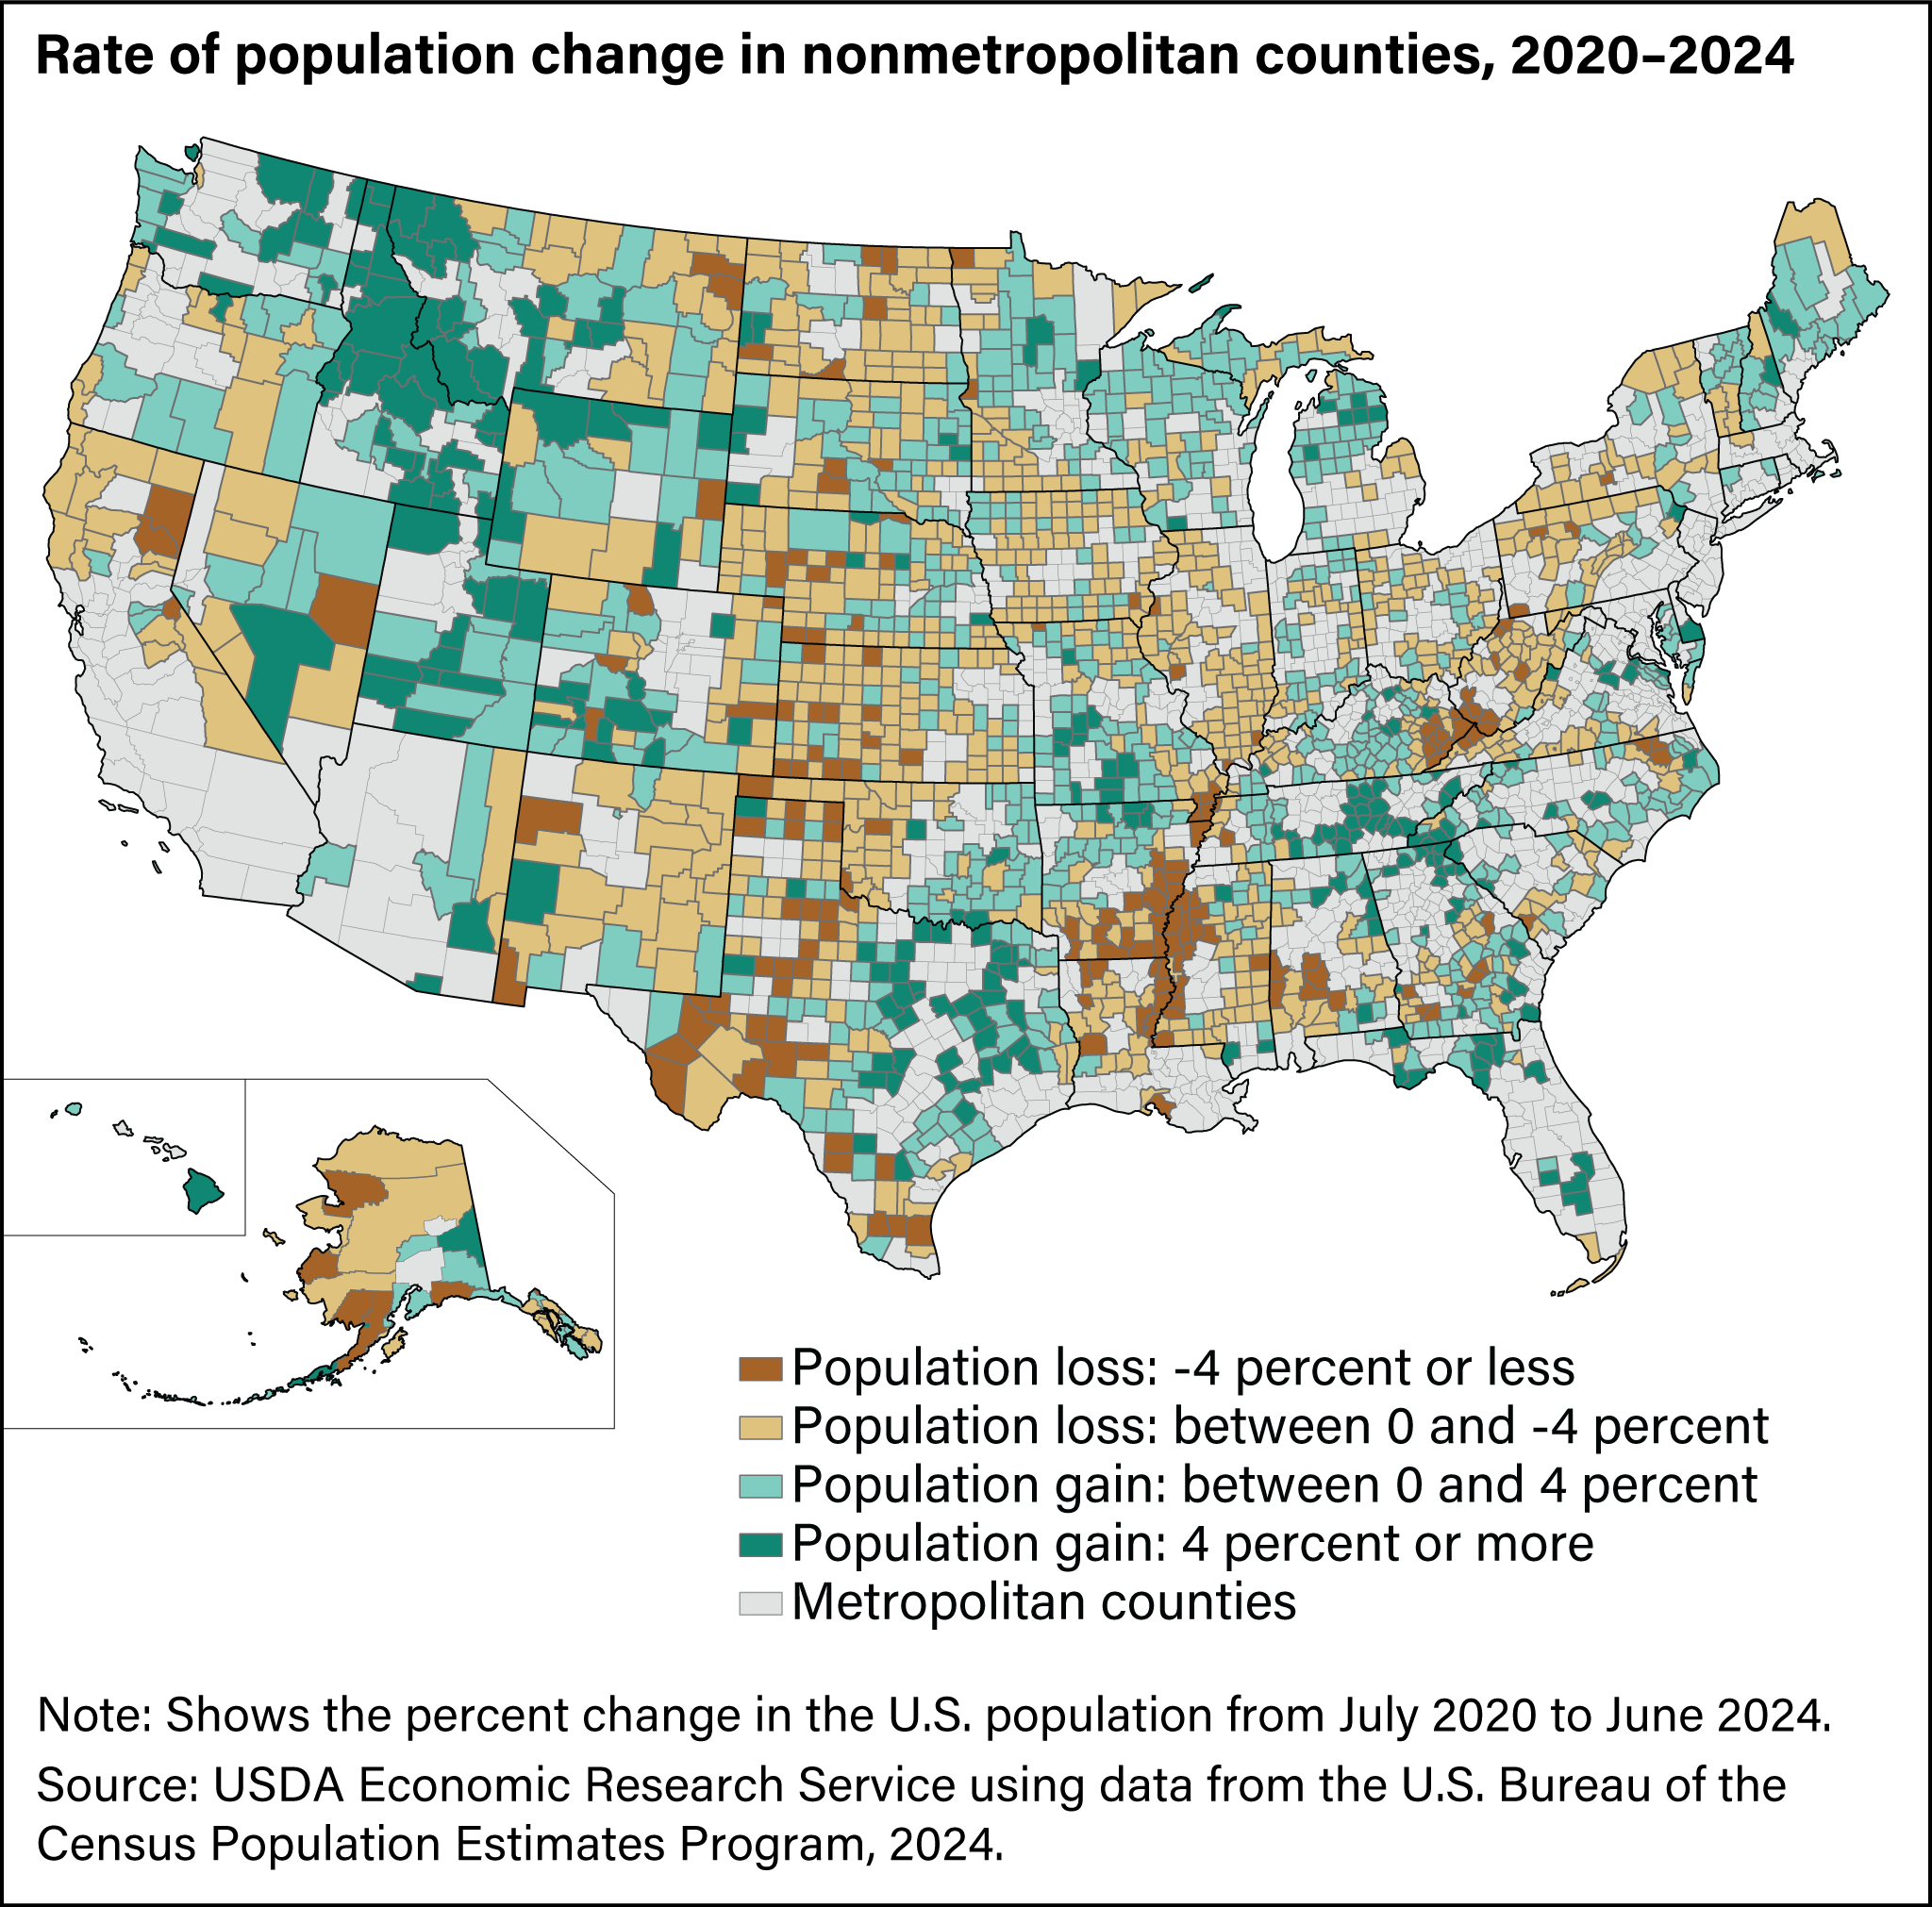
Population change varies widely across rural and small-town America. Recent growth (2020–24) has been concentrated in counties adjacent to metro areas and counties with recreation economies, with most other nonmetro counties seeing decline. Despite an overall nonmetro population increase, 51 percent of nonmetro counties saw population declines between July 2020 and June 2024. A nonmetro population decline was common across much of West Virginia, Pennsylvania, the Dakotas, Nebraska, Kansas, Illinois, Iowa, and California. Decline was also common in western Oklahoma and western Texas, the Mississippi Delta region of Mississippi, Arkansas and Louisiana; southern Alabama, and Appalachian Kentucky. Population growth was common in nonmetro counties across the Rocky Mountain region (especially in Idaho, Utah, Washington, Montana, and Wyoming); the northern parts of Minnesota, Wisconsin, and Michigan; the Texas hill country; parts of Maine, Vermont, and New Hampshire; the Missouri Ozarks; and across Tennessee, Florida, and North Carolina.
Nonmetropolitan Counties See More Deaths Than Births
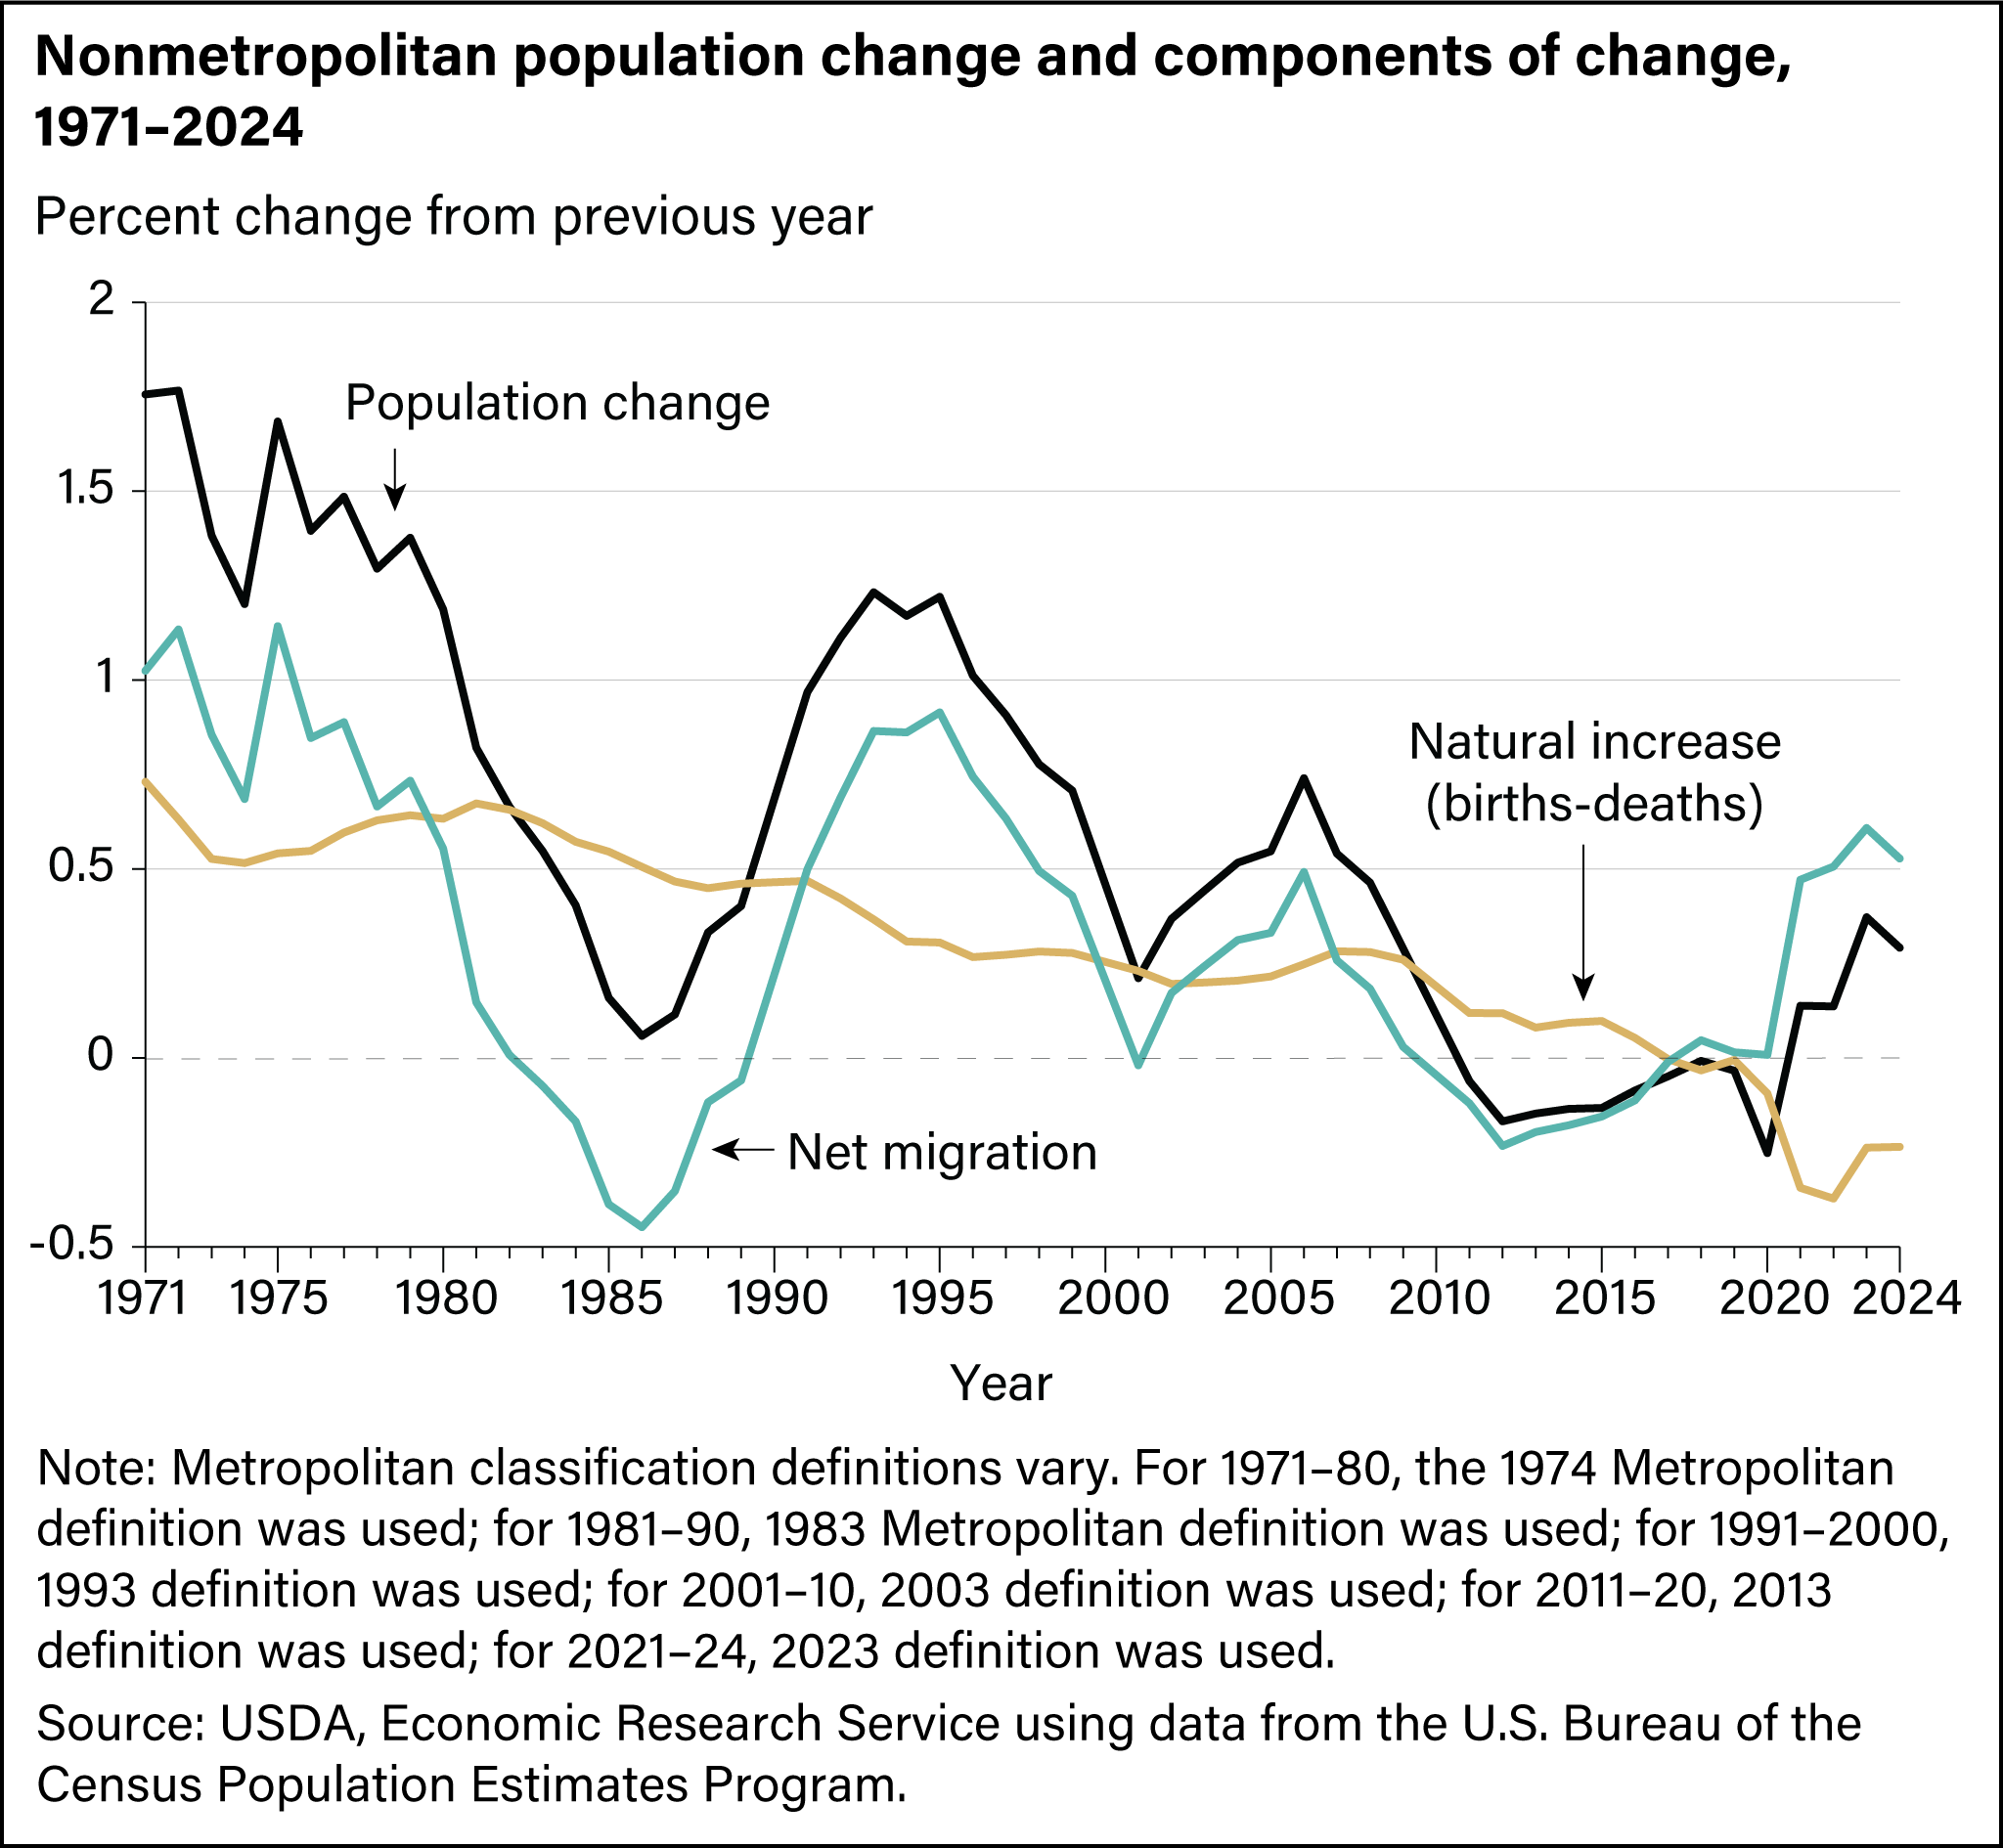
Population change occurs from a combination of natural change (births minus deaths) and net migration (in-migration minus out-migration). Falling birth rates and an aging population have steadily reduced the U.S. population growth from natural change in nonmetro counties over time. Each year since 2017, nonmetro areas have recorded more deaths than births (natural decrease). Between 2020 and 2024, a natural decrease reduced the nonmetro population by 563,550 people.
Natural decrease is now widespread across nonmetro counties, with 1,492 nonmetro counties (76 percent) seeing a natural decrease between July 2023 and June 2024. Natural decrease should be expected to continue because of population aging.
Download chart image | Chart data
Migration
Recent U.S. nonmetro population growth has been due to migration, as more people moved into nonmetro counties than moved out. Between the census counts in 2020 and 2024, migration added an estimated 974,379 people to nonmetro populations, 69 percent of which was from domestic migration. International migration added an estimated 300,424 people to nonmetro populations. Between July 2021 and June 2024, overall net migration rates for nonmetro counties have been higher than at any point since 1997.
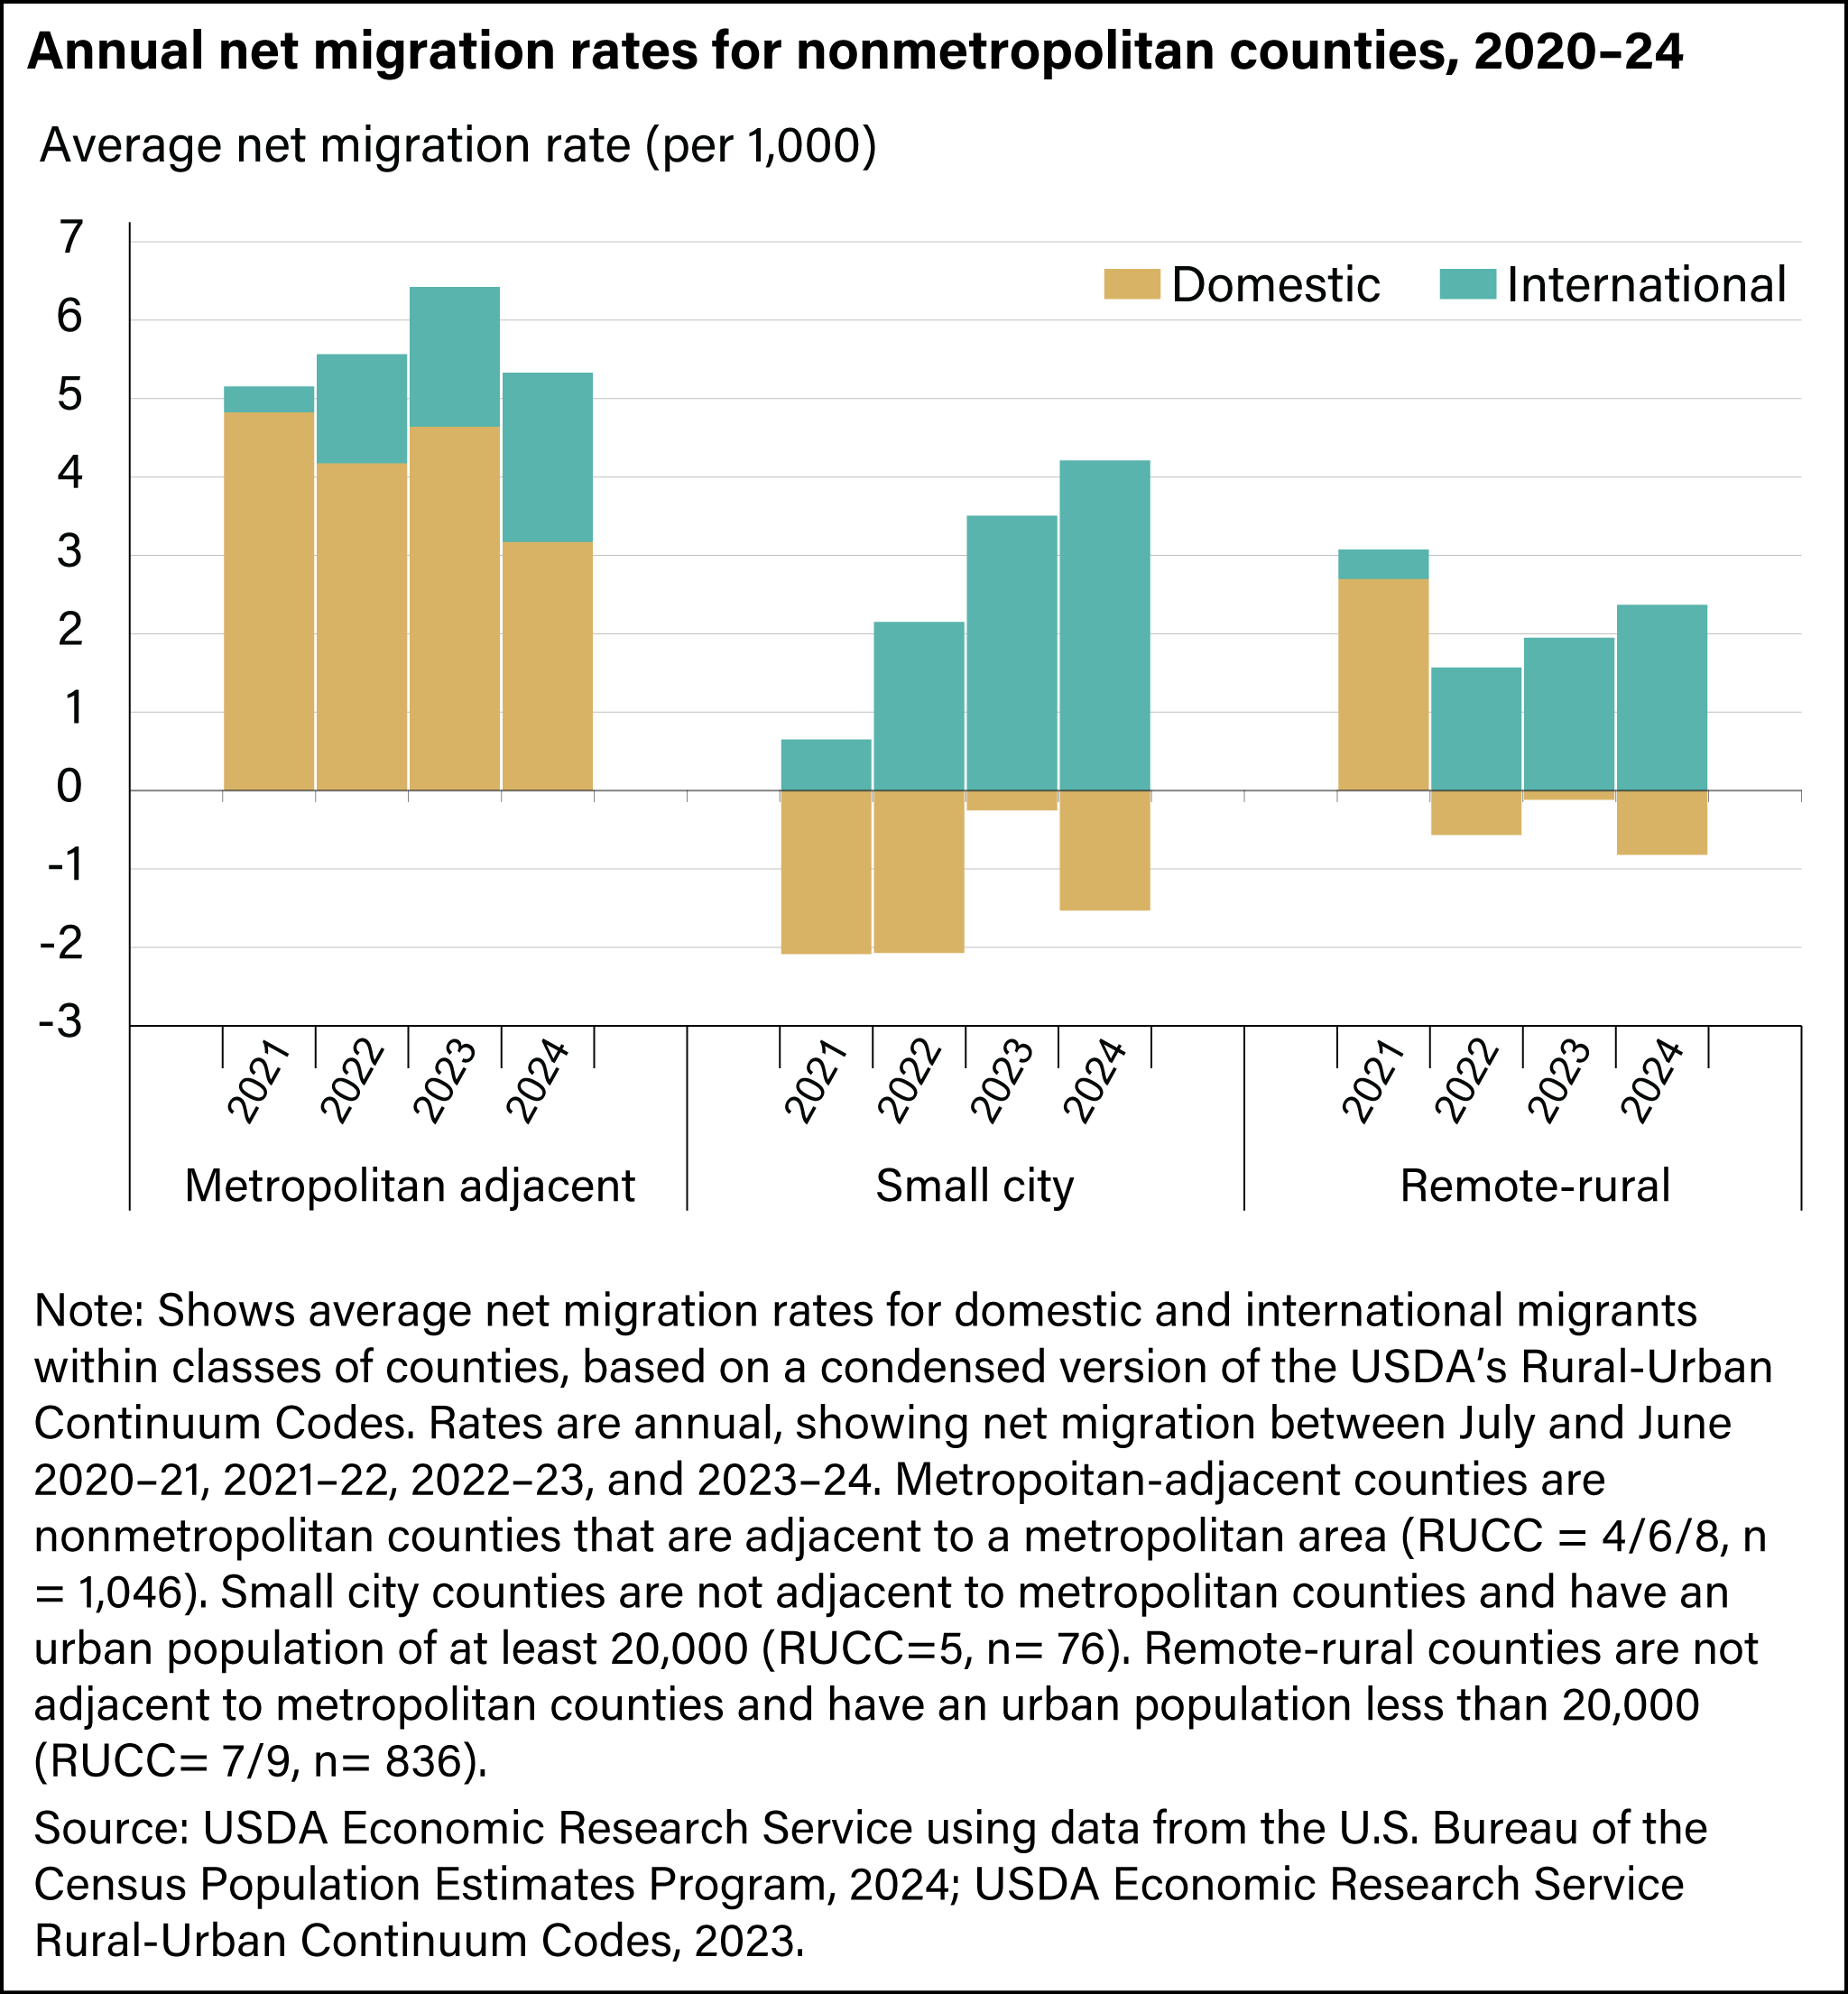
Overall, 65 percent of nonmetro counties had positive net migration between the census count in 2020 and June 2024. Among nonmetro counties, domestic net migration was concentrated in counties adjacent to metro areas. On average, non-adjacent counties with urban populations of at least 20,000 (small-city counties) saw net losses due to domestic migration each year between 2020 and 2024. However, gains from international migration offset these losses, especially between 2022 and 2024. The average remote-rural county (non-adjacent and with an urban population less than 20,000) saw domestic a net migration gain between 2020 and 2021, but a modest loss from domestic migration between 2021 and 2024. However, remote-rural counties tended to see gains from international net migration between 2021 and 2024 that made up for domestic losses.
Age Structure
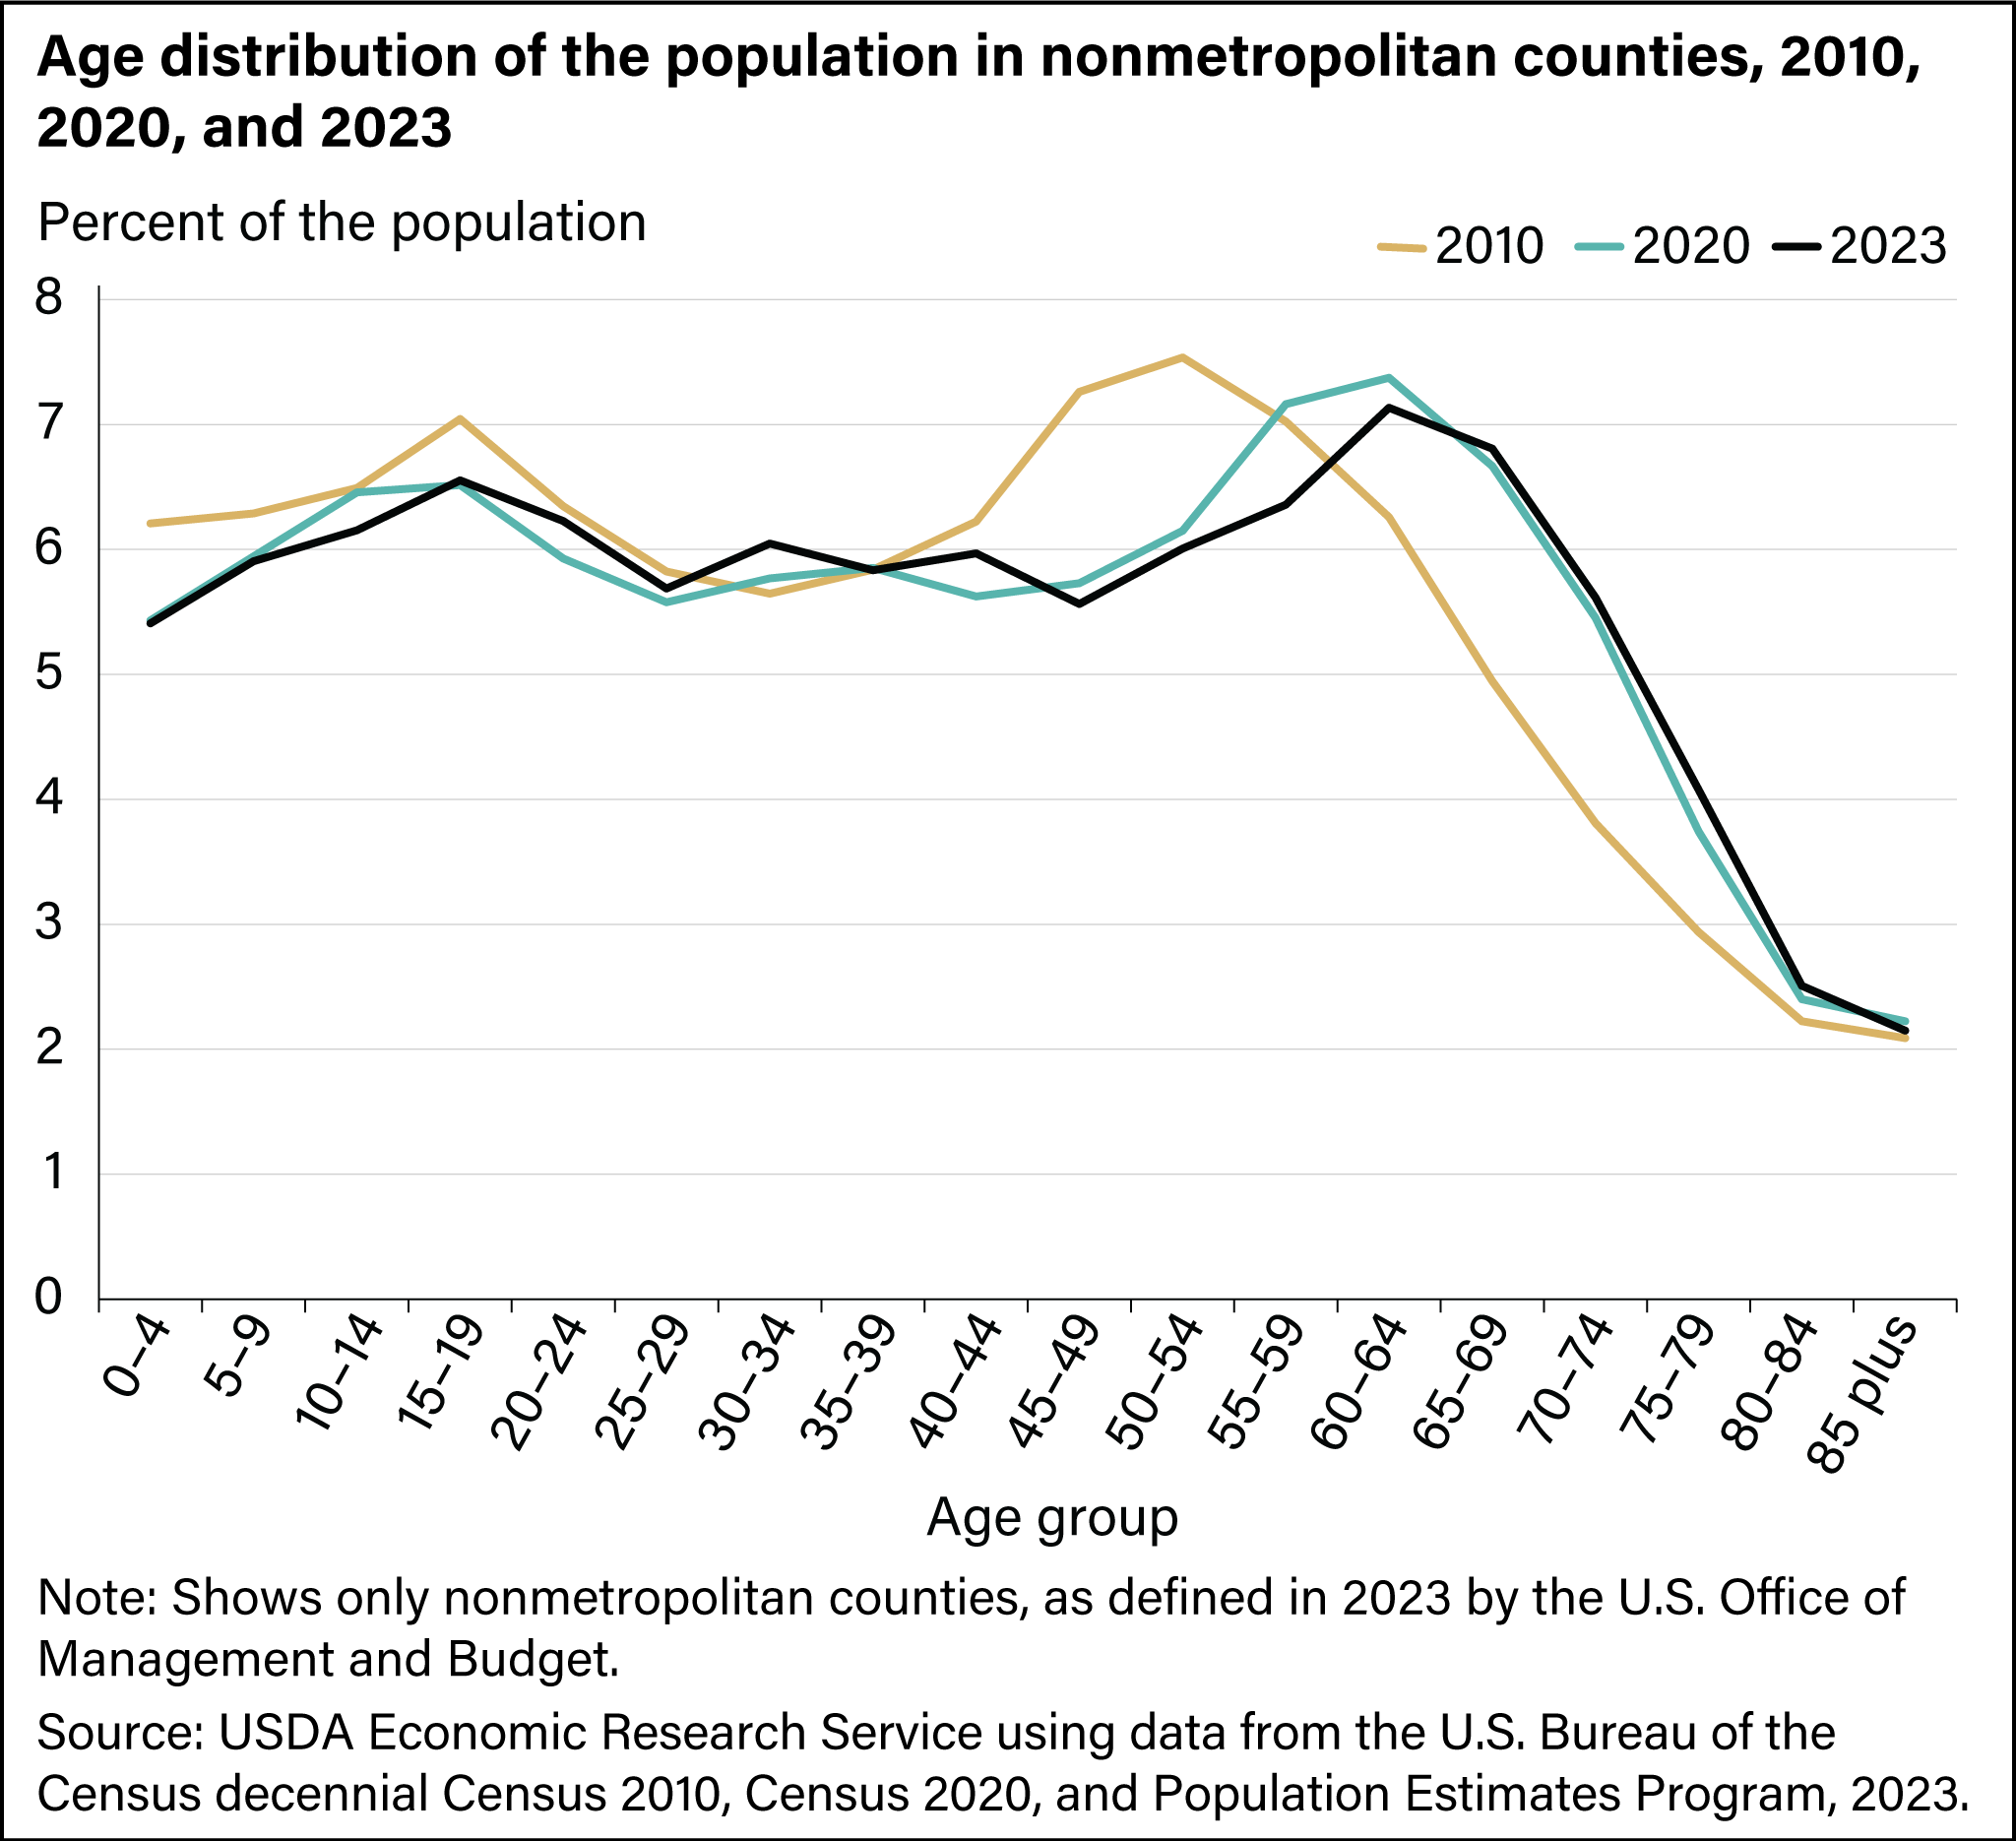
Nonmetro populations are aging as the number of older people increases and the number of younger people declines. In 2023, 21 percent of the U.S. nonmetro population was over age 65, compared to 17 percent of the metro population. Between 2010 and 2023, the number of working age people (age 15–64) declined in nonmetro areas. The combination of shrinking working-age populations and growing older populations create challenges for communities to provide services and care for both younger and older age groups that have a relatively small labor force.
In 2010, the nonmetro population was most concentrated at ages 45–59 (Baby Boomers) and ages 15–24 (children of Baby Boomers). More recently (in 2020 and 2023), the main peak has shifted older and many of those younger people have moved towards more urban destinations. By the end of 2025, the youngest of the large Baby Boom generation will have turned 61 and the oldest reached age 79, further contributing to population aging.
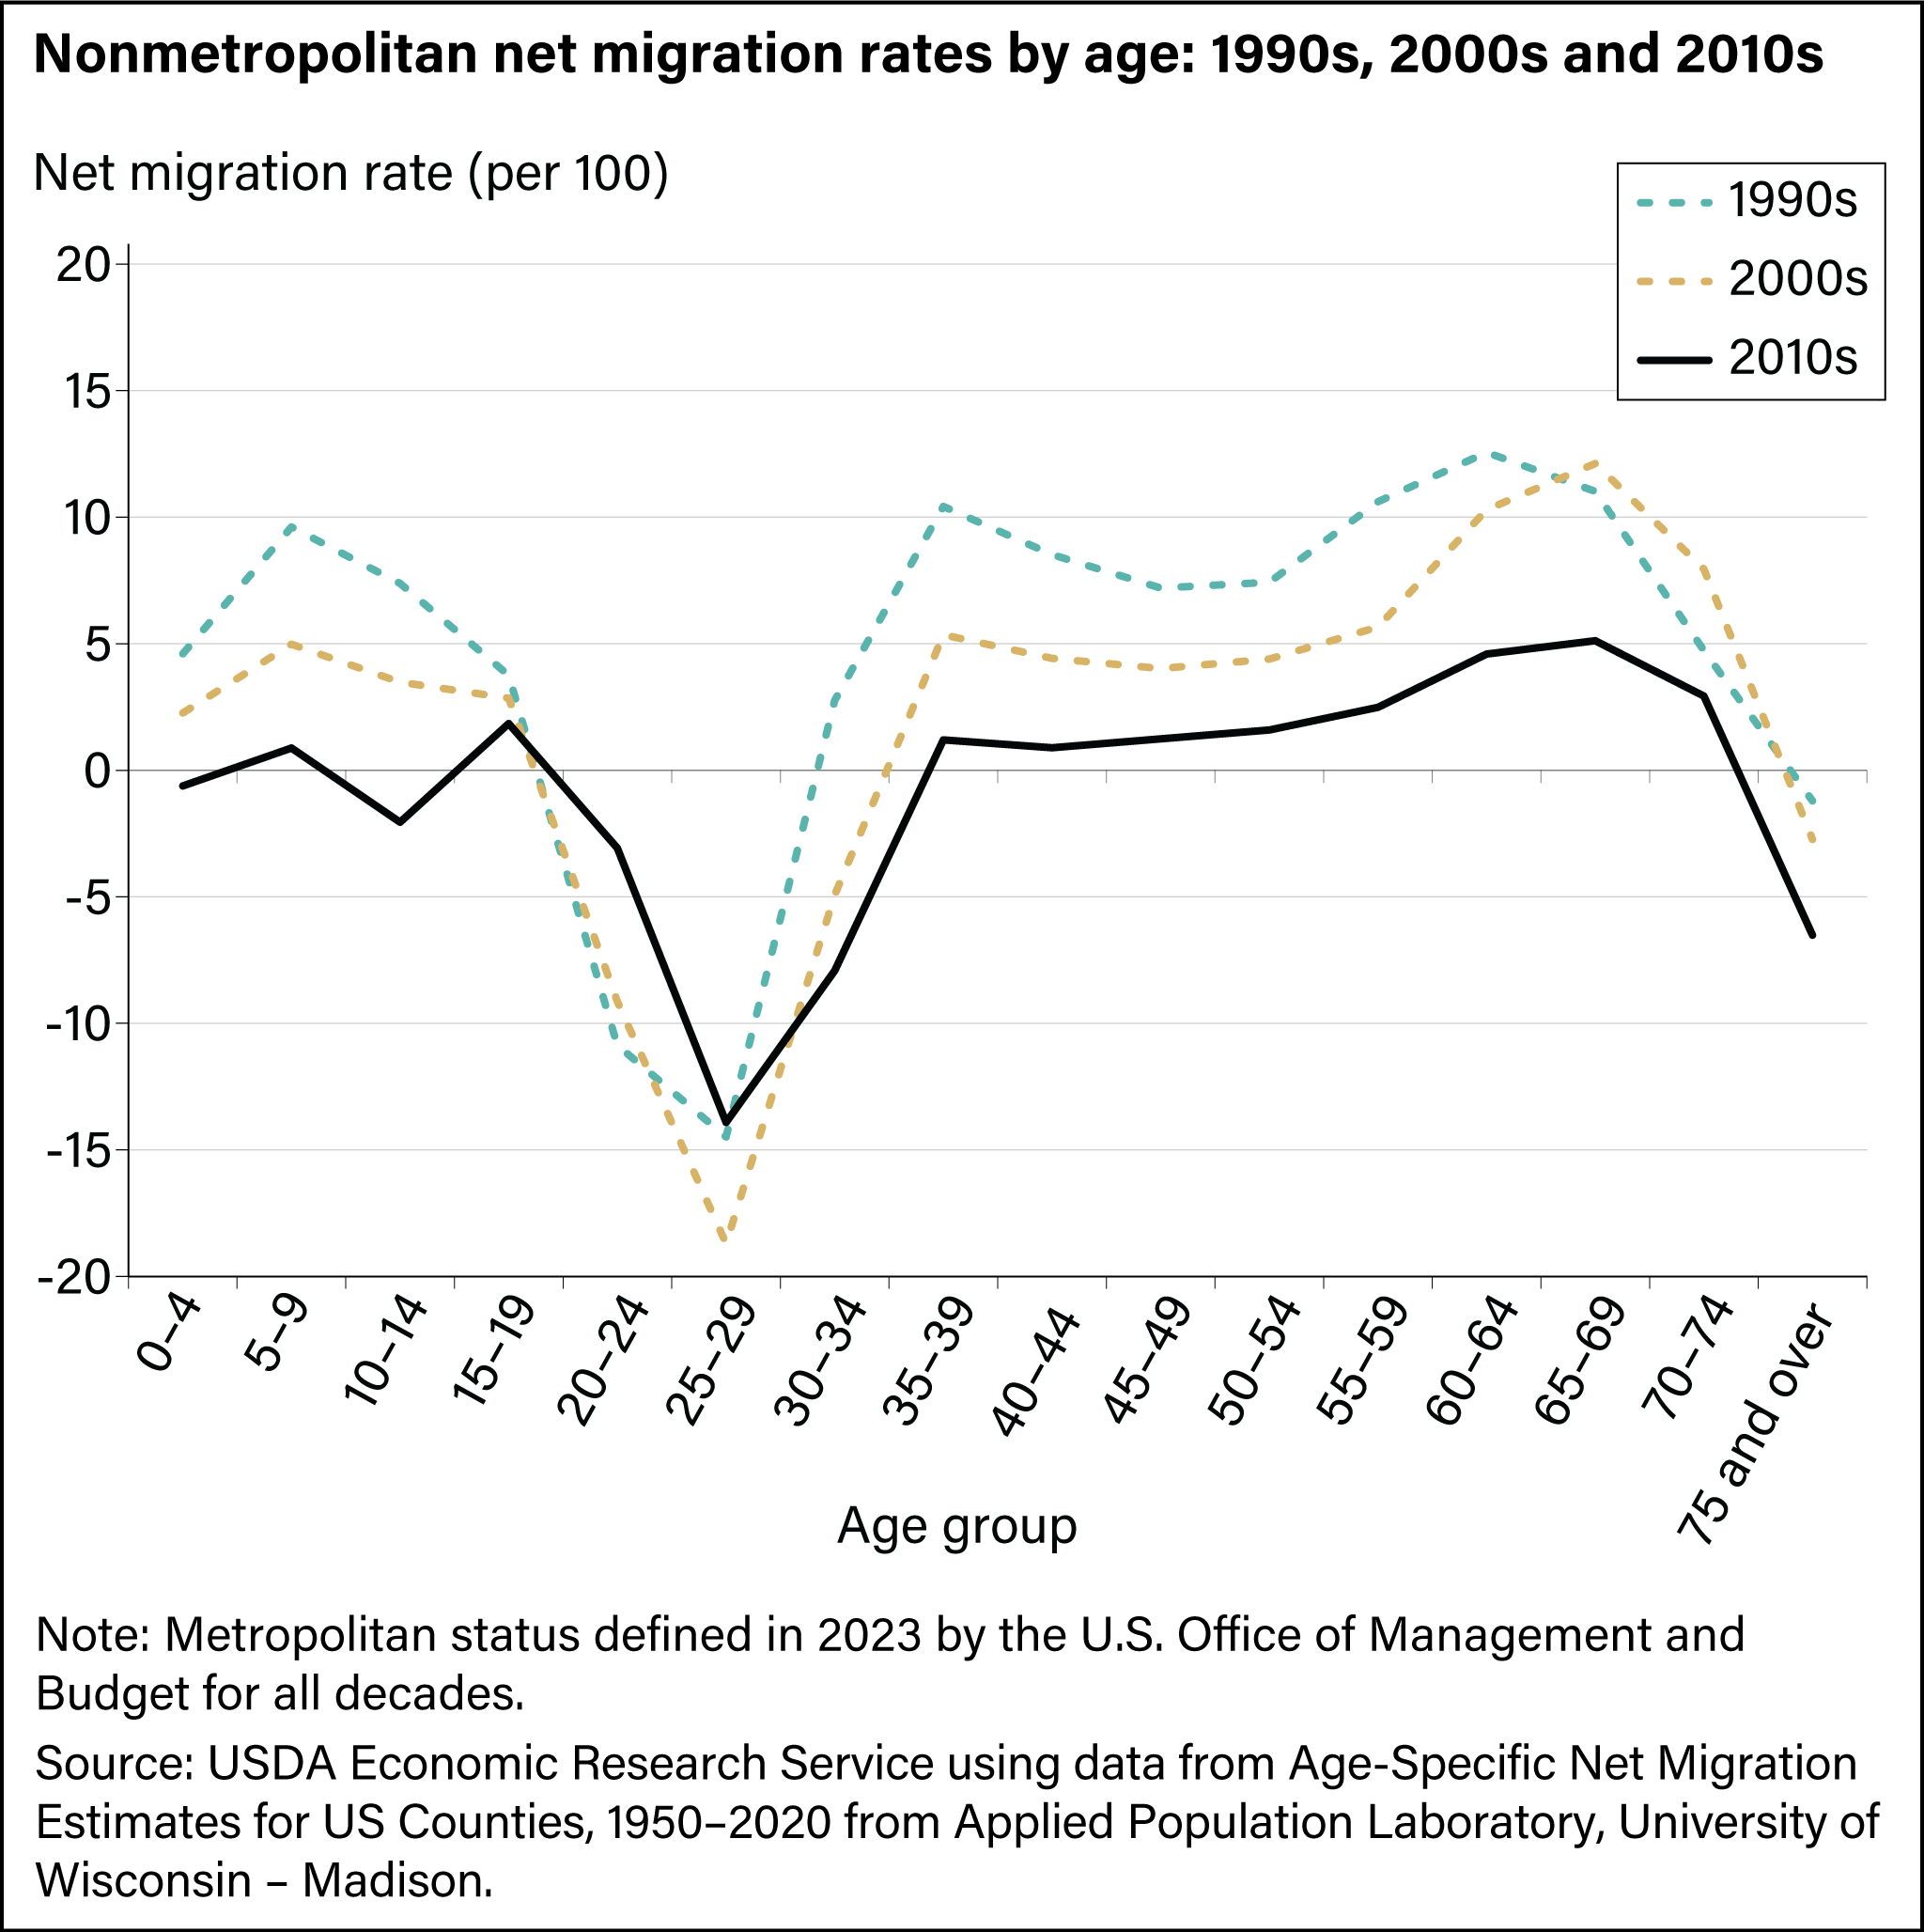
Populations are older in nonmetro areas because of consistent age-specific net migration patterns over decades, where young adults have tended to move away from nonmetro counties, while older people have moved in. Net migration rates are positive (above zero) at ages where there are more in-migrants to the region than out-migrants and negative (below zero) otherwise. Nonmetro counties, on average, lost from between 10 and 20 percent of young people ages 15–29, due to out-migration each decade in the 1990s, 2000s, and 2010s. Nonmetro counties generally gained migrants in their 30s, 40s, 50s, and 60s and especially around retirement ages (ages 55–74), but less so in the 2010s than in the 1990s or 2000s.
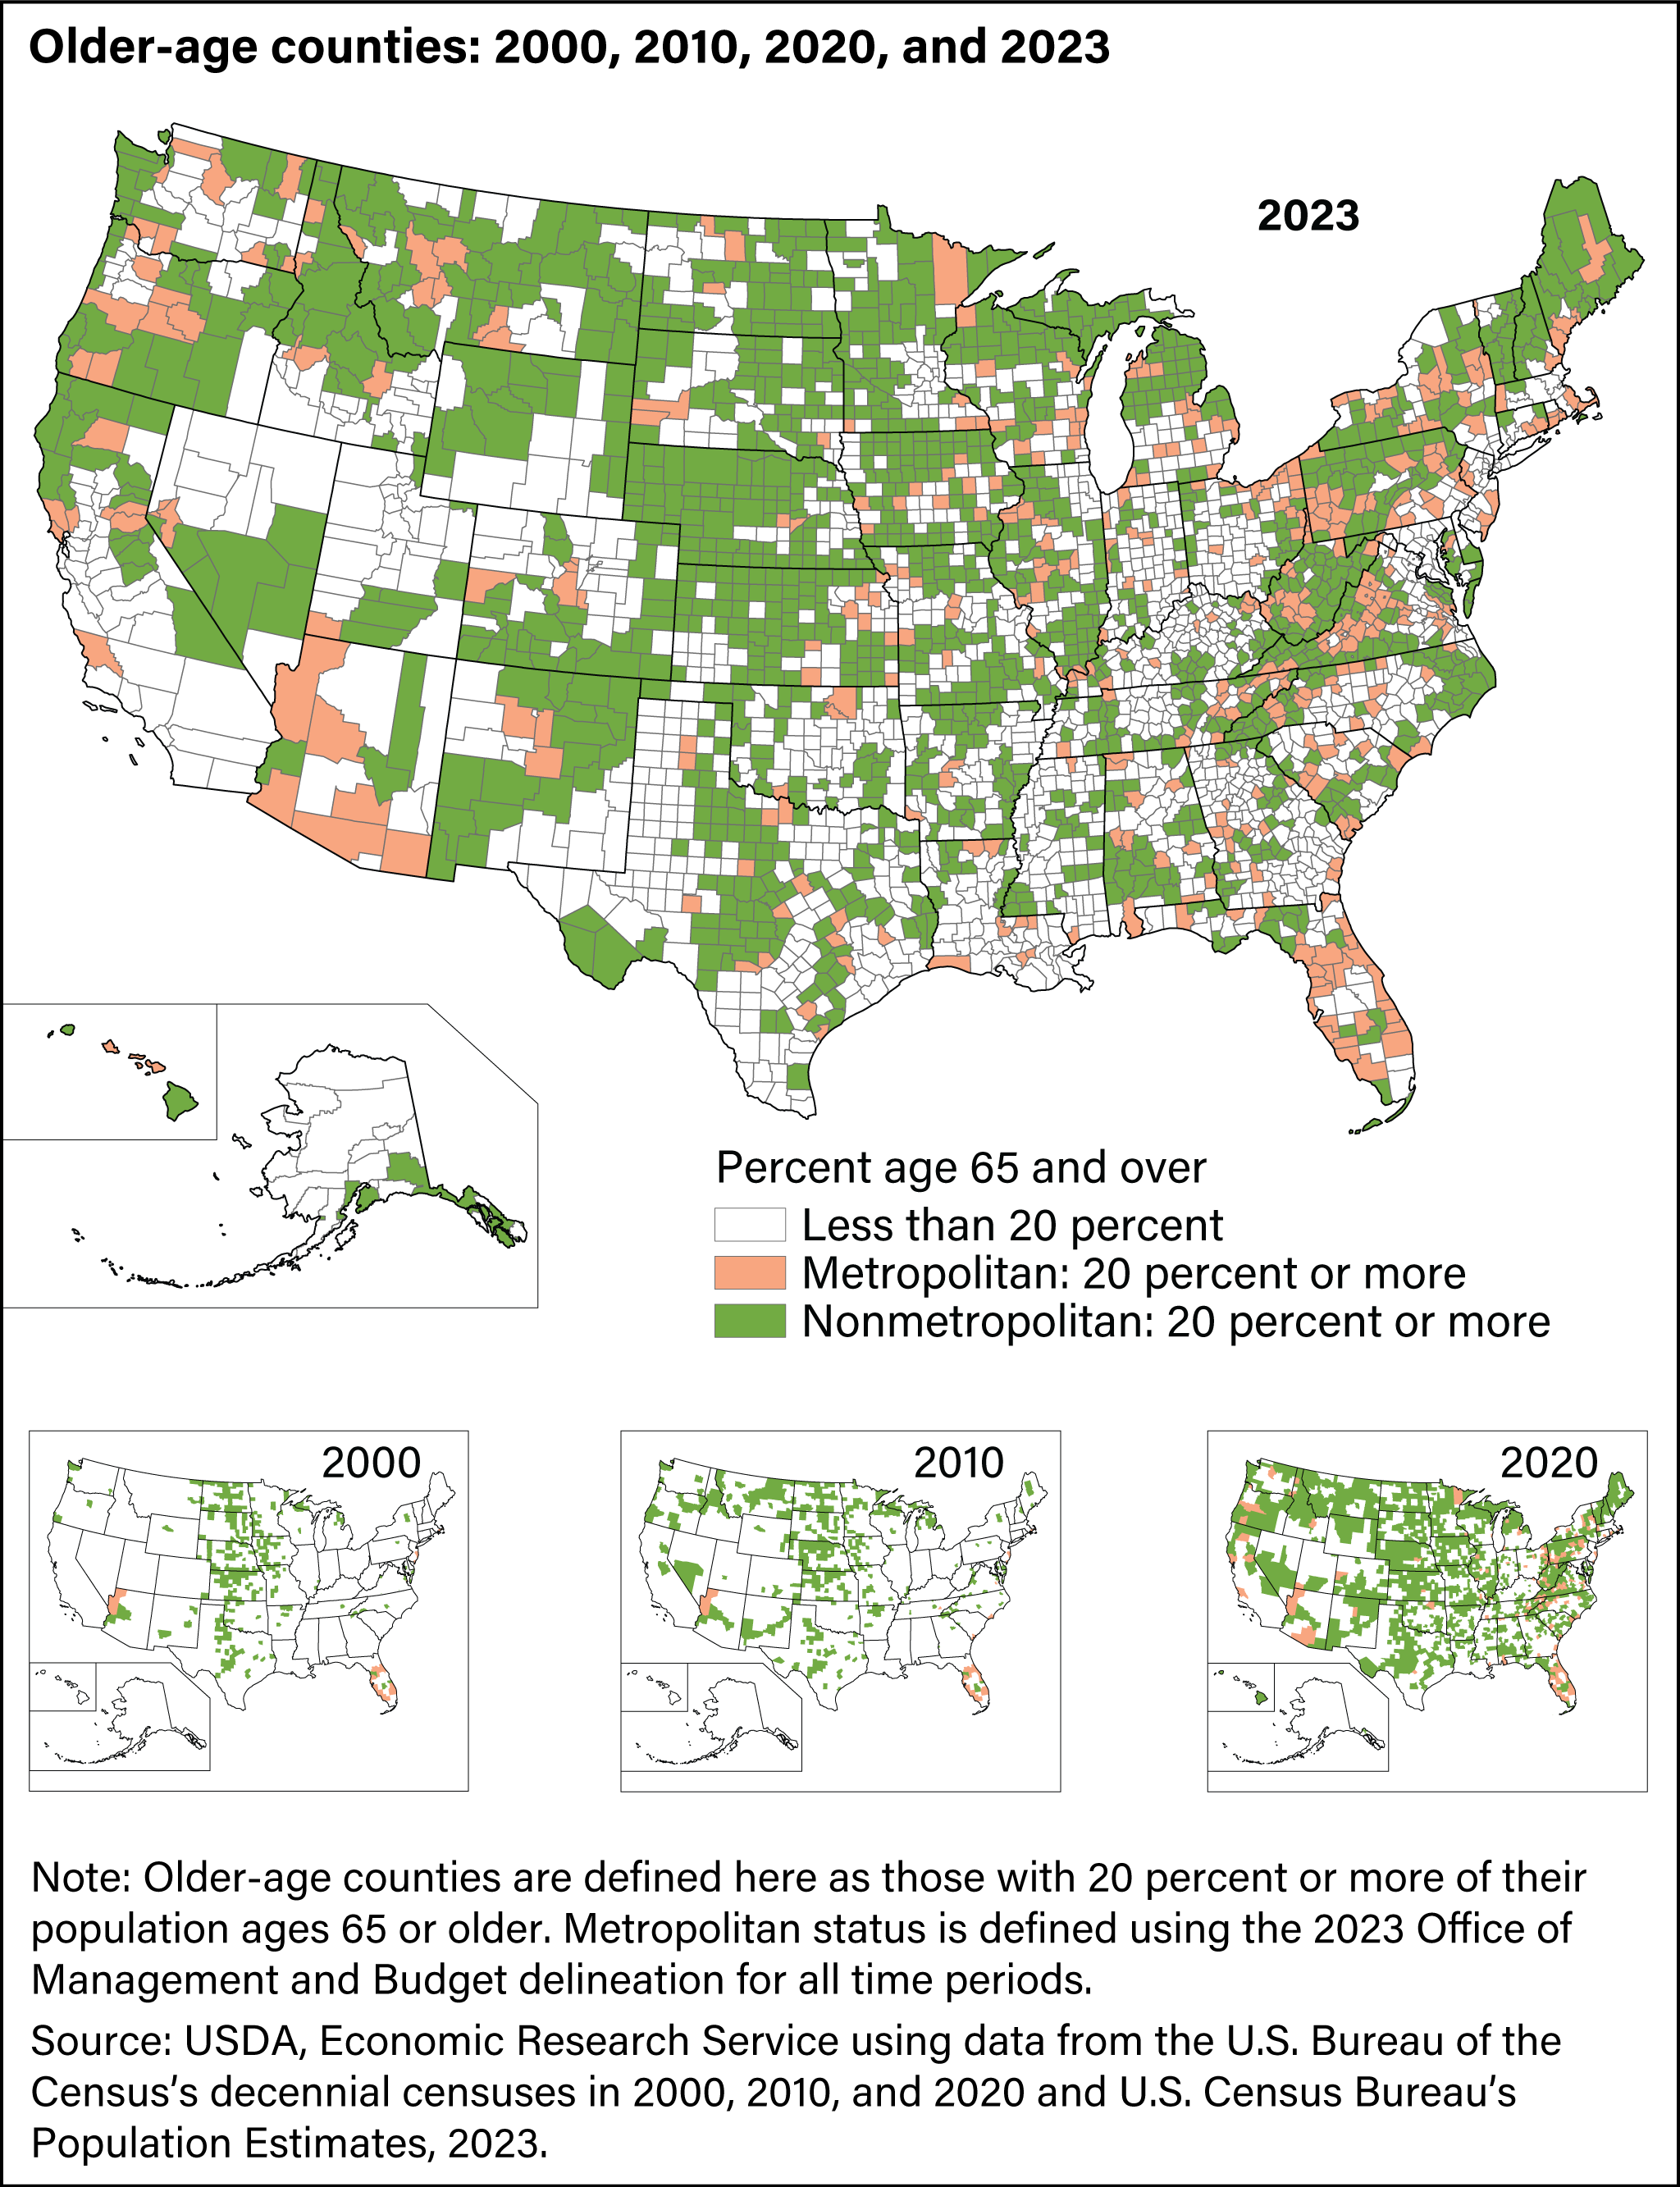
Population aging is widespread across nonmetro counties. Older-age counties are those where at least 20 percent of the population is age 65 or older. In 2000, only 292 counties (15 percent of nonmetro counties) had reached this threshold. These early older-age counties were concentrated in the Great Plains region, and in Florida and other known retirement destinations. By 2023, however, 66 percent of nonmetro counties qualified as older age, spreading across all regions of the country.
In addition to this topic page, ERS provides annual statistics in its County-level Datasets: Population, and State-level (rural/urban) summaries in its State Fact Sheets.
A summary of rural population conditions and trends (among other rural issues) is found in the Rural America at a glance series, updated in the fall of each year. See the latest in the series:
Rural America at a Glance: 2024 Edition (EIB-282, November 2024). U.S. Department of Agriculture, Economic Research Service.