
Population change 2010-11 varies across States
- by Economic Research Service
- 4/19/2012
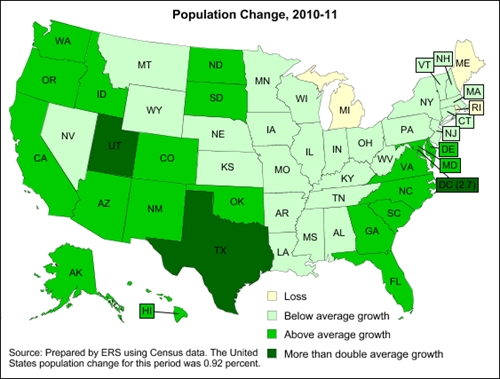
Recently released data from the Census Bureau show that the annual rate of U.S. population growth has slowed to 0.92 percent. Three States registered population loss in 2010-11: Rhode Island, Michigan, and Maine. Washington, North Dakota, Colorado, Alaska, Utah, and Texas all had growth rates over 1.5 percent. Washington D.C. topped the list with 2.7 percent population growth in 2010-11. This map is from County-Level Population Data on the ERS website, updated April 13, 2012.