
Employment has grown faster in metropolitan than nonmetro counties since the Great Recession
- by John Pender and Dennis Vilorio
- 11/18/2019
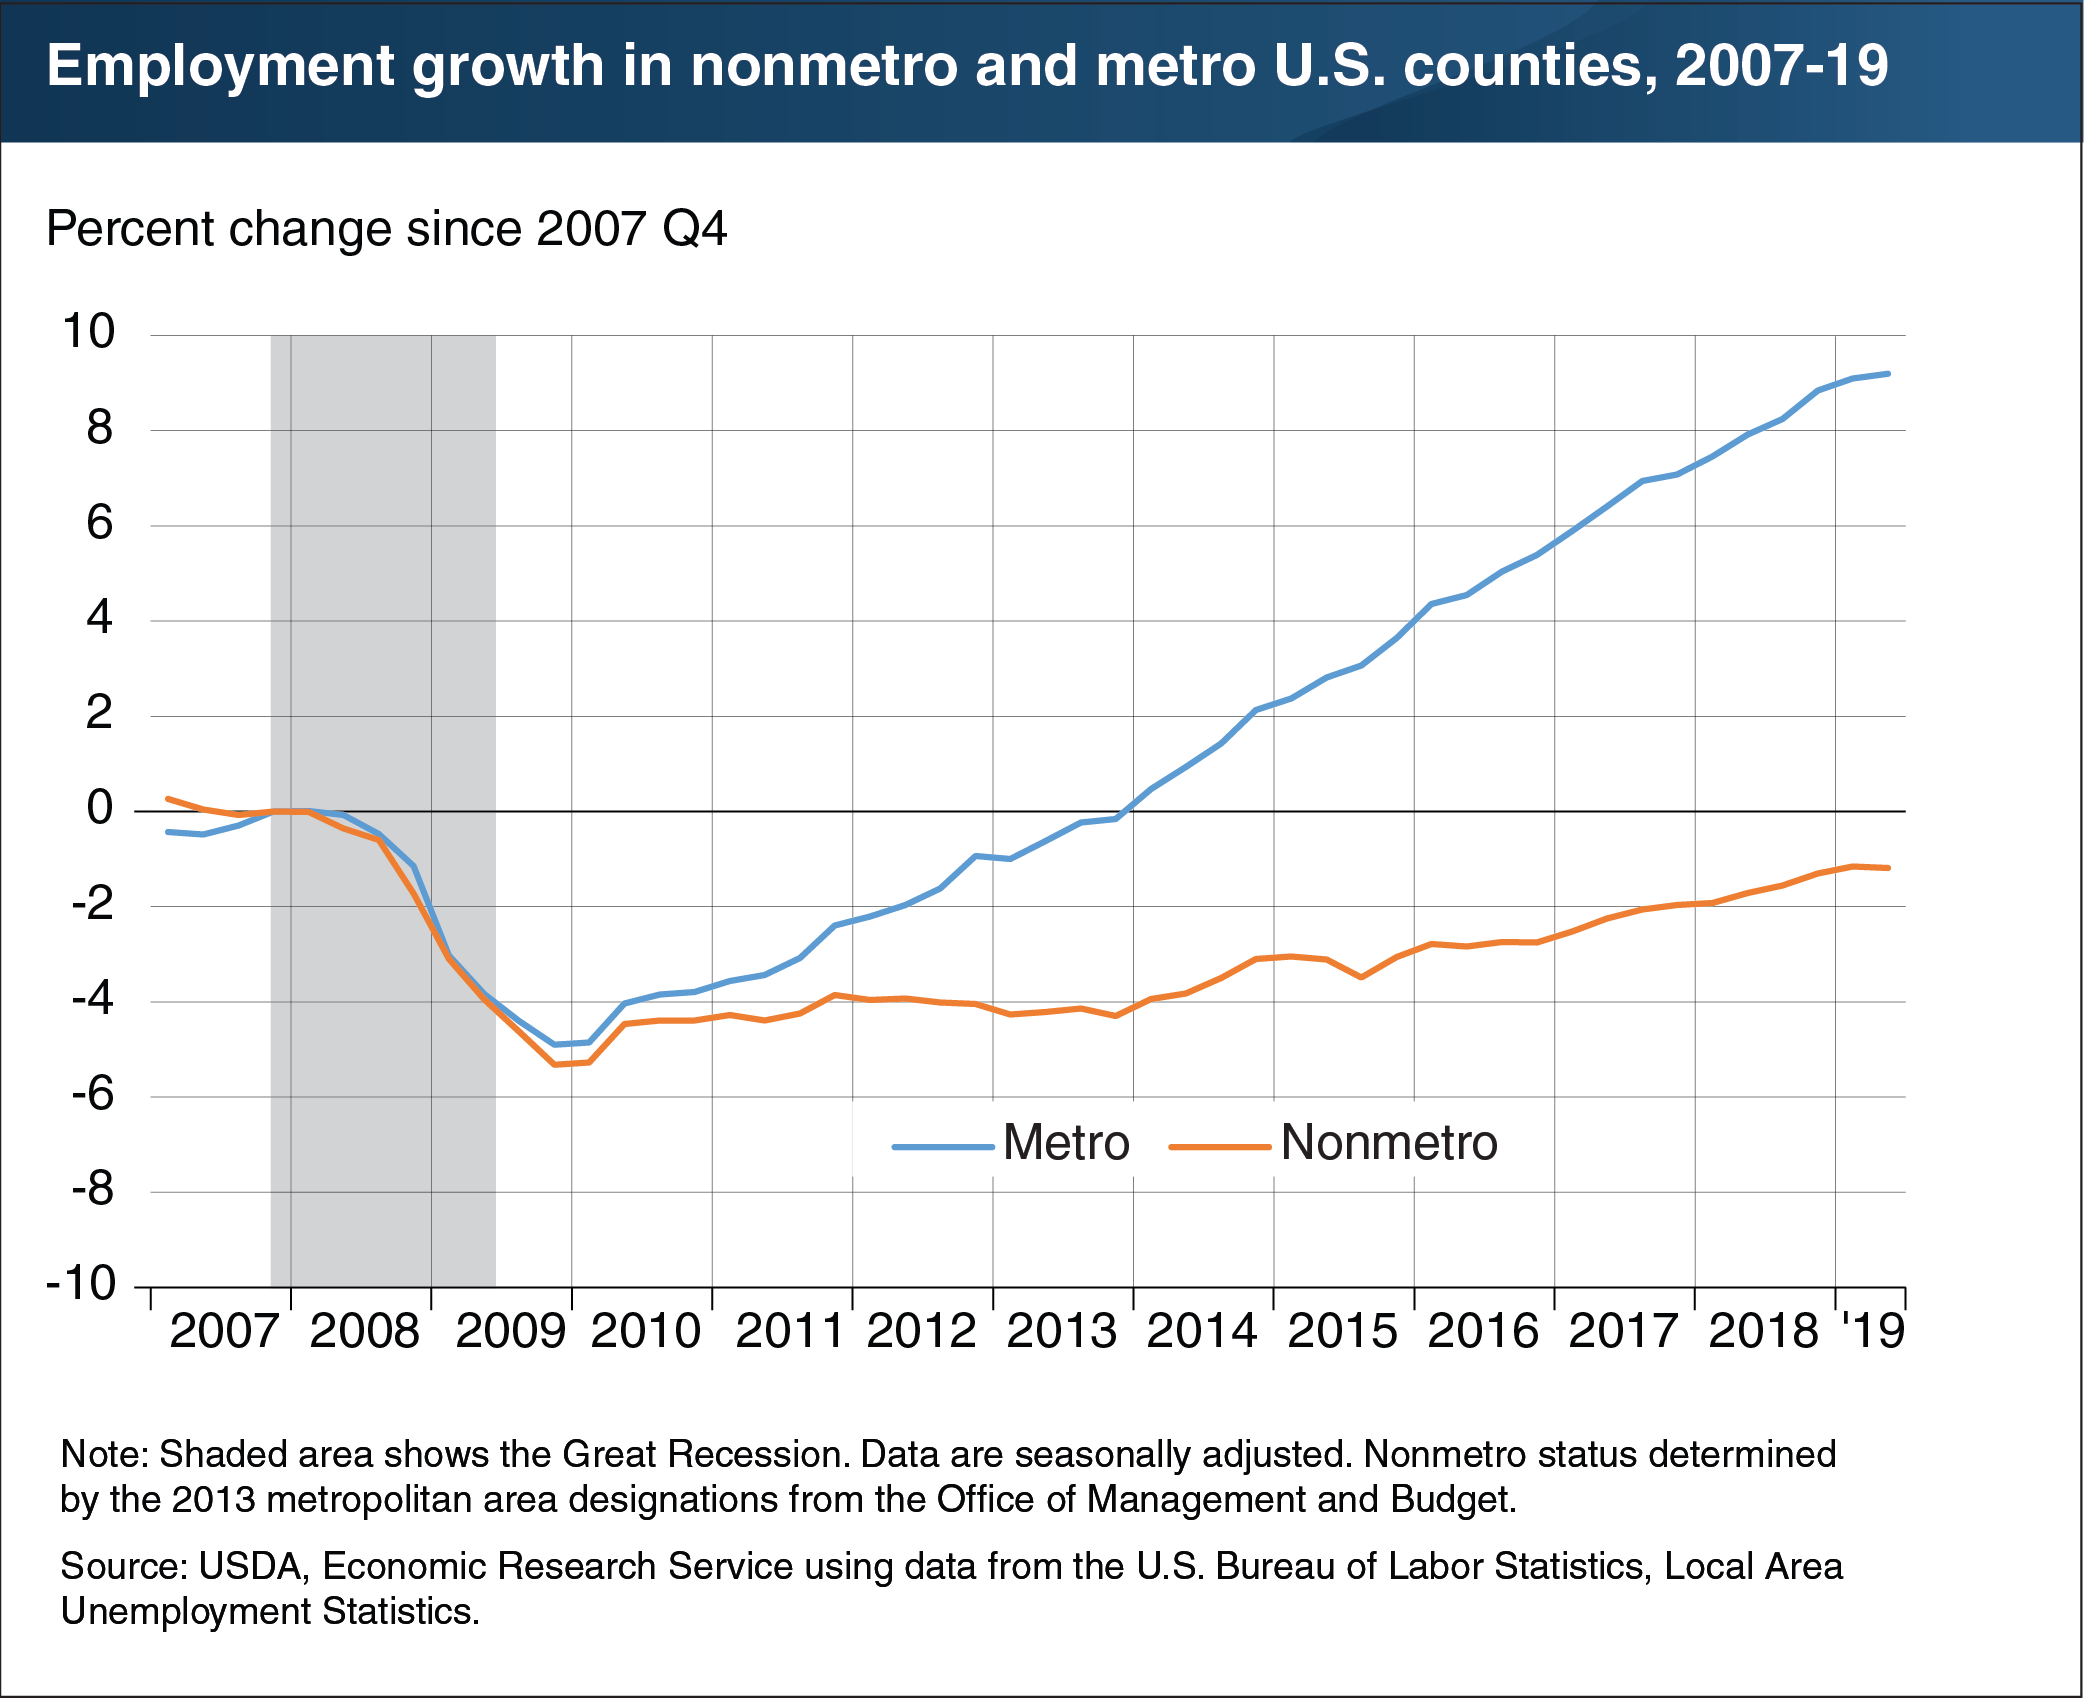
Employment in both nonmetro and metro counties fell by 5 percent between the end of 2007 and the end of 2009, reflecting the effects of the Great Recession. Since then, however, employment growth in rural areas has fallen behind metro employment growth. Between 2010 and 2018, nonmetro employment grew at an average annual rate of 0.4 percent, compared to 1.5 percent per year in metro areas. By the second quarter of 2019, nonmetro employment still remained more than 1 percent below the pre-recession level, while metro employment exceeded the pre-recession level by more than 9 percent. These differences in employment growth rates between nonmetro and metro areas may be related in part to differences in population growth. The slowest employment growth occurred in the same areas that had negative population growth—i.e., nonmetro counties with an urban population of less than 20,000. Employment growth since 2010 was faster than population growth in all groups of counties, indicating that a rising share of the population was employed. This chart appears in the November 2019 ERS report, Rural America at a Glance, 2019 Edition.