ERS Charts of Note
Subscribe to get highlights from our current and past research, Monday through Friday, or see our privacy policy.
Get the latest charts via email, or on our mobile app for  and
and 
Wednesday, September 16, 2015
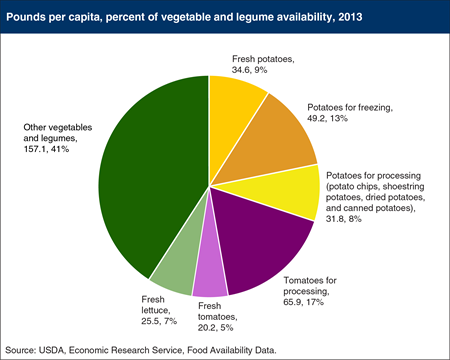
When consumers are advised in the produce aisle that “More Matters,” they are not just being encouraged to eat a greater quantity of fruits and vegetables, but more variety as well. Restricting one’s diet to a limited set of vegetables precludes the desired variety that would supply more diverse, healthful nutrients. According to ERS’s Food Availability data, just three vegetables—white potatoes, tomatoes, and lettuce—accounted for 59 percent of the vegetables and legumes that were available for consumption in 2013. White potatoes accounted for 30 percent of the 384.4 pounds per person of vegetables and legumes available in 2013. Tomatoes had a 22-percent share, with 20.2 pounds per person of fresh tomatoes and 65.9 pounds per person of processed tomatoes. Fresh lettuce (head lettuce, romaine, and leaf lettuce) rounded out the top 3 vegetables at 25.5 pounds per person—7 percent of 2013’s total vegetable and legume availability. This chart appears in “Potatoes and Tomatoes Account for Over Half of U.S. Vegetable Availability” in the September 2015 issue of ERS’s Amber Waves magazine.
Wednesday, June 17, 2015
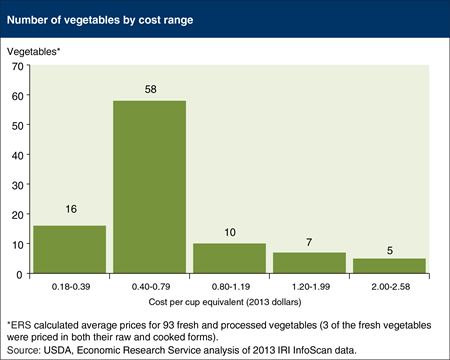
When it comes to vegetable consumption, “More Matters.” Eating a variety and sufficient quantity of vegetables is important for good health, but how much would it cost to add some baby carrots, romaine lettuce, or fresh asparagus to your diet? ERS estimated average prices paid in 2013 for 93 fresh and processed vegetables (including beans and peas), measured in cup equivalents. A cup equivalent is the edible portion that will generally fit in a 1-cup measuring cup; 2 cups for lettuce and other raw leafy greens. ERS researchers found that fresh iceberg lettuce, fresh whole carrots, dried pinto beans, and 13 other products cost less than 40 cents per cup equivalent, while 58 vegetables, including fresh romaine lettuce, baby carrots, and canned tomatoes, cost between 40 and 79 cents per cup equivalent. Fresh asparagus, at $2.58 per cup equivalent, is the priciest of these 93 vegetables. The data in this chart are from ERS's Fruit and Vegetable Prices data product.
Tuesday, May 26, 2015
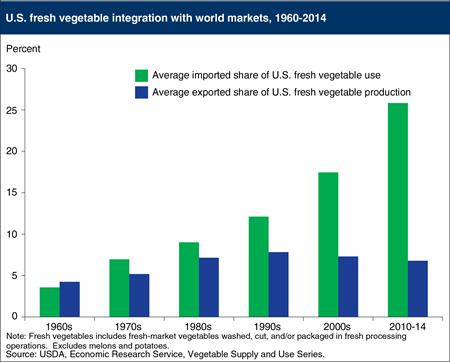
U.S. production of fresh vegetables has grown over the past several decades, but domestic consumption has grown even faster, reflecting an expanding population and higher per capita use. The United States has been a net importer of fresh vegetables since 1969 (with the exception of 1981), and the rate of increase of the share of imports grew notably after 1990. Since 2010, approximately 25 percent of the fresh vegetable supply utilized in the United States has been imported each year. The value of fresh vegetable imports exceeded exports by almost $4.3 billion in 2014. The share of imports in domestic use continues to grow in response to multiple factors, including supply gaps, increased awareness of vegetables as a part of healthy diets, desire for year-round variety of fresh vegetables, and increased demand for new products. Exports have remained a relatively small share of U.S. fresh vegetable production. Average volume exported as a share of production peaked in the 1990s and the share exported to all countries fell approximately 3 percent in 2014 compared to the previous year. Onions and lettuce continue to dominate fresh vegetable exports. This chart is based on the Vegetables and Pulses Outlook: May 2015.
Wednesday, May 20, 2015
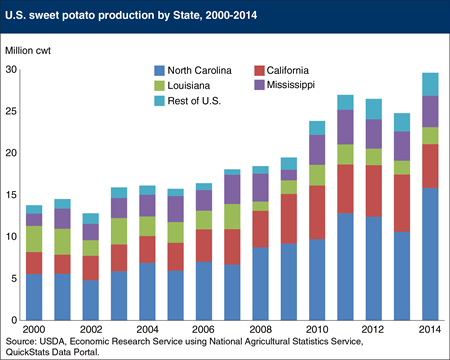
U.S. sweet potato production reached a record high 29 million hundredweight (cwt) in 2014, extending production gains that have continued for more than 15 years. Since 1971, North Carolina has been the top sweet potato producer in the United States, and in 2014 it produced 53 percent of all sweet potatoes grown in the country. North Carolina’s production of sweet potatoes in 2000 was 5.6 million cwt, and by 2014 it had had expanded to 15.8 million cwt. The 185-percent increase in North Carolina’s production has led the growth of the U.S. sweet potato industry, but production has expanded in many other states, including California (where production has doubled since 2000) and Mississippi (where production is up by 155 percent). This chart is from the Vegetables and Pulses Outlook: May 2015.
Monday, April 20, 2015
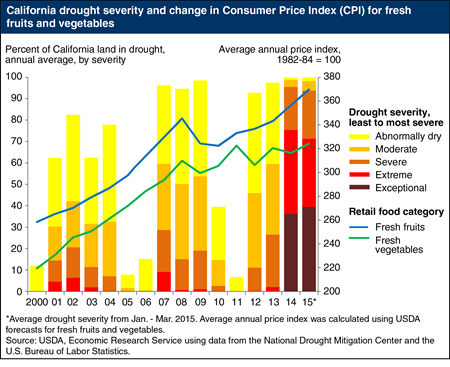
The California drought continues into 2015—as of March, 42 percent of the State is classified under the exceptional drought rating. Despite these conditions, U.S. fresh fruit and vegetable price inflation is expected to be close to its historical average in 2015. ERS predicts fresh fruit prices will increase 2.5 to 3.5 percent and fresh vegetable prices 2.0 to 3.0 percent. While California does grow a large percentage of many U.S. fresh fruits and vegetables, portions of the produce purchased in grocery stores are imported from various foreign markets. Currently, the strong U.S. dollar is making foreign produce relatively less expensive, putting downward pressure on U.S. retail produce prices. Commodities that are grown almost entirely in California and whose supplies are not largely supplemented by imports could begin to experience higher price increases in 2015. This chart appears in the Food Prices and Consumers section of the California Drought: Farm and Food Impacts page on the ERS website. Information on ERS’s food price forecasts can be found in ERS’s Food Price Outlook data product.
Tuesday, March 17, 2015
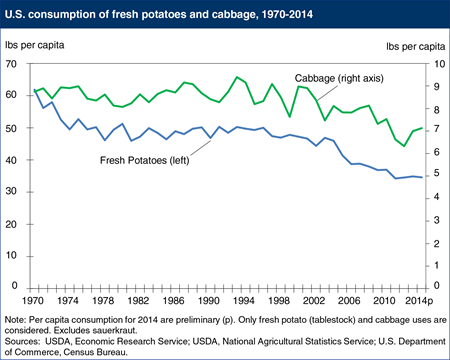
Many consumers will celebrate St. Patrick’s Day by preparing a traditional Irish-themed meal of corned beef, cabbage, and potatoes. While cabbage and potatoes remain seasonally popular, annual per capita consumption is trending lower. Beginning in the1970s and through the 1990s, consumption of fresh cabbage averaged about 8.5 pounds per capita, peaking at 9.3 pounds in 1993 with the growing availability of prepared, fresh-cut products such as slaws and salad mixes. Consumption has been trending lower since 2000, reaching as low as 6.3 pounds in 2012 before rebounding somewhat the past two years to 7.0 pounds in 2014. Consumption of fresh potatoes has been declining over a longer period, falling by about 20% during the 1970’s, before stabilizing during the 1980s and 1990s and trending lower again since 2000. The long-term decline reflects changes in the market as well as dietary shifts, including greater availability of processed potatoes (especially frozen) that supplant consumption of fresh potatoes, and growing interest in low-carbohydrate diets during the past decade that reduced consumption of all starches. This chart is based on data found in the Vegetable and Pulses Yearbook and the Food Availability Per Capita Data System.
_450px.png?v=5285.4)
Tuesday, December 30, 2014
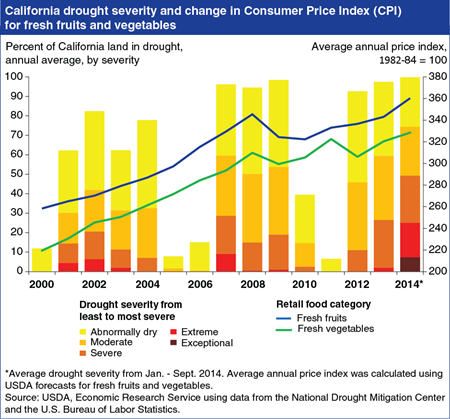
The severity and duration of the ongoing drought in California has raised concerns over its role in rising food prices at the grocery store, especially for fresh fruits and vegetables. In 2012, California produced nearly 50 percent (by value) of the nation’s vegetables and non-citrus fruit. Droughts in California are generally associated with higher retail prices for produce, but price increases are lagged due to the time it takes for weather conditions and planting decisions to alter crop production, which then influence retail prices. In 2005, following five years of drought, retail fruit prices rose 3.7 percent and retail vegetable prices increased 4 percent. Prices continued to rise in 2006, one year after drought conditions began to improve. However, other factors such as energy prices and consumer demand also affect retail produce prices. For example, prices for fresh produce fell in 2009 despite drought conditions, as the 2007-09 recession reduced foreign and domestic demand for many retail foods. As of October 2014, ERS analysts are forecasting fresh fruit prices to increase 4.5 to 5.5 percent in 2014 and vegetable prices to be 2 to 3 percent higher. This chart appears in the Food Prices and Consumers section of the 2014 California Drought page on the ERS website. Information on ERS’s food price forecasts can be found in ERS’s Food Price Outlook data product, updated October 24, 2014. Originally published Thursday October 30, 2014.
Friday, November 28, 2014
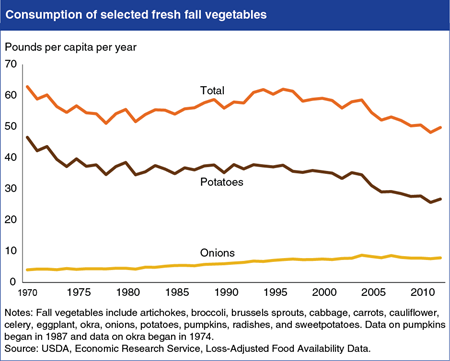
With colder weather approaching, many cooks turn to traditional fall vegetables for their made-from-scratch dishes. According to ERS’s Loss-Adjusted Food Availability data, Americans consumed 49.7 pounds per person of traditional fall vegetables in their fresh form in 2012. Despite many of these traditional fall vegetables now being grown year-round in parts of the United States and eaten throughout the year, consumption has fallen 13.1 pounds per person since 1970. Much of this decline is due to consumption of fresh potatoes falling from 46.6 pounds per person in 1970 to 26.8 pounds in 2012. Per person consumption of potatoes in all forms (fresh, frozen, canned, dehydrated, etc.) has also fallen—by 10.8 pounds over the last 40 years. However, consumption of most of the other traditional fall vegetables in their fresh form has grown, including fresh onions, which were the second most consumed fresh fall vegetable at 8 pounds per person. Consumption of fresh pumpkins and sweet potatoes combined was 1.5 pounds per person in 2012. The data for this chart come from ERS's Food Availability (Per Capita) Data System.
Friday, October 31, 2014
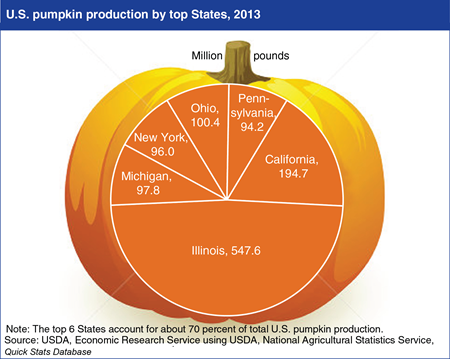
In 2013, the top 6 U.S. pumpkin producing states supplied over 1.13 billion pounds of pumpkins. Pumpkin production is widely dispersed, with crop conditions varying greatly by region. Illinois remains the leading producer of pumpkins, with a majority of the state’s production processed into pie filling and other uses. Supplies from the remaining top five pumpkin producing states are targeted primarily towards the seasonal fresh market for ornamental uses, as well as home processing. Demand for specialty pumpkins continues to expand as consumers look for new and interesting variations. In addition to the traditional jack-o-lantern market, there is an increase in pumpkins available in alternative colors (white, blue, striped), shapes (oblong, upright), skin (deep veins, warts) and sizes. This chart is based on information provided in Pumpkins: Background & Statistics.
Thursday, October 30, 2014
The severity and duration of the ongoing drought in California has raised concerns over its role in rising food prices at the grocery store, especially for fresh fruits and vegetables. In 2012, California produced nearly 50 percent (by value) of the nation’s vegetables and non-citrus fruit. Droughts in California are generally associated with higher retail prices for produce, but price increases are lagged due to the time it takes for weather conditions and planting decisions to alter crop production, which then influence retail prices. In 2005, following five years of drought, retail fruit prices rose 3.7 percent and retail vegetable prices increased 4 percent. Prices continued to rise in 2006, one year after drought conditions began to improve. However, other factors such as energy prices and consumer demand also affect retail produce prices. For example, prices for fresh produce fell in 2009 despite drought conditions, as the 2007-09 recession reduced foreign and domestic demand for many retail foods. As of October 2014, ERS analysts are forecasting fresh fruit prices to increase 4.5 to 5.5 percent in 2014 and vegetable prices to be 2 to 3 percent higher. This chart appears in the Food Prices and Consumers section of the 2014 California Drought page on the ERS website. Information on ERS’s food price forecasts can be found in ERS’s Food Price Outlook data product, updated October 24, 2014.
Friday, July 25, 2014
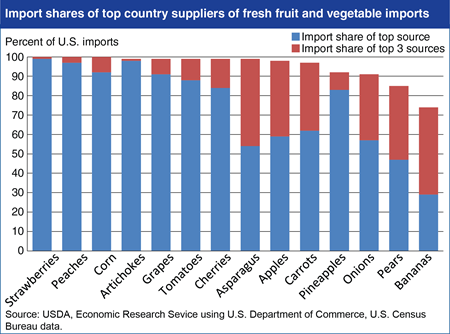
Imported fruits and vegetables account for a growing share of U.S. consumption and in most cases, U.S. imports are sourced from just a few supplying countries. Since 1990, U.S. per capita consumption of fresh fruits and vegetables has held steady, while the share of imports in U.S. fresh fruit consumption has risen from 12 to 34 percent and the import share for vegetables has risen from 10 to 25 percent. Trade has played a role in changing U.S. consumer diets by making produce available outside the traditional U.S. growing season, as well as providing access to a greater variety of produce. Despite the diversity of products available to U.S. consumers, the national sources of these products tend to be relatively concentrated among a few countries, with some variation across commodities. For strawberries, peaches, corn, artichokes, grapes, tomatoes, and cherries, more than 80 percent of imports come from a single country and nearly 100 percent come from just 3 suppliers. Overall, of the 29 imported goods studied by ERS, 18 had a single country supplying more than 80 percent of U.S. imports. Recent ERS research finds that source-country concentration does not appear to be related to U.S. phytosanitary regulations governing fresh fruit and vegetable imports, and may instead arise from market forces such as comparative advantage and specialization. Find more analysis in The Effects of Phytosanitary Regulations on U.S. Imports of Fresh Fruits and Vegetables, released July 2014.
Thursday, May 8, 2014
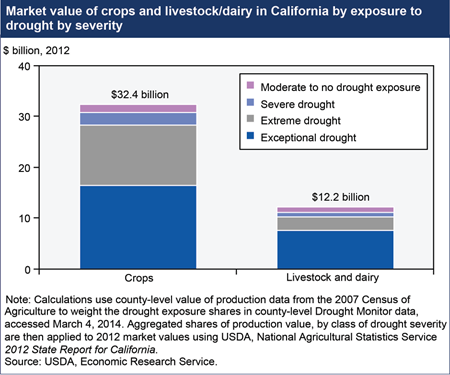
The driest year on record for California, following several prior years of drought, is likely to have an impact on the State’s agricultural production in 2014. On January 17, 2014, the Governor of California declared a drought emergency and as of March 4, over 94 percent of California’s nearly $45 billion agricultural sector was experiencing severe, extreme, or exceptional drought. The livestock sector is more directly exposed to exceptional drought (about 62 percent) than the crop sector (just over 50 percent). Given that much of California’s agricultural production takes place on irrigated land, effects of the drought depend on the cost and availability of water from irrigation in addition to local rainfall. Shortages of irrigation water sourced from snowfall are already evident, and the extent to which growers will be able to offset these reduced surface water supplies by pumping groundwater is uncertain. Find the table underlying this chart and additional analysis in California Drought 2014: Farm and Food Impacts.
Wednesday, January 8, 2014
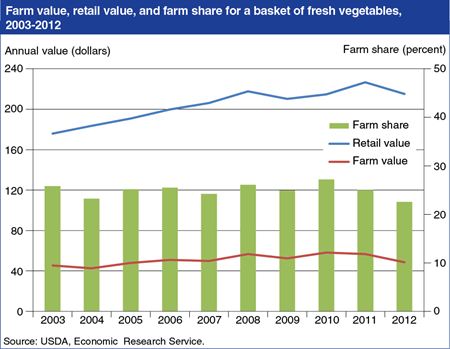
ERS compares retail food prices with prices received by farmers for various agricultural commodities. Over the past decade, the farm share—the ratio of grocery store prices (retail value) to prices received by farmers (farm value)—for a basket of 16 commonly-consumed fresh vegetables has fluctuated between 23 and 27 percent. In 2012, the retail value of the basket fell by 5 percent, but the farm value fell more, causing the farm share to decrease from 25 to 23 percent. The 15-percent decrease in the basket’s farm value was driven by lower prices at the farm gate for potatoes, tomatoes, and lettuce due in part to large harvests in 2012. These vegetables (along with onions) are given greater weight in the basket to reflect the large quantities that American households purchase. The statistics in this chart are based on the Price Spreads from Farm to Consumer data product on the ERS website, updated November 2013.
Tuesday, December 17, 2013
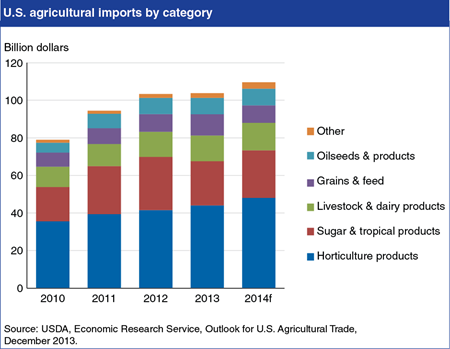
U.S. agricultural imports are forecast at a record $109.5 billion in fiscal year 2014 (October/September), up $5.7 billion from fiscal 2013, with horticultural products continuing to be the primary driver of import growth. The outlook is for relatively stable prices for major imports in fiscal 2014, while stronger U.S. income growth is expected to boost import volumes. Imports of horticultural products are projected to increase by $4 billion in fiscal 2014 as U.S. demand for fresh fruits and vegetables, processed fruit, wine, essential oils, and most other horticultural product categories continues to expand. Horticultural products have accounted for more than 40 percent of U.S. import growth since 2010. Imports from most supplying countries are expected to be higher in fiscal 2014 with Canada, Mexico, and the European Union—which together account for more than 59 percent of U.S. imports—contributing most of the gains. This chart is based on data provided in the Outlook for U.S Agricultural Trade.
Wednesday, August 7, 2013
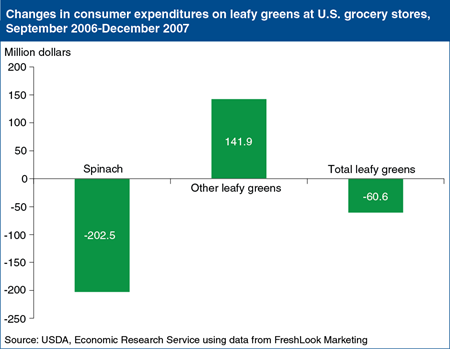
In January 2011, Congress passed the Food Safety Modernization Act, which included a set of mandatory food safety practices for U.S. produce growers. Produce imports would need to provide the same level of public health protection. The new regulations, designed to reduce the risk of foodborne illnesses, followed several major foodborne illness outbreaks traced to produce. In 2006, an outbreak traced to spinach contaminated with E. coli O157:H7 resulted in over 300 illnesses and 3 deaths. For about 2 weeks, most of the spinach in the United States was off the market following Government warnings not to eat bagged or fresh spinach. But even after the warnings were lifted, consumers were slow to return to their previous spinach purchases. ERS researchers analyzed retail scanner data and found that lost consumer expenditures at U.S. grocery stores totaled $60.6 million for all fresh leafy greens (spinach and lettuces) between the September 2006 outbreak and December 2007. Spinach sales fell by $202.5 million, while sales of lettuce grew by $141.9 million as some consumers switched from spinach to other leafy greens that were not implicated in the outbreak. The data for this chart appeared in "Consumers' Response to the 2006 Foodborne Illness Outbreak Linked to Spinach" in ERS’s Amber Waves, March 2010.
Thursday, May 23, 2013
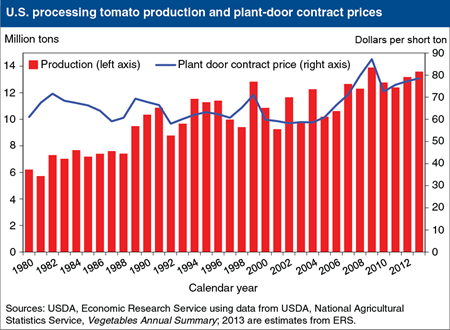
California processors, who account for the bulk of U.S. tomato processing, intend to contract for 2.8 percent more processing tomatoes in 2013 than the previous year. If the processors carry through with these early intentions, 2013 output is projected to be 13 million short tons, second only to the record-setting output of 13.3 million short tons in 2009. California produces almost 97 percent of the tomatoes grown nationally for processed products such as sauces, paste, soup, juice, and ketchup. When California’s intended contract production amount is combined with the assumed small amount of State open market (noncontract) purchases (0.1 million tons) and the expected production from other States (which averaged 0.5 million tons in 2010-12), the total U.S. crop of tomatoes for processing could reach 13.6 million tons in 2013. This chart along with accompanying analysis appears in Vegetables and Pulses Outlook: March 2013.
Friday, May 3, 2013
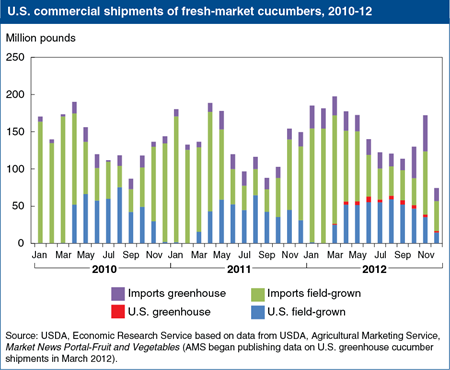
Mexico supplied 65 percent of fresh cucumber commercial shipments to the U.S. market in 2012. Imports are typically strongest early in the year when U.S. production is limited by cool weather and weakest in summer months during the height of the domestic season. Cucumbers grown under cover in greenhouse (including shadehouse) enclosures represent a growing source for the U.S. market from both U.S. growers and importers. In 2012, cucumbers grown under cover accounted for 20 percent of all shipments: 18 percent were imported and 2 percent were produced domestically. This chart is based on information provided in Cucumbers: Background Statistics in the ERS Newsroom, released on April 29, 2013.
Wednesday, April 24, 2013
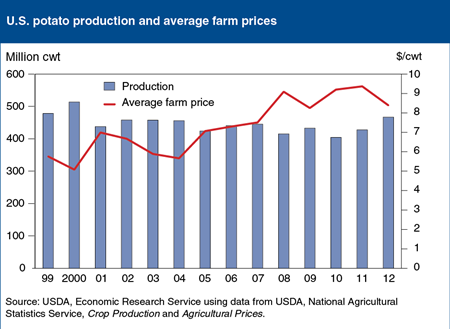
In 2012/13, U.S. potato production increased 37.5 million hundredweight (cwt) to 467 million cwt, making it the largest crop since 2000, when 523 million cwt was produced. Most of the increased output was in areas with high potato processing capacities, including Idaho and North Dakota. Fresh-market prices have fallen because of expanding supplies. Lower fresh market prices are forecast to pull down the average farm price to $8.39 per cwt, a drop of $1.02 relative to the 2011/12 marketing year price. If realized, the price decline will be the largest negative year-to-year change since the 1996/97 marketing year, when average prices fell by $1.84 per cwt in a 12-month period. This chart appears in Vegetables and Pulses Outlook, March 2013.
Wednesday, January 30, 2013
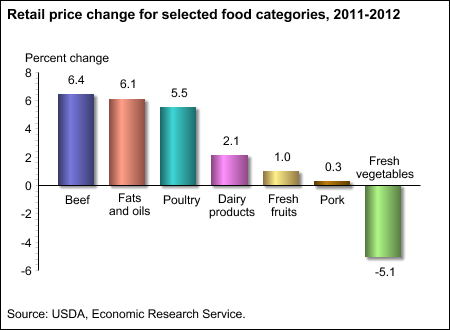
Overall food-at-home prices rose 2.6 percent in 2012, but this masked a great deal of variation across food categories. For the second consecutive year, beef and fats and oils showed the biggest percentage increases. Beef prices increased due to record low cattle inventories, while surging soybean prices pushed up prices for fats and oils. Poultry prices also increased substantially in 2012, due to a shift in demand away from high-priced beef and pork coupled with higher costs for broiler feed resulting from the Midwest drought. Pork prices, which saw major inflation in 2011, were flat in 2012 as wholesale prices fell due to rising hog inventories and falling exports. Vegetable prices fell 5.1 percent in 2012 as the unusually warm weather led to bumper crops for lettuce, tomatoes, and other vegetables, in sharp contrast to the poor harvests and high vegetable prices of 2011. More information on food price changes and forecasts can be found in the Food Price Outlook data product, updated January 24, 2013.


