ERS Charts of Note
Subscribe to get highlights from our current and past research, Monday through Friday, or see our privacy policy.
Get the latest charts via email, or on our mobile app for  and
and 
Tuesday, January 26, 2016
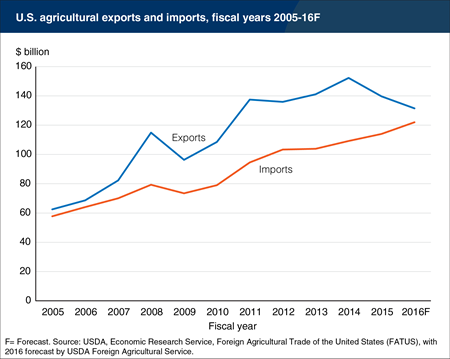
The value of U.S. agricultural exports and imports increased each year from fiscal year (FY) 2009 (October 1-September 30), through FY 2014, when the agricultural trade balance reached an all-time high of $43.1 billion. In FY 2015 the value of agricultural exports fell by 8.3 percent while imports grew by 4.5 percent, cutting the trade balance to $25.7 billion. The forecast for FY 2016 is for this pattern to continue: lower exports and higher imports are expected to push the agricultural trade surplus below $10 billion for the first time since 2006. Lower commodity prices account for some of the decline in the value of exports, but a stronger U.S. dollar also plays a role. Unlike in 2009 when both exports and imports fell due to the global recession, in 2015 and 2016 imports are growing at the same time that exports are falling, reflecting the greater purchasing power of the U.S. dollar in international markets and the reduced purchasing power of foreign currencies to buy U.S. goods. This chart is from the USDA/ERS Foreign Agricultural Trade of the United States(FATUS) dataset and the December Outlook for U.S. Agricultural Trade report.
_450px.png?v=5585.5)
Wednesday, January 13, 2016
The value of the U.S. dollar against other major currencies strengthened considerably in 2015, accelerating a trend that began in 2011. The agricultural trade-weighted exchange rate is a broad measure of the value of the dollar against 79 foreign currencies, weighted by their share of U.S. agricultural exports. The dollar exchange rate affects the price of U.S. commodities in foreign markets, with a stronger dollar making U.S. products more expensive in terms of the local currency of importing countries. On the other hand, a stronger dollar makes U.S. imports less expensive in dollar terms. Since the dollar exchange rate affects the relative price of U.S. and foreign commodities in global markets, it can have important implications for agricultural trade. With the strengthening of the dollar in 2015, agricultural exports are expected to fall below 2014 levels, while imports are forecast to increase. ERS exchange rate projections used for the USDA Agricultural Projections to 2025 report (the current Agricultural Baseline) suggest the dollar will continue to gain strength—but at a slower pace—in 2016 and 2017, before trending lower from 2018 through 2025. This chart is based on the International Macroeconomic Data Set.
Thursday, January 7, 2016
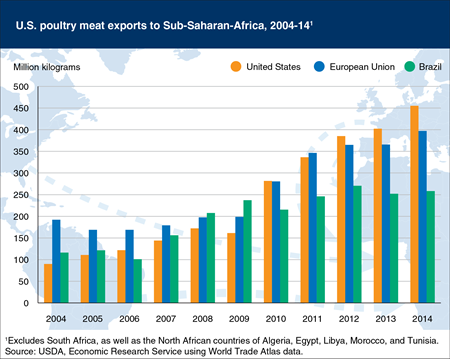
Over the past decade, Africa has emerged to become an important market for U.S. poultry exports. Rising incomes, population growth and urbanization support strong demand for poultry across much of Africa, while limitations in domestic production have led to a heavy reliance on imports from the United States, the European Union, and Brazil. For the United States, the overwhelming share (93 percent) of poultry exports to Africa are sent to Sub-Saharan Africa. Since 2012, the United States has been the leading supplier of poultry to this region, followed by the European Union and Brazil. Africa’s share of U.S. poultry exports grew to 12.6 percent in 2014, making it the second largest destination after Mexico (23.8 percent) and ahead of Hong Kong (8.6 percent), China (5.8 percent) and Canada (3.7 percent). U.S. exports to Sub-Saharan Africa reached 455 million kilograms in 2014 (compared to 487 million kilograms to all of Africa), valued at $523.6 million. This chart is from the December 2015 Livestock Dairy and Poultry Outlook report.
Friday, December 18, 2015
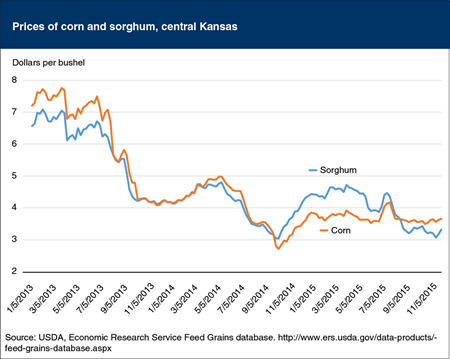
Sorghum is a common feed grain that can substitute for corn in livestock feed rations and in the production of ethanol. Corn tends to be preferred over sorghum as a feed ingredient, so sorghum typically sells at a discount compared to corn in global markets. Throughout much of the 2014 marketing year (September-August) this situation reversed, and due in large part to strong demand from China, sorghum began selling at a premium over corn, at times exceeding 20 percent. As a result, sorghum use for ethanol production declined while acreage for the 2015 harvest increased to result in a record-large U.S. crop. This, combined with recent changes in China’s import policy that could reduce U.S. sorghum’s export prospects for the 2015 crop, has greatly increased the availability of sorghum in domestic markets for feeding and ethanol production. Because of the greater availability of sorghum, the price fell back below the price of corn and is now more in line with historic relationships. Given these lower prices, sorghum use for ethanol production is expected to expand more than fivefold this year, and U.S. shipments to Mexico, which were hampered by the high prices for the 2014 crop, are expected to at least partially resume during the current marketing year, which began in September 2015. This chart is based on the October 2015 Feed Outlook and the ERS Feed Grains database.
Friday, November 13, 2015
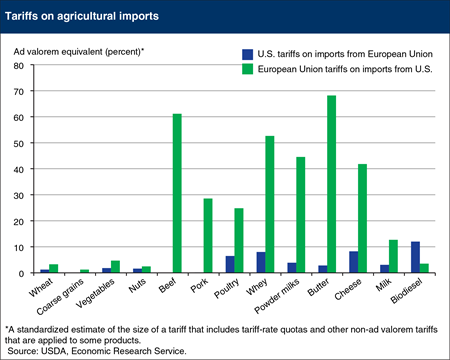
The United States and the European Union (EU) are major producers of most agricultural goods and account for a significant share of global agricultural trade. While overall trade between the United States and the EU has grown over time, agricultural trade has decreased, due in part to the relatively high trade barriers facing U.S. agricultural exports to the EU. While the simple average applied tariff for all goods is estimated at 3.5 percent for EU exports to the United States and 5.5 percent for U.S. exports to the EU, agricultural commodities tend to face larger tariffs; the simple average tariffs for agricultural goods are 4.7 percent for EU exports to the United States and 13.7 percent for U.S. exports to the EU. In addition, many agricultural goods face tariff-rate quotas (TRQs) that allow the tariff to change depending on the quantity imported. This chart is from the ERS report, Agriculture in the Transatlantic Trade and Investment Partnership: Tariffs, Tariff-Rate Quotas and Non-Tariff Measures.
Monday, November 9, 2015
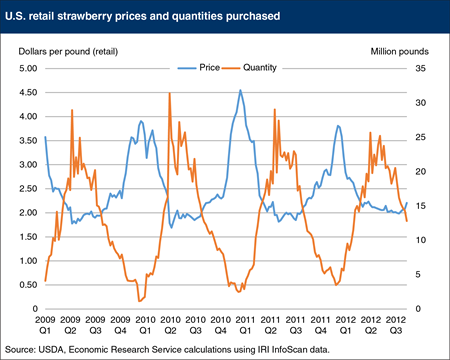
The U.S. retail supply of fresh produce differs from that of manufactured foods, which are available year-round with stable prices. For many produce items, the seasonality of domestic production limits the quantity available in winter to a small fraction of that available during spring or summer, leading to higher retail prices in the off-season. For example, retail strawberry prices in late December can often be more than twice as high as prices in May. Until the early 2000s, berries were not available to most consumers outside the short domestic production seasons. Advances in trade and technology have changed that, and imports—particularly during the fall and winter months, when the supply of domestic berries is at its lowest—are leading to more consistent year-round availability and lower off-season prices. Consumers benefit through the potential for lower food expenditures and greater variety in their diets. This chart is from the ERS report, Measuring the Impacts of Off-Season Berry Imports.
Thursday, November 5, 2015
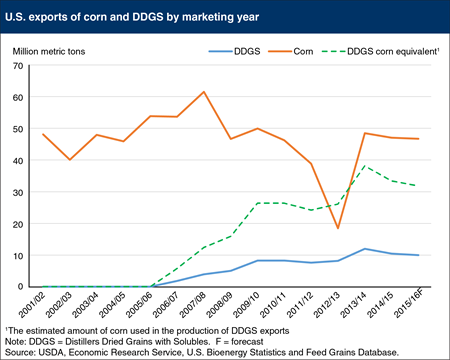
U.S. exports of distillers dried grains with solubles (DDGS)—a common byproduct of corn ethanol production—have grown from nearly zero in 2005 to as high as 12 million metric tons in the 2013/14 marketing year (September/August), with 10 million metric tons forecast for export in the 2015 marketing year. This increase in exports reflects the expansion in ethanol production that occurred over this same period, rising from just under 4 billion gallons in 2005 to more than 14 billion gallons in 2014. While U.S. corn exports still exceed the volume of DDGS exported, these markets are linked because each ton of corn processed into ethanol produces just under a third of a ton of DDGS. Ethanol production accounted for 38 percent of U.S. corn use in 2014/15, while exports were less than 14 percent, but DDGS exports represent another way that U.S. corn production enters global markets. This chart is from the ERS data products, U.S. Bioenergy Statistics and the Feed Grains Database.
Monday, November 2, 2015
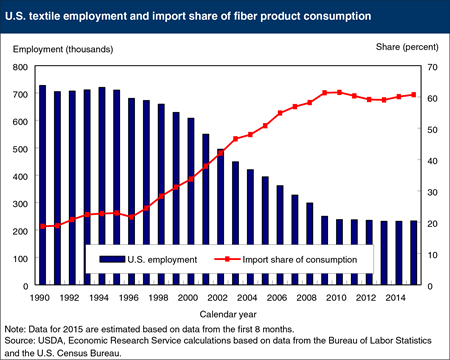
Employment at U.S. textile plants has fallen by nearly two-thirds over the past 20 years as fabric production and apparel manufacturing shifted overseas in search of lower labor and production costs. Today, more than 60 percent of clothing and other textile products purchased by U.S. consumers is produced outside of the United States. However, both the sharp decline in U.S. textile employment and the rise in import share of U.S. fiber consumption began to level off around 2009. In recent years, the U.S. textile industry—particularly the capital-intensive yarn and fabric production industry—has shown signs of a modest rebound. Cotton consumption by U.S. textile mills in marketing year 2015 (August/July) is forecast at 3.7 million bales, up 3.5 percent from a year ago and 12.1 percent from its 2011 low. In 2014, U.S. textile mill employment showed its first gain since 1994—up 0.2 percent. Investment in U.S. cotton spinning by firms from China and India is underway as well, reflecting the changes in global textile markets since the Multi-Fibre Arrangement (which governed world trade in textiles and garments) expired on January 1, 2005. This chart is from the October Cotton and Wool Outlook report.
Thursday, October 22, 2015
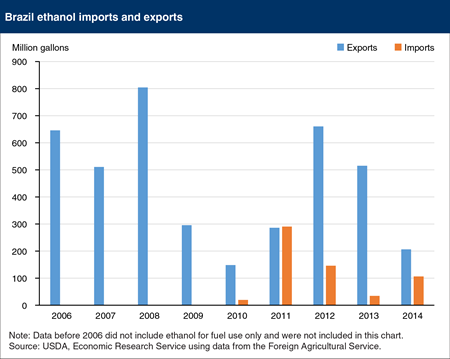
Brazil had historically been the world’s largest net exporter of ethanol, but rising sugar prices (sugar is Brazil’s primary ethanol feedstock) and growing demand for domestic ethanol consumption led to lower ethanol exports, particularly in 2009 and 2010. In 2010 the Brazilian Government lifted a tariff on ethanol imports through the end of 2015, leading to the country’s first imports of ethanol. Imports grew rapidly in 2011 and resulted in Brazil being a net ethanol importer—by a small margin—for the only time in its history. Ethanol exports recovered in 2012 but have declined each year since, while imports remain an important source of supply. Since 2010, the United States—now the world’s largest ethanol exporter—has been the largest supplier of ethanol to Brazil, followed distantly by the EU. This chart is based on the ERS report, Biofuel Use in International Markets: the Importance of Trade.
Friday, September 25, 2015
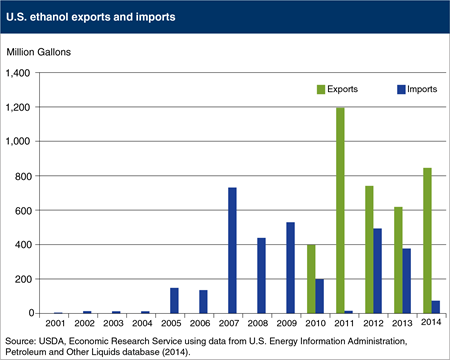
Between 2001 and 2014, global biofuel production and use grew rapidly, driven by a combination of rising gasoline prices, falling prices of biofuel inputs, and policies mandating use of renewable fuels. These same factors also led to an expansion of global trade in biofuels. The United States is the world’s largest producer and consumer of ethanol, and prior to 2010 relied partly on imports to meet domestic demand. But beginning in 2010, the United States emerged as a net exporter of ethanol, reflecting the “blend wall” that limits the ethanol content of gasoline used in most conventional vehicles to 10-percent ethanol, while demand for biofuels from other countries, particularly the EU and Brazil, continued to grow. The United States has remained a net exporter of ethanol each year since 2010, and since 2011 has been the world’s largest exporter of ethanol. In 2014, oil prices declined by more than half, pressuring U.S. ethanol consumption; however, the market remained strong due to U.S. government policies mandating ethanol use, the use of ethanol as an octane enhancer, and a large export market. This chart is from Biofuel Use in International Markets: The Importance of Trade, EIB-144, September 2015.
Thursday, August 20, 2015
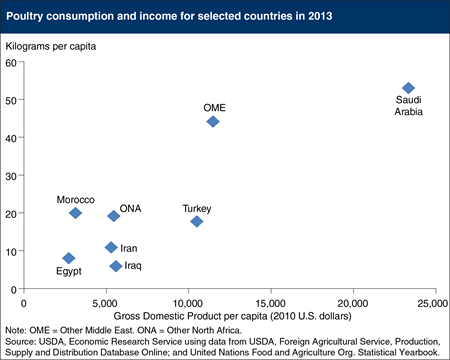
Meat consumption is correlated with income around the world, and the Middle East and North Africa (MENA) region is no exception. While income levels vary widely across the region, income growth continues to outpace the world average with implications for MENA’s future meat demand, particularly poultry. Per capita meat consumption has more than doubled from around 12 kilograms (kg) in the 1990s to about 24 kg in 2010, and USDA’s Baseline Projections suggest this growth will continue well into the future. As with other commodities, the growth of poultry consumption has exceeded gains in domestic production, leading to rising imports, and MENA is now the largest regional importer of poultry products in the world. Domestic meat production is also growing rapidly; regional poultry production grew by nearly 5 percent annually from 2000 to 2011, leading to growth in demand for animal feeds, primarily corn and soybean meal. The chart is from Middle East and North Africa Region: An Important Driver of World Agricultural Trade.
Friday, July 31, 2015
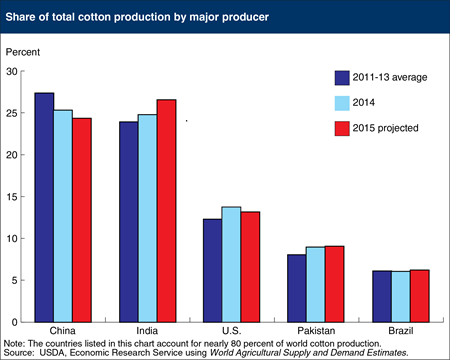
Cotton production is concentrated among only a few countries, with the world’s five largest cotton-producing countries forecast to produce nearly 80% of world production in 2015/16. India and China together account for more than 50 percent of global cotton production, but production in China is declining while increasing in India. In 2015/16, India is expected to surpass China as the world’s largest cotton producer for the first time on record, with a crop forecast at 29.5 million bales, pushing India’s share of world production to 26.5 percent. For China, 2015/16 production is forecast to decrease 10 percent (3 million bales) to 27 million bales, the lowest since 2003/04. China’s share of global production is forecast at 24 percent as area continues to trend lower. The difference in the production outlook for China and India can be traced in part to China’s rising wages and increasing production costs, while new technology and production practices have driven India’s yields and output significantly higher in recent years. Its output surpassed the United States for the first time in 2006 and is now poised to surpass China, which had been the world’s largest cotton producer since 1982. This chart is from July 2015 Cotton and Wool Outlook report.
Wednesday, July 22, 2015
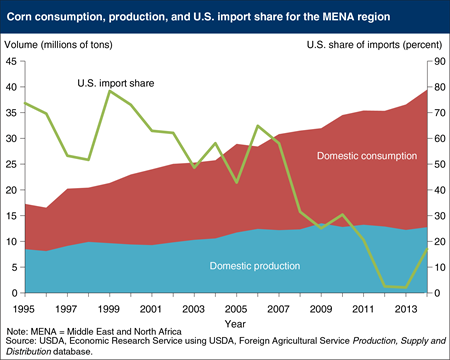
The Middle East and North Africa (MENA) region accounts for a significant and growing portion of worldwide food and feed imports. Expansion of the region’s livestock sector—particularly poultry—has boosted demand for feed, driving steady growth in corn consumption over the past 20 years. Given the disparity between MENA’s limited corn production capacity and its growing demand for livestock feed, corn imports have steadily risen, except for a temporary drop in 2009 associated with the spike in global food prices. The U.S. share of the region’s corn imports has declined from about 70 percent during the mid-1990s to around 10 percent in recent years, the result of reduced U.S. exportable surpluses, higher U.S. prices following the 2012 U.S. drought, and increased competition from other suppliers. Major U.S. competitors in the MENA corn market include Ukraine and Russia, which enjoy transport cost advantages to the MENA region, but can experience frequent weather-induced fluctuations in production. The leading destinations of MENA-bound U.S. corn are Saudi Arabia and Egypt. The chart is from Middle East and North Africa Region: An Important Driver of World Agricultural Trade, AES-88.
Tuesday, June 30, 2015
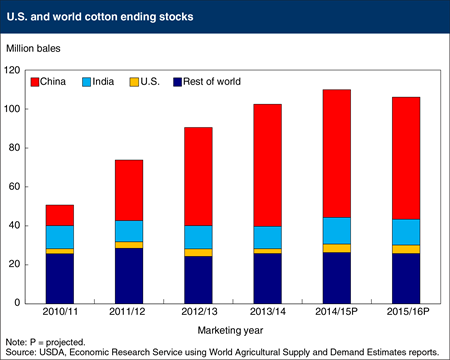
Global cotton stocks have risen over the last several years, largely the result of growth in China’s stocks. Government policies in China supported national reserve purchases of domestic cotton and, at the same time, significant imports of raw cotton. These policies strengthened global cotton prices by keeping China’s supplies out of the marketplace while also encouraging production in other countries. Stocks in China at the end of 2014/15 (August/July marketing year) are estimated at a record 65.6 million bales, or 60 percent of global stocks. For 2015/16, policy adjustments in China are expected to reduce stocks slightly to 62.6 million bales, with its share of world stocks remaining unchanged. Globally, cotton stocks are expected to decline in 2015/16 for the first time in 6 years, but would still remain more than double the level in 2010/11, resulting result in only a slight decrease in the world stocks-to-use ratio. As a result, the 2015/16 world cotton price is expected to remain near the current season’s average of about 71 cents per pound, the lowest in 6 years. This chart is from the June 2015 Cotton and Wool Outlook.
Friday, June 19, 2015
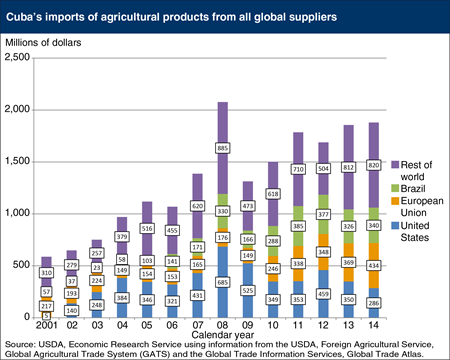
Establishing a more normal economic relationship with Cuba has the potential to foster additional growth in U.S.-Cuba agricultural trade. With the loosening of the U.S. trade embargo in 2000 to allow for sales of agricultural products and medicine, the United States soon became Cuba’s leading foreign supplier of food and agricultural products, but prohibitions on issuing credit continue to limit U.S. potential in this market. Cuba’s total agricultural imports have been trending upward over the past decade, reaching an average of $1.8 billion per year during 2012-14. The United States was Cuba’s second leading supplier of agricultural imports during this period ($365 million), while the European Union ($383 million) and Brazil ($348 million) were Cuba’s first and third leading suppliers. Together, these 3 trade partners supplied 61 percent of Cuba’s agricultural imports, with the U.S. share equaling 20 percent. From 2003 to 2012, the United States was Cuba’s leading supplier of agricultural imports, but it slipped to second in 2013 and third in 2014. This chart is from U.S. Cuba Agricultural Trade: Past, Present and Possible Future.
Friday, May 8, 2015
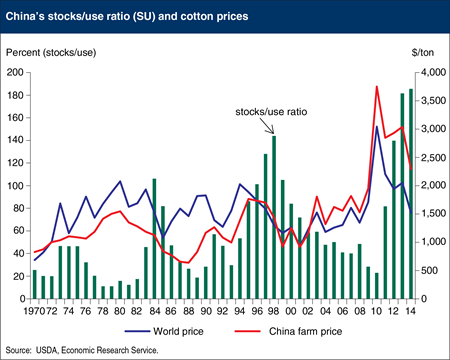
China has been the world’s largest cotton producer and consumer of cotton for decades, and it became the largest importer shortly after its 2001 accession to the World Trade Organization (WTO). Economic growth has transformed its agriculture sector, driving wages higher and spurring greater mechanization in many areas; however, small scale cotton production persists with limited mechanization and high production costs, especially in eastern China. To support its farmers, China introduced a support price for cotton in 2011, and from 2011 to 2013 acquired more than 40 percent of China’s cotton crop in an attempt to maintain domestic cotton prices 50-60 percent above world prices. This has resulted in China’s government owning a large amount of cotton stocks, equivalent to nearly 200 percent of its annual use and half of the world’s consumption. New policies in 2014 included a shift from stock acquisition toward target-price based direct subsidies and a sharp reduction in cotton import quotas. Reduced purchases by China’s government and a transition of cotton stockpiles toward long run historic levels could result in years of lower imports, and a decline in world prices. This chart is based on Cotton Policy in China, CWS-15c-01, March 2015.
Wednesday, May 6, 2015
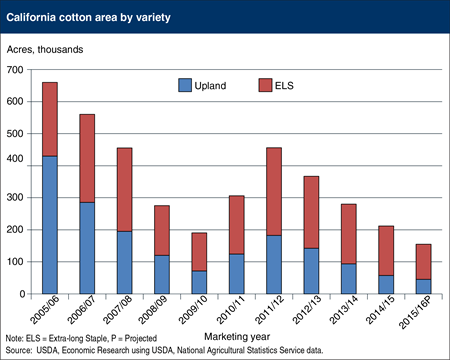
California is the fourth largest cotton producing state, and production there depends heavily on irrigation. California is the dominant producer of the longer and finer quality “Extra-long Staple” (ELS) fiber that is used in high-value products such as sewing thread and more expensive apparel and home furnishing items. During the past three years, California production accounted for 95 percent of the total ELS cotton in the United States. The on-going drought that began in 2012 remains a major concern for agricultural producers as reservoir levels and water supplies have been reduced significantly; record-low water allocations were seen in 2014, affecting the type and amount of crops some farmers can produce. While acreage planted to upland and ELS varieties varies from year to year, the lingering drought in California is expected to limit acreage once again in 2015. USDA’s Prospective Plantings report released at the end of March indicated a 27-percent decrease in the State’s total cotton area for 2015, with ELS area declining 29 percent and upland area decreasing 21 percent. While California’s total cotton area would be at its lowest since 1932, the decline is similar to the one experienced during the previous statewide drought of 2007-09. This chart is based on information in Cotton and Wool Outlook: April 2015.
Tuesday, May 5, 2015
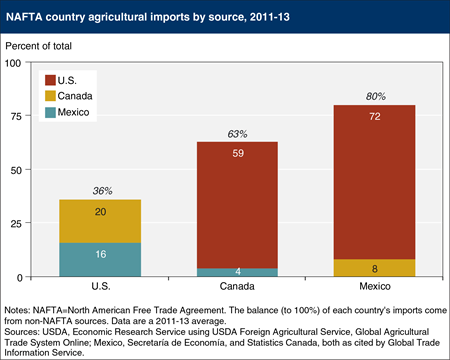
Intraregional agricultural trade among the United States, Canada, and Mexico has grown since the implementation of the North American Free Trade Agreement (NAFTA) in 1994. In 2011-13, agricultural imports from NAFTA partners accounted for 80 percent of Mexico’s total agricultural imports, 63 percent of Canada’s imports, and nearly 40 percent of all U.S. agricultural imports. Roughly two-thirds of U.S. agricultural imports from Mexico consist of beer, vegetables, and fruit. These imports are closely tied to Mexico's historical expertise in producing alcoholic beverages and a wide range of fruit and vegetables, along with favorable climates with growing seasons that largely complement those of the United States. Meat, grains, vegetables, fruit, and related products make up roughly 60 percent of U.S. agricultural imports from Canada, while grains, fruit, vegetables, meat, and related products accounted for about 61 percent of U.S. agricultural exports to Canada. Grains, oilseeds, meat, and related products make up about three-fourths of U.S. agricultural exports to Mexico. This chart is based on data found in NAFTA at 20: North America’s Free-Trade Area and Its Impact on Agriculture, February 2015.
Friday, April 24, 2015
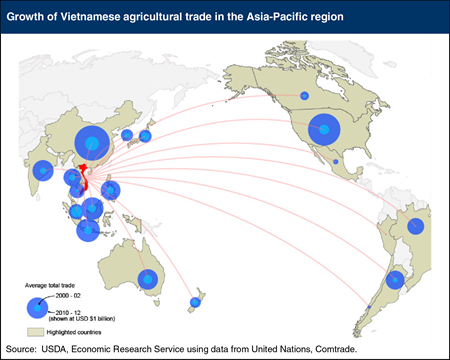
After Vietnam joined the Association of Southeast Asian Nations (ASEAN), its agricultural trade within the 10-member regional trade bloc expanded. The normalization of trade with the United States in 2001 and WTO accession in 2007 also provided catalysts for growth and integration. Subsequent preferential trade agreements (PTAs) have led to tariff reductions that have only recently begun to take effect. Today, Vietnam’s agricultural trade is still led by trade with its ASEAN partners; however, China has become a major export market and Vietnam’s largest trade partner, while the United States is a close second, and also the largest source of imports. Trade growth with both partners has been significant, growing 7- and 10-fold, respectively, while imports from South America have also grown. The Trans-Pacific Partnership (TPP) agreement, now under negotiation, is viewed as important to Vietnam’s long-term economic strategy as it could potentially secure markets abroad and facilitate the flow of foreign investment. Vietnam seeks greater access for its textile and footwear industry, while exporting countries, including the United States, see Vietnam as a market with growth potential. This report is from the Amber Waves article, “Japan, Vietnam, and the Asian Model of Agricultural Development and Trade.”
Tuesday, April 14, 2015
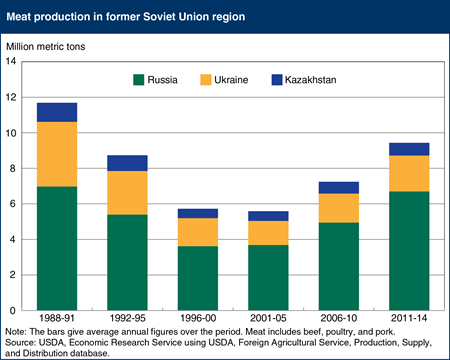
During the last decades of the USSR, the livestock sector grew substantially as the state heavily subsidized both the production and consumption of livestock goods. After the breakup of the Soviet Union, the livestock sectors of Russia, Ukraine, and other countries of the former USSR contracted. By the end of the 1990s, both animal inventories and meat production were half (or even less) than at the start of the decade, as these countries’ governments could no longer afford the large subsidies provided to the sector during the Soviet period. Beginning in 2000, the livestock sector in Russia, Ukraine, and Kazakhstan began to rebound, though output has not yet reached pre-reform levels. As gross domestic product (GDP) began to rise the governments in these countries had the financial resources to restore some of the subsidies to the sector. Russia also protected the sector with a system of tariff rate quotas on meat imports imposed in 2003. In addition, large modern livestock producers are increasing the efficiency and productivity of operations. The poultry and pork industries have grown, but the beef industry has yet to experience a turnaround. This chart is from the report, Rising Grain Exports by the Former Soviet Union Region: Causes and Outlook.


