ERS Charts of Note
Subscribe to get highlights from our current and past research, Monday through Friday, or see our privacy policy.
Get the latest charts via email, or on our mobile app for  and
and 
Thursday, April 8, 2021
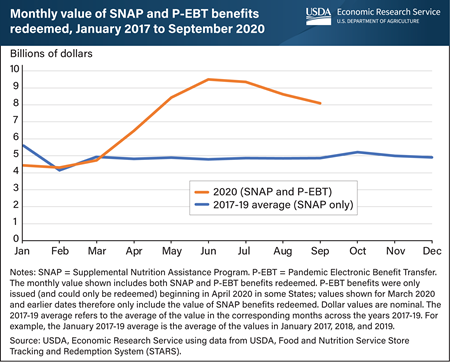
The U.S. Government expanded existing food assistance programs and introduced new ones in response to the COVID-19 pandemic and subsequent economic contraction in the United States in 2020. Some States began issuing monthly supplemental emergency allotments to Supplemental Nutrition Assistance Program (SNAP) households in March 2020, with the rest beginning to do so in April 2020. All States issued Pandemic Electronic Benefit Transfer (P-EBT) benefits to households with children who missed free or reduced-price school meals during the 2019-20 school year; the earliest States began issuing P-EBT benefits in April 2020. This led to a rapid increase in the dollar amount of food assistance benefits issued to households and redeemed for groceries during the pandemic. The value of total monthly redemptions roughly doubled from $4.7 billion in March 2020 to $9.5 billion in June 2020. Most P-EBT benefits for the 2019-20 school year were issued in May and June 2020, leading total redemptions to peak in June and decline over the next three months. By September, redemptions amounted to $8.1 billion. Overall, an average of $8.4 billion per month in combined SNAP and P-EBT benefits were redeemed from April through September 2020—an increase of 74 percent compared with the average value of benefits redeemed during the same 6 months in 2017-19. This chart is based on a chart in the USDA, Economic Research Service’s COVID-19 Working Paper: Supplemental Nutrition Assistance Program and Pandemic Electronic Benefit Transfer Redemptions during the Coronavirus Pandemic, released March 2021.
Wednesday, March 31, 2021
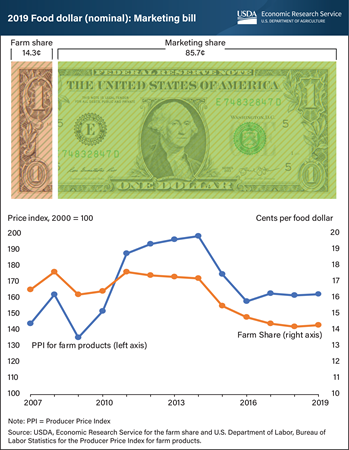
On average, U.S. farmers received 14.3 cents for farm commodity sales from each dollar spent on domestically produced food in 2019, up from a newly revised estimate of 14.2 cents in 2018. Known as the farm share, this amount increased slightly after 7 consecutive years of decline. Average prices received by U.S. farmers (as measured by the Producer Price Index for farm products) have been relatively stable for the last three years, following sharp declines in 2015 and 2016. The USDA, Economic Research Service (ERS) uses input-output analysis to calculate the farm and marketing shares from a typical food dollar, including food purchased at grocery stores and at eating-out establishments. The marketing share covers the costs of getting domestically produced food from farms to points of purchase, including costs related to packaging, transporting, processing, and selling to consumers at grocery stores and eating-out places. The farm and marketing shares of the food dollar in 2019 reflect conditions before the COVID-19 pandemic. Beginning in March 2020, the ERS monthly Food Expenditure Series reported sharp declines in the share of eating-out food dollars. Farmers receive a smaller share from eating-out dollars because of the added costs for preparing and serving meals at restaurants, cafeterias and other food-service establishments. The data for this chart can be found in ERS’s Food Dollar Series data product, updated March 17, 2021.
Wednesday, March 24, 2021
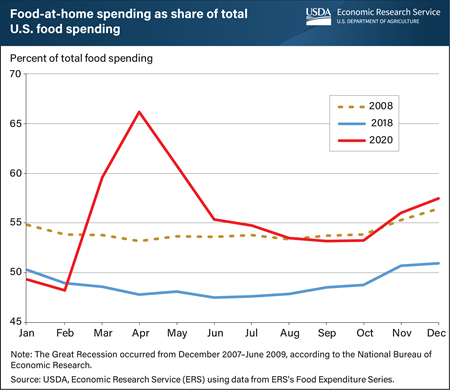
The share of food dollars spent at grocers, supercenters, and other food-at-home (FAH) retailers in the United States rose in 2020 above Great Recession levels in 2008 as the COVID-19 pandemic disrupted the way people consumed food. The share of spending at FAH establishments began a sharp climb from 48 percent in February 2020, and by April 2020, 66 percent of food spending was devoted to at-home consumption. Shifts to greater FAH spending occurred as states issued stay-at-home mandates and people generally avoided public gatherings. The economic recession likely exacerbated this shift as FAH purchases are more cost-efficient. Even after its April 2020 peak, the share of FAH spending reached the same level in August 2020 as it was in August 2008, during the Great Recession. After that, food spending shares generally followed typical seasonal patterns, although at a level more like the Great Recession than 2018, remaining stable with a slight increase in FAH spending in the colder, winter months. ERS researchers will continue to examine food expenditure data to determine whether this change will endure beyond the pandemic and recession. The data for this chart come from the USDA, Economic Research Service’s Food Expenditure Series data product.
Wednesday, January 13, 2021
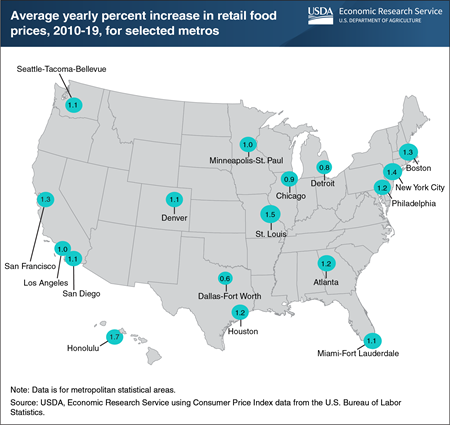
From 2010 through 2019, retail—or grocery—food prices rose an average of 1.2 percent a year nationally. However, food-at-home price inflation varies by locality. Retail food prices rose an average of 1.7 percent a year in Honolulu over the decade, while price inflation in the Dallas-Fort Worth area averaged 0.6 percent a year. Averaging 10 years of annual data smooths out year-to-year “noise”—volatile price swings that are not indicative of the overall trend. Differences in transportation costs and retail overhead expenses, such as labor and rent, can explain some of the variation among cities because retailers often pass local cost increases on to consumers in the form of higher prices. Furthermore, differences in consumer preferences among cities for specific foods may help explain variation in inflation rates. For example, a city whose residents strongly prefer foods with less price inflation (such as fresh fruits and vegetables at 1.1 percent a year in 2010–19) might experience lower food-at-home price inflation than a city whose residents buy more beef and veal, which increased an average of 3.6 percent a year in 2010–19. This chart appears in an Economic Research Service data visualization, Food Price Environment: Interactive Visualization, released September 2020.
Friday, December 11, 2020
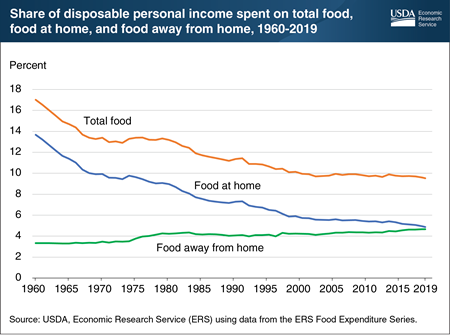
In 1960, U.S. consumers spent an average of 17.0 percent of disposable personal income (DPI) on food. By 2019, this share had shrunk to 9.5 percent. This decrease was driven by a decline in the share of income people spent on food at home. The share of DPI spent on food purchased at supermarkets, supercenters, convenience stores, and other retailers fell from 13.7 percent in 1960 to 5.7 percent in 2000. Over the same period, the share of DPI spent on food purchased from restaurants, fast-food places, schools, and other away-from-home eating places rose from 3.3 percent to 4.2 percent. The declining share of income spent on food at home reflects, in part, efficiencies in the U.S. food system (which kept inflation for food-at-home prices generally low) and rising disposable incomes. A slower decline in share of income spent on food at home after 2000 could reflect U.S. consumers opting to prepare more meals at home and purchasing more expensive grocery store options than they did in earlier decades. This chart appears in “Average Share of Income Spent on Food in the United States Remained Relatively Steady From 2000 to 2019,” in the Economic Research Service’s Amber Waves magazine, November 2020.
Tuesday, November 10, 2020
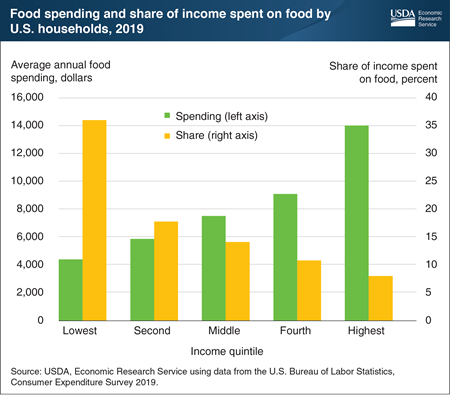
Households spend more money on food as their incomes rise, but the amount spent represents a smaller share of their overall budgets. In 2019, households in the lowest income quintile, with an average 2019 after-tax income of $12,236, spent an average of $4,400 on food (about $85 a week). Households in the highest income quintile, with an average 2019 after-tax income of $174,777, spent an average of $13,987 on food (about $269 a week). The three-fold increase in spending between the lowest and highest income quintiles is not the result of a three-fold increase in consumption, however. Rather, as people gain more disposable income, they often shift to more expensive food options, including dining out. Even with this shift, as income increases, the percent of income spent on food goes down. In 2019, food spending represented 36.0 percent of the lowest quintile’s income, 14.1 percent of income for the middle quintile, and 8.0 percent of income for the highest quintile. The statistics in this chart predate the coronavirus pandemic and its impacts. This chart appears in the Food Prices and Spending section of the Economic Research Service’s Ag and Food Statistics: Charting the Essentials data product.
Wednesday, October 28, 2020
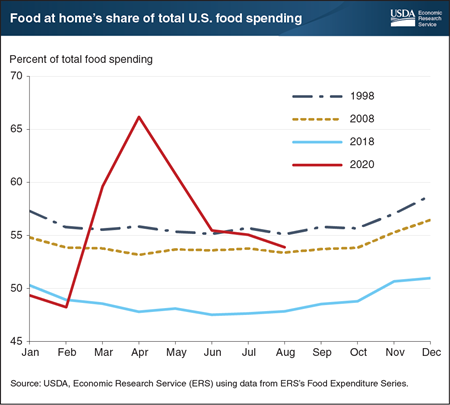
The share of U.S. food expenditures occurring at grocery stores, supercenters, and other food-at-home retailers typically displays a consistent seasonal pattern. U.S. consumers devote relatively more money to food-at-home spending in the winter months—a time of Thanksgiving and holiday gatherings. The summer months see the highest share of spending at food-away-from-home places such as restaurants, cafeterias, and other eating-out places. While seasonal patterns have stayed constant until 2020, the share of total food spending dedicated to food at home has not. In 1998, food at home’s share was above 55 percent of total food spending throughout the year. Ten years later, 2008 saw the share of food spending devoted to food at home decrease a few percentage points despite the Great Recession of 2007-2009. In 2018, food at home’s share was below 50 percent in all but the winter months. The COVID-19 pandemic has upended past seasonal trends and expanded food at home’s share of total food spending. Food at home in August 2020 accounted for 54 percent of total food spending, after peaking at 66 percent in April 2020. The data for this chart come from the Economic Research Service’s Food Expenditure Series data product, updated October 16, 2020.
Friday, August 28, 2020
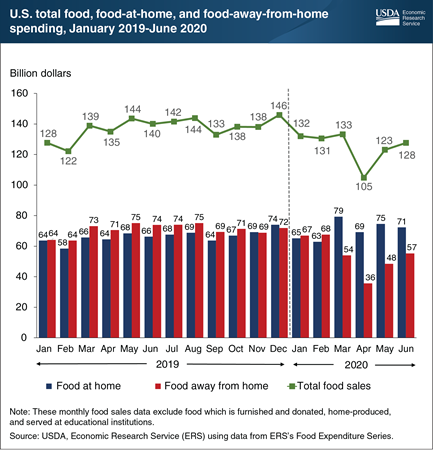
In 2019, before the COVID-19 pandemic, U.S. consumers, businesses, and government entities spent an average of $137.4 billion per month on food. Normal seasonal variations were present, with total food spending being lowest in January and February and highest in May, August, and December. Early 2020 followed the same pattern, with lower-than-average total food spending in January and February, but this trend continued into the spring with spending on food falling to $105 billion in April 2020, as spending at food-away-from-home establishments—restaurants, school cafeterias, sports venues, and other eating places—dropped to $36 billion. Spending on food-away-from-home rebounded in May and June but remained below 2019 spending in those months. Total food sales rose in May and June 2020 but were still lower than a year ago. Higher monthly sales at grocery stores, supercenters, convenience stores, and other food-at-home retailers compared with last year were not enough to compensate for the lower spending at food-away-from-home establishments. The data in this chart, along with more information on U.S. food sales and expenditures, can be found in the Economic Research Service’s Food Expenditure Series data product, updated August 20, 2020.
Wednesday, August 12, 2020
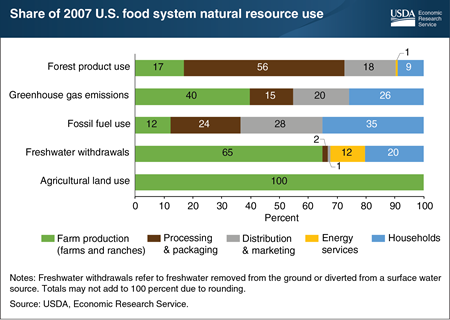
Knowing where natural resource use accumulates is fundamental to understanding what factors influence resource-use decisions. A recent Economic Research Service (ERS) study estimated natural resource use by the U.S. food system in 2007 (2007 data were the latest available with the level of detail needed for the analysis). Farm production was the smallest user of fossil fuels (12 percent of fossil fuel use); households were the largest users (35 percent). Over 40 percent of greenhouse gas emissions in food production were from farms and ranches, followed by households, and then companies that distribute and market food. For forest products, the greatest use occurred during food processing and packaging, with paper-based packaging accounting for most of this use. Farm production was the dominant user of freshwater withdrawals due to irrigation, but slightly over a third of water use by the food system in 2007 occurred after the farm, including in household kitchens (20 percent) and in the energy industry (12 percent). This chart appears in the ERS report, Resource Requirements of Food Demand in the United States, and Amber Waves article, “A Shift to Healthier Diets Likely To Affect Use of Natural Resources,” May 2020.
Friday, August 7, 2020
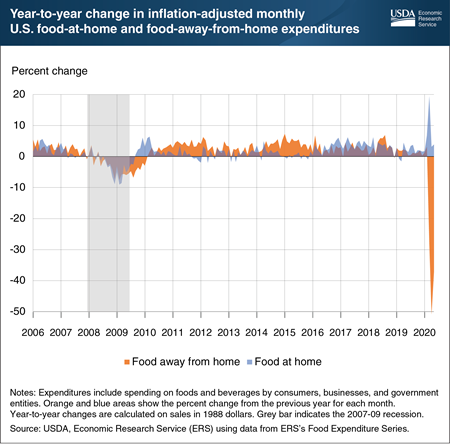
The COVID-19 pandemic and resulting stay-at-home orders dramatically impacted Americans’ food spending in spring 2020. Inflation-adjusted expenditures at grocery stores, supercenters, convenience stores, and other food-at-home retailers were 19.3 percent higher in March 2020 compared with March 2019. This same spending was 3.1 percent higher in April 2020 than in April 2019, and 3.9 percent higher in May 2020 than in May 2019. Comparing spending for the same month accounts for seasonal food spending patterns. Inflation-adjusted March 2020 expenditures at eating-out establishments—restaurants, school cafeterias, sports venues, and other eating-out places—were 28.3 percent lower than March 2019 expenditures. In April and May 2020, food-away-from-home spending was down 50.8 and 37.2 percent, respectively, when compared to the same months one year ago. During the Great Recession of 2007-09, expenditures on both food at home and food away from home decreased, with the largest decrease occurring in February 2009. Unlike previous economic shocks, COVID-19 led to a pronounced substitution from food away from home to food at home in part due to the spring 2020 stay-at-home orders and the fact that many eating-out businesses were operating at a limited capacity or had ceased operations completely. The data in this chart are from the Economic Research Service’s Food Expenditure Series data product, updated July 21, 2020.
Friday, July 24, 2020
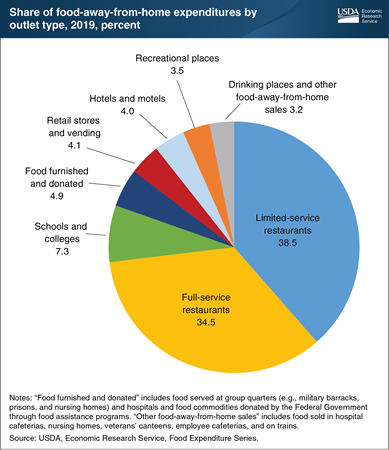
In 2019, U.S. consumers, businesses, and government entities spent $1.8 trillion on foods and beverages, according to the Economic Research Service’s (ERS) Food Expenditure Series. Expenditures at food-away-from-home establishments—restaurants, school cafeterias, sports venues, and other eating places—totaled $969.4 billion in 2019, compared to the $799.4 billion spent on food at home in grocery stores, supercenters, convenience stores, and other retailers. Full-service restaurants with wait staff and limited-service restaurants—where food is ordered and paid for at a counter or drive-thru window—dominate the U.S. food-away-from-home market. Each of these sectors accounted for over a third of food-away-from-home expenditures in 2019. Schools and colleges accounted for 7.3 percent of food-away-from-home expenditures in 2019, followed by retail stores and vending machines (4.1 percent), hotels and motels (4.0 percent), recreational places (3.5 percent), and drinking places and other food-away-from-home sales (3.2 percent). Spending on food furnished in hospitals and in group quarters—such as meals served in military barracks, prisons, and nursing homes—and the value of food commodities donated by the Federal Government totaled $47.6 billion in 2019 and accounted for 4.9 percent of food-away-from-home expenditures. While the data in this chart predate the COVID-19 pandemic, they can provide insight into its potential impact on the food-away-from-home market. The stay-at-home orders that accompanied the pandemic have caused a drop in spending on eating out, and some food-away-from-home sectors have been more affected than others. The data in this chart are from ERS’s Food Expenditure Series data product.
Friday, June 5, 2020
Errata: On July 22, 2020, this Chart of Note was reposted with corrected data for February 2020 and March 2020.
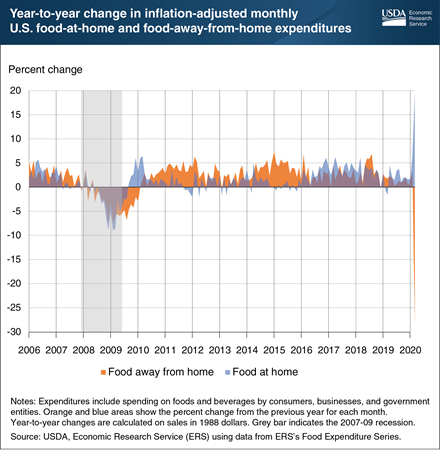
The COVID-19 pandemic and resulting stay-at-home orders have dramatically impacted Americans’ food spending. Inflation-adjusted expenditures at grocery stores, supercenters, convenience stores, and other retailers (food at home) were 6.7 percent higher in February 2020 compared with February 2019. This same spending was 19.3 percent higher in March 2020 compared with March 2019. Comparing spending for the same month accounts for seasonal food spending patterns. Inflation-adjusted February 2020 expenditures at eating-out establishments—restaurants, school cafeterias, sports venues, and other eating-out places—were 3.1 percent higher than February 2019 expenditures. March 2020 food-away-from-home spending was 28.3 percent lower than March 2019 spending. During the Great Recession of 2007-09, expenditures on both food at home and food away from home decreased, with the largest decrease in February 2009. Unlike previous economic shocks, the COVID-19 shock has led to a pronounced substitution from food away from home towards food at home. This substitution is in part due to the stay-at-home orders and the fact that many eating-out businesses are operating at a limited capacity or have ceased operations completely. The data in this chart are from the Economic Research Service’s Food Expenditure Series data product, updated June 2, 2020.
Thursday, May 28, 2020
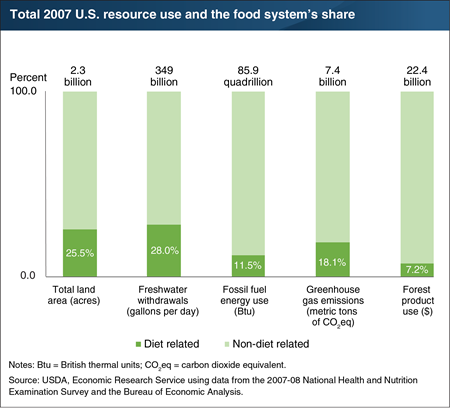
Conserving natural resources starts with identifying where they are used. A recent Economic Research Service (ERS) study examined how much of 5 of the Nation’s natural resources were used in 2007 to feed Americans aged 2 and above. (2007 data were the latest available with the level of detail needed for the analysis.) The researchers looked at the entire U.S. food system from production of farm inputs—such as fertilizers and feed—through points of consumer purchases in grocery stores and eating-out places to home kitchens. Their estimates show that agricultural land use in the U.S. food system was 25.5 percent of the country’s 2.3 billion acres of total land. Although the study does not account for other food-related land use, such as by forestry and mining industries serving the food system, it does show that about half of agricultural land is dedicated to food production for the U.S. market, and the other half was devoted to nonfood crops, like cotton and corn for producing ethanol, and to export crops, like soybeans. The U.S. food system also accounted for an estimated 28 percent of 2007’s freshwater withdrawals, 11.5 percent of the fossil fuel budget, and 7.2 percent of marketed forest products. Air is a natural resource that is degraded by the addition of greenhouses gases. The food system accounted for an estimated 18.1 percent of U.S. greenhouse gas emissions in 2007. A version of this chart appears in the ERS report, Resource Requirements of Food Demand in the United States, May 2020 and the Amber Waves feature article, “A Shift to Healthier Diets Likely To Affect Use of Natural Resources.”
Wednesday, May 20, 2020
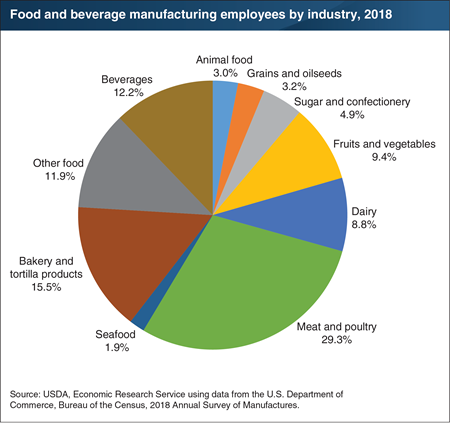
According to the latest available Federal data, in 2018, the U.S. food and beverage manufacturing sector employed more than 1.7 million people, or just over 1 percent of all U.S. nonfarm employment. Within the U.S. manufacturing sector, food and beverage manufacturing employees accounted for the largest share of employees (14.6 percent). In thousands of food and beverage manufacturing plants located throughout the country, these employees were engaged in transforming raw agricultural materials into food products for intermediate use or final consumption. Manufacturing jobs include processing, inspecting, packing, janitorial and guard services, product development, and recordkeeping, as well as nonproduction duties such as sales, delivery, advertising, and clerical and routine office functions. In 2018, meat and poultry plants employed the largest share of food and beverage manufacturing workers (29.3 percent), followed by bakeries (15.5 percent), and beverage plants (12.2 percent). This chart appears in the Ag and Food Sectors and the Economy section of the Economic Research Service data product Ag and Food Statistics: Charting the Essentials.
Friday, April 24, 2020
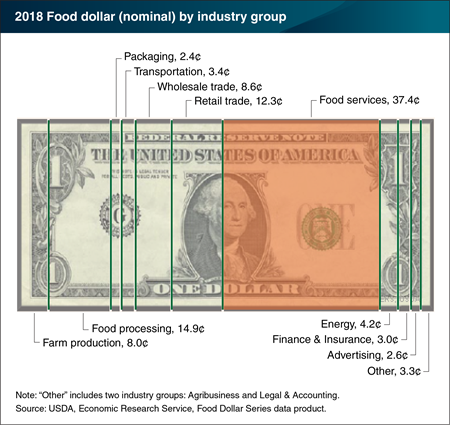
In 2018, restaurants and other eating-out places claimed 37.4 cents of the U.S. food dollar—foodservices’ highest share during the 1993 to 2018 period covered by the Economic Research Service’s (ERS’s) Food Dollar Series and the seventh consecutive annual increase. More eating out in 2018 was also reflected in the 12.3-cent retail-trade share claimed by grocery stores and other food retailers, which was at its lowest level in the 1993-2018 period. The only other industry groups that showed an increasing food dollar share in 2018 were farm producers, up 0.3 cents to 8 cents in 2018, and energy industries, such as electric power and natural gas, which increased their share for the third consecutive year, up to 4.2 cents. ERS’s annual Food Dollar Series provides insight into the industries that make up the U.S. food system and their contributions to total U.S. spending on domestically-produced food. ERS uses input-output analysis to calculate the value added, or cost contributions, from 12 industry groups in the food supply chain. Annual shifts in food dollar shares between industry groups occur for a variety of reasons, ranging from the mix of foods that consumers purchase to relative input costs; implications of this year’s COVID-19-related shelter-in-place restrictions will be reflected in the 2020 food dollar. This chart is available for the years 1993 to 2018, and can be found in ERS’s Food Dollar Series data product, updated on March 23, 2020.
Friday, April 10, 2020
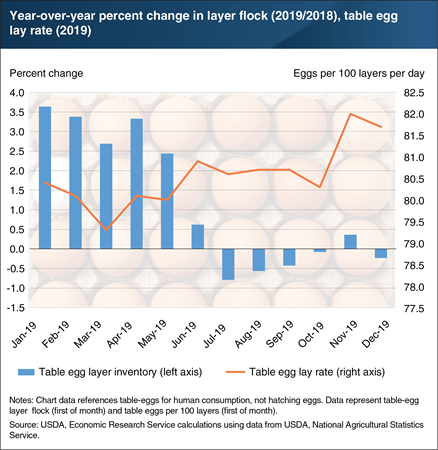
In 2019, the United States produced more than 8 billion dozen table eggs, a 2.8-percent increase over 2018. Much of this growth came in the first half of 2019, driven by a larger layer flock—a flock of egg-laying hens—as well as higher egg lay rates. However, this growth resulted in an oversupply of eggs, which put significant downward pressure on egg prices. In response, the industry took measures beginning in June 2019 to downsize the layer flock. For the remainder of 2019, the layer flock inventory fell below or hovered around previous year levels. Nonetheless, table egg production in the second half of 2019 remained 1.5 percent higher over 2018 because of record-high lay rates. On November 1, 2019, the U.S. table egg lay rate reached 82 eggs per 100 layers, the highest rate on record. Lay rates, which have increased by approximately 11 percent since 2000, have been an important driver of growth in egg production. Several factors can affect lay rates, including day length, hen age, nutrition, disease, genetics, and flock management. Egg production decreases with shorter days, particularly during fall and winter, but this can be remedied with artificial lighting. Younger hens and older hens do not produce as many eggs as those hens of peak production age (approximately 26 weeks). Finally, advancements in nutrition, disease prevention, genetic selection, and improved flock management practices have contributed to improving overall hen health, which is associated with good lay rates. In the beginning of 2020, although lay rates continued to trend higher year over year, the layer flock contracted sizably. This tightening of supply has been met with a surge in demand, causing prices to increase in March. This chart is drawn from the Economic Research Service Livestock, Dairy, and Poultry Monthly Outlook, published March 2020, and the Livestock & Meat Domestic Data: Production Indicators.
Wednesday, April 1, 2020
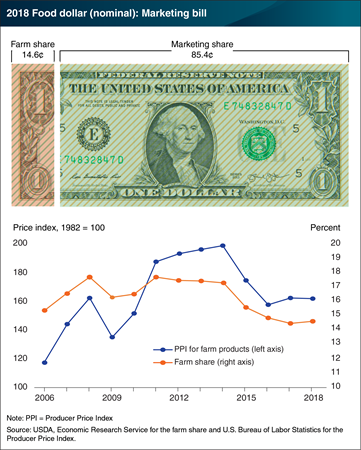
On average, U.S. farmers received 14.6 cents for farm commodity sales from each dollar spent on domestically produced food in 2018, up slightly from 14.4 cents in 2017. Known as the farm share, this amount rose for the first time since 2011. This increase coincides with a flattening in average prices received by U.S. farmers (as measured by the Producer Price Index for farm products) in 2017 and 2018, after steep declines in 2015 and 2016. A preliminary 2017 farm share estimate published last year was also 14.6 cents, but the 2017 figure has been revised downward to 14.4 cents in the newly-released updates. The Economic Research Service (ERS) uses input-output analysis to calculate the farm and marketing shares from a typical food dollar, including food purchased both at grocery stores and at restaurants and other eating-out places. The marketing share covers the costs of getting domestically produced food from farm to points of purchase, including costs related to packaging, transporting, processing, and selling to consumers at grocery stores and eating-out places. The relatively low farm share measures for 2015-18 occurred during a 7-year trend of increases in the portion of the food dollar going to the foodservice industry. Farmers receive a smaller share from eating-out dollars because of the added costs for preparing and serving meals at eating-out places, so more food-away-from-home spending also drives down the farm share. The data for this chart can be found in ERS’s Food Dollar Series data product, updated on March 23, 2020.
Friday, February 21, 2020
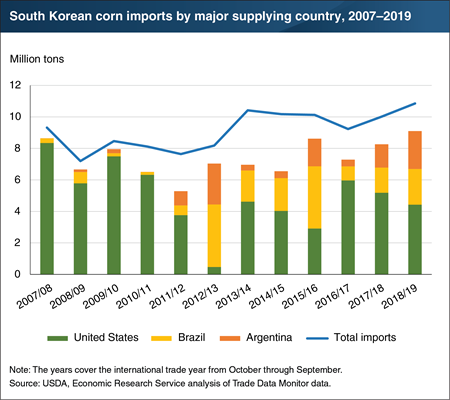
Since 2010, the United States has been losing its dominant position as a corn import supplier to South Korea. Although Mexico is the largest foreign market for U.S. corn, before 2011 South Korea was a large and stable purchaser. However, the U.S. share in South Korea’s corn imports has dropped from 84 percent during the years of 2007-2011 to 46 percent during 2015-2019. In 2012, drought in the United States contributed to the loss in its corn export share vis-à-vis South Korea (and the entire world market) in that year. Yet, the main reason for the decline in U.S. corn export share with South Korea since 2012 has been that the amount of corn supplied by export competitors—in particular, Brazil and Argentina—has risen as large crops in those countries increased their price competitiveness (with some annual fluctuation). South Korea is a very price-sensitive grain importer, and Brazil and Argentina have been supplying corn at attractively low prices. The U.S. loss of corn import share in South Korea is part of a general trend of declining U.S. corn export share in the world, despite higher global corn trade and slightly growing U.S. corn production. This chart was previously published in the ERS Feed Outlook report released in January 2020.
Friday, December 20, 2019
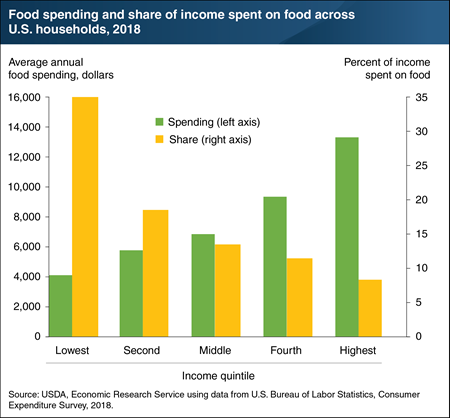
As their incomes rise, households spend more money on food, but it represents a smaller share of their overall budgets. In 2018, households in the lowest income quintile, with an average 2018 after-tax income of $11,695, spent an average of $4,109 on food (about $79 a week). Households in the highest income quintile spent an average of $13,348 on food (about $257 a week). The three-fold increase in spending between the lowest and highest income quintiles is not the result of a three-fold increase in consumption. Rather, people choose to buy different types of food as they gain more disposable income. One example is dining out. One-third of food spending by the lowest income quintile goes to food away from home, whereas food away from home accounts for half of total food spending for the top quintile. Even with a shift to more expensive food options, as income increases, the percent of income spent on food goes down. In 2018, food spending represented 35.1 percent of the bottom quintile’s income, 13.6 percent of income for the middle quintile, and 8.2 percent of income for the top quintile. This chart appears in the Food Prices and Spending section of ERS’s Ag and Food Statistics: Charting the Essentials data product.
Friday, December 6, 2019
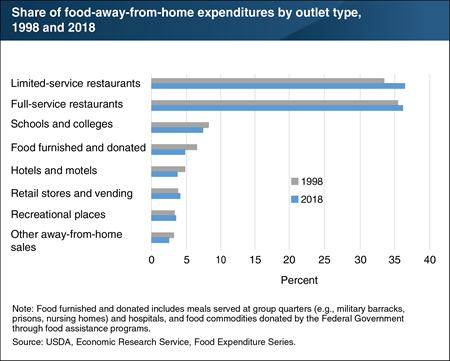
ERS’s Food Expenditure Series points to Americans’ growing appetite for eating out. Expenditures at food-away-from-home establishments—restaurants, school cafeterias, sports venues, and other eating places—totaled $930.6 billion in 2018, compared with the $780.9 billion spent on food at home in grocery stores, supercenters, convenience stores, and other retailers. Full-service restaurants with wait staff and limited-service restaurants—where food is ordered and paid for at a counter or drive-through window—dominate the food-away-from-home market. Full-service restaurants’ share of the food-away-from-home market rose from 35.6 percent in 1998 to 36.3 percent in 2018, while limited-service restaurants posted a larger increase in market share from 33.6 to 36.6 percent over the same period. The share of food-away-from-home expenditures occurring at hotels and motels and at schools and colleges declined between 1998 and 2018, while the shares at recreational places and at retail stores and vending increased slightly. The data in this chart, along with more information on U.S. food sales and expenditures, can be found in ERS’s Food Expenditure Series data product.


