ERS Charts of Note
Subscribe to get highlights from our current and past research, Monday through Friday, or see our privacy policy.
Get the latest charts via email, or on our mobile app for  and
and 
Friday, June 7, 2019
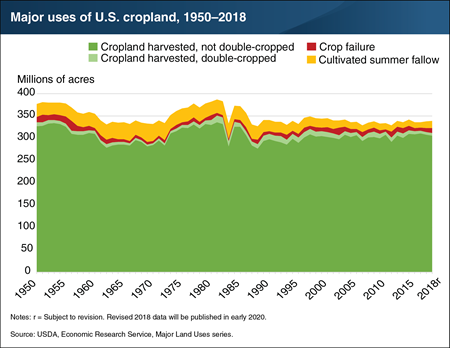
The ERS Major Land Uses series defines “cropland used for crops” as comprising three types: cropland harvested, crop failure, and cultivated summer fallow. In 2018, cropland harvested declined to 312 million acres—the lowest recorded harvested cropland area since 2013 (311 million acres) and 2 million acres less than in 2017. A 2-million-acre increase in crop failure due to drought conditions in several crop-producing areas contributed to the 2018 decline in cropland harvested. Land used for cultivated summer fallow, which primarily occurs as part of wheat rotations in the semi-arid West, also increased by 1 million acres to 16 million acres, continuing the reversal, which began in 2017, of a long-term decline in this category. The area that was double-cropped (i.e., two or more crops harvested) held constant over the previous year at about 6 million acres. This chart uses historical data from the ERS data product Major Land Uses, recently updated to include new 2018 estimates and revised 2017 estimates.
Monday, May 20, 2019
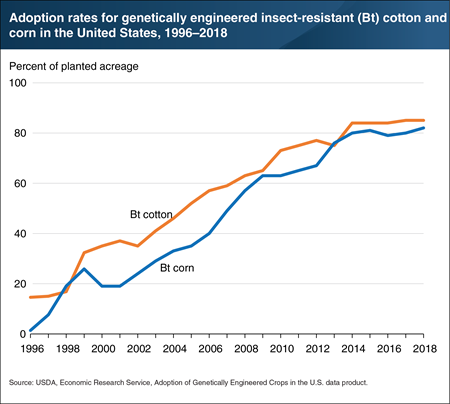
A genetically engineered (GE) plant has had DNA inserted into its genome using laboratory techniques. Some of the first GE crops were created by inserting genes from the soil bacterium Bacillus thuringiensis (Bt) into corn and cotton plants. Bt creates organic, crystalline insecticides that become concentrated in plant tissues, so these GE crops gained insect resistance. Demand increased quickly for Bt corn and cotton after their commercialization in 1996. Five years later, about 37 percent of cotton acres and 19 percent of corn acres had been planted with Bt seeds. By 2018, Bt adoption had increased to 85 percent of cotton acres and 82 percent of corn acres. Early differences in the adoption rates of these two GE crops may be related to the fact that insect infestations tend to be more severe in warmer climates. Cotton-growing areas are concentrated in the Southeastern United States and the Southern Plains, which tend to be warmer than growing areas in the Midwest, where most U.S. corn production takes place. This chart appears in the December 2018 Amber Waves data feature, “Trends in the Adoption of Genetically Engineered Corn, Cotton, and Soybeans.”
Friday, May 17, 2019
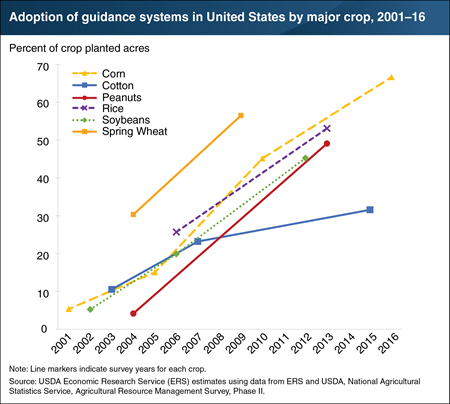
Guidance systems use global positioning system (GPS) coordinates to automatically steer farm equipment like combines, tractors, and self-propelled sprayers. This helps reduce operator fatigue and pinpoint precise field locations within a few inches. Freed from steering, operators can access timely coordinates from a screen, monitor other equipment systems more closely, and correct problems more quickly. In addition, guidance systems reduce costs by improving the precision of sprays and the seeding of field crop rows. The ends of rows, in particular, benefit from more accurate application of inputs. Manually reversing farm machinery to return in the opposite direction in adjacent rows on a field can cause overlaps and missed spots for applied inputs. Guidance systems can also help extend working hours for field operations during time-sensitive production periods because guided machinery works well in the floodlit dark. Out of all precision agriculture technologies, guidance systems had the highest adoption rates—used on 67 percent of corn planted acres (in 2016), 57 percent of spring wheat (2009), 53 percent of rice (2013), 49 percent of peanuts (2013), and 45 percent of soybeans (2012). This chart appears in the May 2019 ERS report, Agricultural Resources and Environmental Indicators, 2019.
Thursday, May 2, 2019
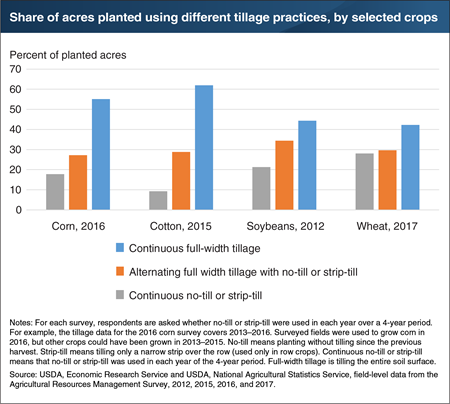
Tillage—the mechanical manipulation of the soil—helps to prepare the soil for planting, control weeds, incorporate surface-applied manure or fertilizer, and encourage soil warming for early planting. In recent decades, some farmers have eliminated the use of tillage altogether using “no-till” methods, or limited tillage to narrow strips where row-crops will be planted using “strip-till” methods. No-till and strip-till minimize soil disturbance and keep crop residue on the soil surface to reduce erosion and conserve soil moisture. Recent ERS research shows that many farmers who use no-till or strip-till often alternate these practices with full-width tillage (tilling the entire soil surface). On land where corn was planted in 2016, for example, no-till or strip till was used continuously during 2013–2016 on 18 percent, no-till or strip-till was used alternately with full width tillage on 27 percent, and full-width tillage was used continuously on 55 percent. The exact mix of tillage practices varied across the surveys. One reason farmers alternate tillage practices is because of crop rotation. For example, corn and soybeans are often grown in rotation, but farmers used no-till or strip-till more often for soybeans (about 34 percent in 2012) than for corn (27 percent in 2016). In many cases, farmers use no-till when growing soybeans, but use full-width tillage when growing corn. This chart appears in the ERS report, Tillage Intensity and Conservation Cropping in the United States, released September 2018.
Monday, April 22, 2019
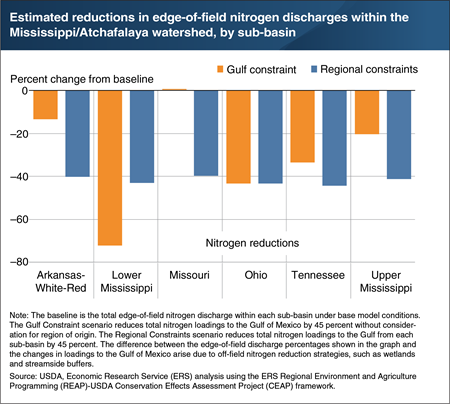
Every summer, a “hypoxic zone” forms in the Gulf of Mexico where dissolved oxygen is too low for many aquatic species to survive. This zone is fueled by nutrient (nitrogen and phosphorus) runoff from the Mississippi/Atchafalaya River Basin, a region containing about 70 percent of U.S. cropland. Recent ERS research modeled two scenarios for reducing nitrogen loadings to the Gulf of Mexico by 45 percent. The Gulf Constraint scenario reduces nitrogen loadings at the lowest cost, without consideration of the regional origin of nutrients. The greatest nitrogen reductions would occur in the Lower Mississippi sub-basin (reduced to 72 percent of the baseline amount) and in the Ohio sub-basin (43 percent). Because these regions are relatively close to the Gulf and have relatively high baseline nitrogen discharges per acre (i.e., high potential to reduce discharges by adopting low-cost conservation practices), the estimated cost of reducing nitrogen loadings originating here is generally lower than elsewhere. On the other hand, the Regional Constraints scenario evenly reduces nitrogen loadings by 45 percent from each of the sub-basins. Under the Regional scenario, total edge-of-field nitrogen reductions (and aggregate costs) are projected to rise relative to the Gulf scenario for the Tennessee, Upper Mississippi, Missouri, and Arkansas-White-Red sub-basins and drop for the Lower Mississippi region. This chart appears in the ERS report, Reducing Nutrient Losses From Cropland in the Mississippi/Atchafalaya River Basin: Cost Efficiency and Regional Distribution, released September 2018.
Tuesday, March 26, 2019
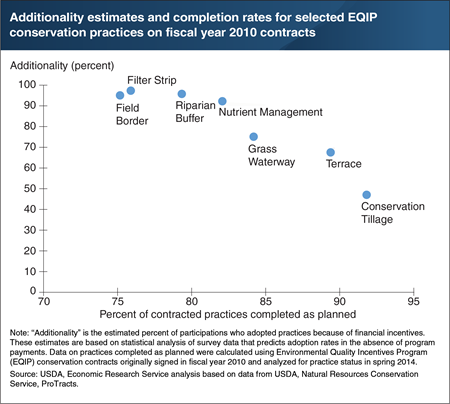
The Environmental Quality Incentives Program (EQIP) and other USDA working lands programs provide payments to farmers and ranchers who sign contracts to adopt certain conservation practices. Most contracted practices are implemented as planned. But some types of practices, such as installation of field borders and filter strips, are less likely to be completed. While USDA can reallocate funding that would have gone toward uncompleted practices, modifying contracts requires additional USDA staff resources and leads to delays in getting conservation efforts on the ground. However, there is a tradeoff between practices that have higher rates of completion and practices that have higher rates of “additionality.” Additionality is a measure of payment effectiveness that estimates the percentage of producers who adopted the practices because of the financial assistance. This research shows that practices that are less likely to be completed tend to have higher additionality. All efforts to incentivize behavior face a challenge in achieving greater additionality because it is difficult for program managers to observe the private incentives to adopt practices in the absence of payments. The tradeoff between additionality and completion rates is a direct reflection of these hidden incentives. One implication of this research is that practice completion rates, which can be easily calculated using program administrative data, could be used as an indirect measure of additionality. This chart appears in the ERS report, Working Lands Conservation Contract Modifications: Patterns in Dropped Practices, released March 2019.
Thursday, March 21, 2019
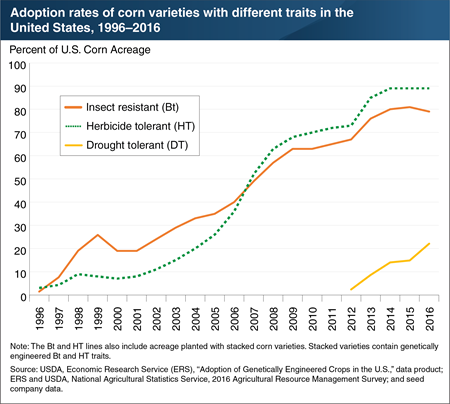
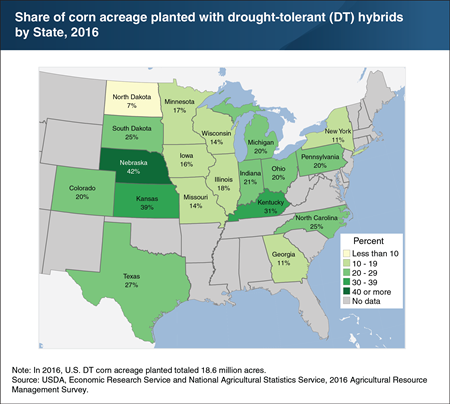
Droughts are among the most frequent causes of crop yield losses, failures, and subsequent crop revenue losses across the world. Genetically engineered (GE) and non-GE drought tolerance became broadly available in corn varieties between 2011 and 2013. By 2016, 22 percent of total U.S. corn acreage was planted with DT varieties. To better understand this growth rate, ERS researchers compared it to the adoption of GE herbicide-tolerant (HT) and insect-resistant (Bt) corn. Between 1996 and 2000, HT corn acreage increased from 3 to 7 percent of total U.S. corn acreage, while Bt corn acreage increased from just over 1 percent to 19 percent. By 2012, nearly 75 percent of U.S. corn acres were planted to varieties with at least one GE trait. In 2016, 91 percent of DT corn fields also had HT or Bt traits. Some evidence suggests that these three traits are complementary. For example, a corn crop will generally be less vulnerable to drought if it is not competing with weeds for water, and if its roots and leaves are not damaged by insect pests. This chart appears in the January 2019 ERS report, Development, Adoption, and Management of Drought-Tolerant Corn in the United States.
Thursday, February 28, 2019
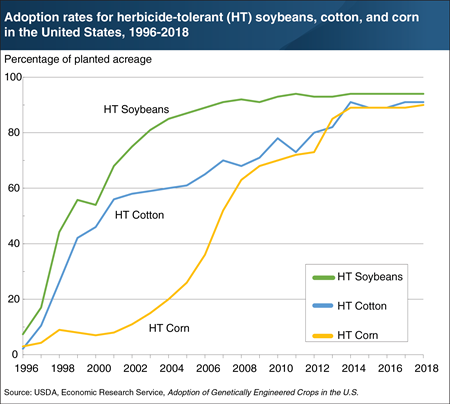
A genetically engineered (GE) plant has had DNA inserted into its genome using laboratory techniques. The first GE herbicide-tolerant (HT) crops, which can survive applications of herbicides like glyphosate or glufosinate that kill most other plants, were created by inserting genes from soil bacteria. Generally, the use of HT corn, cotton, and soybeans in the United States increased quickly following their commercialization in 1996. HT soybean use increased most rapidly, largely because weed resistance to herbicides called ALS inhibitors had developed in the 1980s. By comparison, HT corn use increased relatively slowly, perhaps because corn farmers could use the herbicide atrazine, an effective alternative to glyphosate that could not be applied to soybeans or cotton. The percent of acreage planted with HT corn, cotton, and soybeans has plateaued in recent years, partly because adoption rates for these seeds is already quite high and because weed resistance to glyphosate has continued to develop and spread. As the problems posed by glyphosate-resistant weeds intensify, crop varieties with new HT traits are being developed. For example, a new HT variety of soybeans that is tolerant of herbicides called HPPD inhibitors will be available to U.S. growers in 2019. This chart appears in the December 2018 Amber Waves data feature, "Trends in the Adoption of Genetically Engineered Corn, Cotton, and Soybeans.”
Monday, February 4, 2019
Droughts have been among the most significant causes of crop yield reductions and losses for centuries. Most crop farmers have limited options to reduce the damaging physical effects of drought. Although Federal disaster program and crop insurance payments tend to be higher during droughts, they typically do not fully compensate farmers for drought-related losses. Farmers with access to ample sources of irrigation water can, at least partially, mitigate drought stress: irrigation both provides water and cools the crop. However, many water-intensive crops, including corn, are mostly grown on non-irrigated cropland. Drought-tolerant (DT) corn was commercially introduced in 2011. By 2016, DT corn acreage made up 22 percent of total U.S. planted corn acreage, with the highest shares in drought-prone Nebraska (42 percent) and Kansas (39 percent). Regional differences in drought severity and how recently farmers had experienced drought significantly influenced the adoption of DT corn. For example, States with counties that had experienced at least one severe-or-worse drought between 2011 and 2015 had adoption rates of at least 25 percent. Northern corn-producing States—such as Minnesota, Wisconsin, and Michigan—experienced less severe droughts during this time period and had lower adoption rates, ranging from 14 to 20 percent. This chart appears in the January 2019 ERS report, Development, Adoption, and Management of Drought-Tolerant Corn in the United States.
Thursday, December 20, 2018
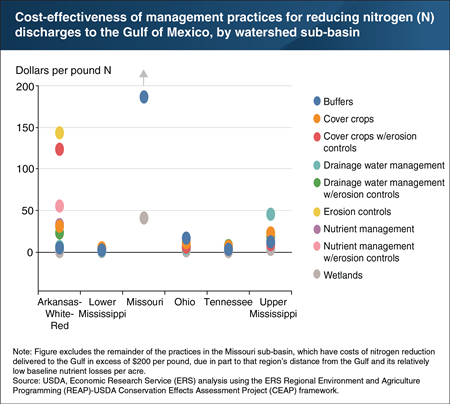
Every summer, a large area forms in the Gulf of Mexico where dissolved oxygen is too low for many aquatic species to survive. This “hypoxic zone” is fueled by nutrient (nitrogen and phosphorus) runoff from the Mississippi/Atchafalaya River Basin (MARB), a region containing about 70 percent of U.S. cropland. Implementing a cost-effective strategy to reduce nutrients arriving at the Gulf by 45 percent would involve a range of land-use reallocations and conservation practices within the MARB. ERS researchers estimated that the most cost-effective practice would generally be optimally placed wetland restoration, especially in the Lower Mississippi and Tennessee sub-basins. Buffers would also generally be more cost effective than on-field practices because they treat nutrient loss from their surrounding areas. However, the terrain within the MARB offers limited opportunities for buffer and optimal wetland placement. Drainage water management, nutrient management, and cover crops (when used with structural erosion controls) were also generally more cost effective than the other practices and combinations of practices as detailed in the chart legend. The lowest nitrogen reduction costs per pound discharged to the Gulf were estimated to occur in the Lower Mississippi, Tennessee, and Ohio sub-basins. This chart appears in the September 2018 Amber Waves feature, “Cost-Effective Strategies for Reducing Cropland Nutrient Deliveries to the Gulf of Mexico.”
Tuesday, December 4, 2018
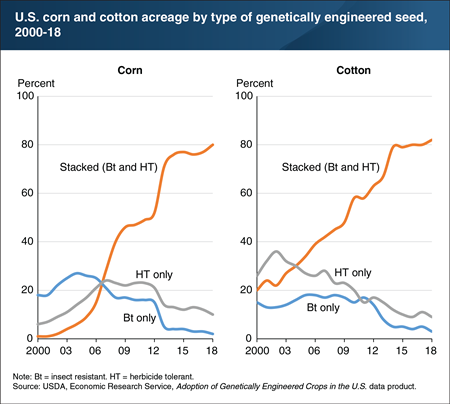
In 2018, U.S. farmers planted over 90 percent of corn and cotton acres with genetically engineered (GE) seeds. These GE seeds can be herbicide tolerant (HT), insect resistant (Bt), or “stacked” with both HT and Bt traits. Use of stacked seeds has climbed since 2000, when approximately 1 percent of corn and 20 percent of cotton were produced using stacked seeds. In 2018, by comparison, approximately 80 percent of the corn and cotton planted in the United States used stacked seeds. Increases in the use of stacked seeds may be due to the development of new seed products. For instance, the first Bt corn plant resistant to rootworms was commercialized in 2003, and other rootworm-resistant corn varieties reached the market in 2005 and 2006. The commercialization of these new seed products may have encouraged some farmers planting HT seeds to consider a stacked seed variety instead. This chart appears in the December 2018 Amber Waves data feature, “Trends in the Adoption of Genetically Engineered Corn, Cotton, and Soybeans.”
Friday, November 23, 2018
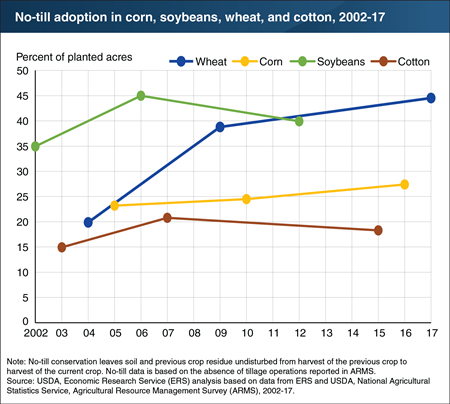
Conservation tillage reduces soil disturbance and keeps soil covered, thereby conserving soil moisture and lessening erosion. When used in conjunction with other practices, it can also help promote soil health. No-till, a type of conservation tillage where farmers plant directly into remaining crop residue without tilling, accounted for the majority of conservation tillage acreage for wheat (45 percent of total acres) in 2017 and soybeans (40 percent of total acres) in 2012. ERS researchers found that adoption of no-till, in general, increased from 2000 to 2007—particularly for wheat (2004-2009) and soybeans (2002-2006). In later periods, no-till adoption increased more slowly for wheat (2009-2017) and may have declined for soybeans (2006-2012) and cotton (2007-2015). Data for corn indicate only modest gains in adoption of no-till between 2005 and 2016. This chart appears in the ERS report, Tillage Intensity and Conservation Cropping in the United States, released in September 2018.
Thursday, October 25, 2018
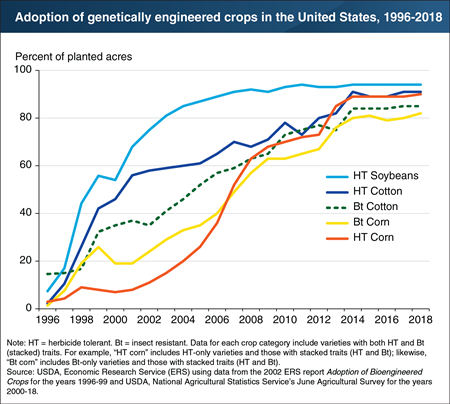
In 2018, U.S. farmers planted over 90 percent of soybean, cotton, and corn acres with genetically engineered (GE) seeds. Most of these GE seeds are herbicide tolerant (HT), insect resistant (Bt), or both (stacked). The share of U.S. soybean acres planted with HT seeds rose from about 7 percent in 1996 and plateaued at 94 percent in 2014. The share of HT cotton acreage expanded from about 2 percent in 1996 to a peak of 91 percent in 2014. The share of HT corn acreage grew relatively slowly at first, but reached about 90 percent in 2018. Meanwhile, the share of Bt corn acreage grew from 1 percent in 1996 to 82 percent in 2018. The share of Bt cotton acres also expanded, from nearly 15 percent in 1996 to 85 percent in 2018. Demand for GE seeds is affected by the severity of pest infestations, output prices, input prices, and the commercialization of new GE traits. For example, the introduction of new varieties of Bt corn resistant to corn rootworm and earworm may have contributed to the increase in Bt corn adoption rates since 2003. This chart appears in the ERS data product Adoption of Genetically Engineered Crops in the U.S., updated July 2018.
Friday, October 12, 2018
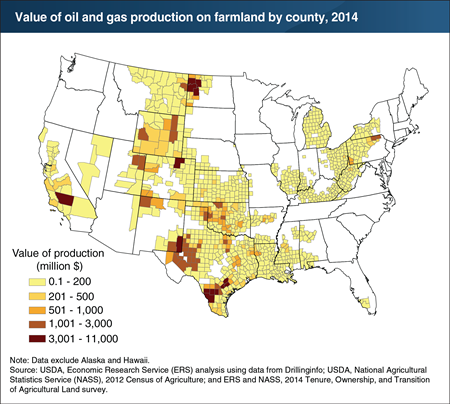
Oil and gas production disproportionally occurs in areas where large shares of land are operated by farmers and ranchers. In 2014, the value of oil and gas production on land operated by farms amounted to $226 billion, or about 67 percent of the total $338 billion in oil and gas production in the contiguous United States. Oil and gas production on farmland was concentrated in California, in a band from North Dakota to Texas, and in the Marcellus Shale, which reaches into Pennsylvania, West Virginia, and Ohio. Most nonoperator landlords (who rent out the farmland they own to farmers) and most farm operators do not own the oil and gas rights associated with their land and are thus unable to receive payments. In the 1,080 counties with oil and gas production in 2014, only 13 percent of nonoperator landlords and 10 percent of farm operators reported receiving oil or gas payments. Payments to farmland owners (operators and nonoperator landlords) amounted to $7.4 billion—but ERS estimates this could have been as high as $40 billion if all farmland owners had also owned the oil and gas rights associated with their farmland. This chart appears in the June 2018 ERS report, Ownership of Oil and Gas Rights: Implications for U.S. Farm Income and Wealth.
Friday, September 28, 2018
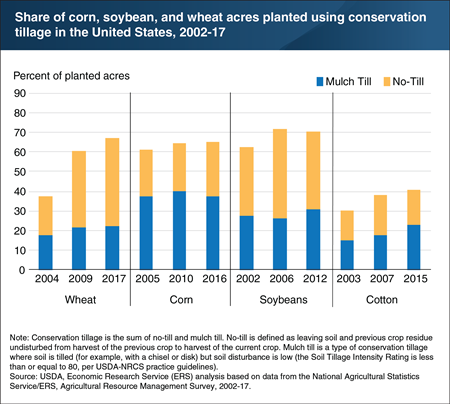
Conservation tillage helps protect soil by reducing soil disturbance and keeping the soil covered. These actions conserve soil moisture, reduce soil erosion, and, when used in conjunction with other practices, can help promote soil health. Healthy soils can improve environmental outcomes and benefit farmers. For example, greater rainfall infiltration and soil water-holding capacity can reduce runoff of sediment and nutrients while increasing drought resilience. Based on the most recent surveys, conservation tillage was used on a majority of wheat (67 percent), corn (65 percent), and soybeans (70 percent). However, conservation tillage was used on just 40 percent of cotton acres. No-till production, a type of conservation tillage where farmers plant directly into remaining crop residue without tilling, accounted for the majority of conservation tillage acres on wheat (45 percent of total acres) and soybeans (40 percent). Almost 50 percent of corn, soybean, wheat, and cotton acreage was in no-till or strip-till—a mulch till method where tillage occurs in a narrow strip where seeds are planted—at some time over a 4-year period (the survey year and 3 previous years). However, only about 20 percent of these acres were in no-till or strip-till all 4 years. This chart appears in the ERS report, Tillage Intensity and Conservation Cropping in the United States, released September 2018.
Thursday, September 27, 2018
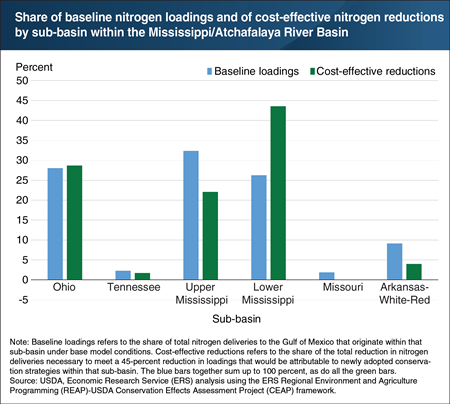
Every summer, a large area forms in the Gulf of Mexico where dissolved oxygen is too low for many aquatic species to survive. This “hypoxic zone” is fueled by nutrient (nitrogen and phosphorus) runoff from the Mississippi/Atchafalaya River Basin (MARB), a region containing about 70 percent of U.S. cropland. Recent ERS research estimated that the least-cost strategy for reducing nutrient deliveries to the Gulf from cropland in the MARB would focus a large share of the nutrient-reducing practices and cropping changes in the Lower Mississippi sub-basin. Almost half of nitrogen (44 percent) and phosphorus (46 percent) reductions under the least-cost scenario would come from the Lower Mississippi. Although the baseline analysis estimates that agriculture in the Upper Mississippi sub-basin delivers the most nitrogen to the Gulf relative to other sub-basins (over 32 percent), the Lower Mississippi sub-basin’s proximity to the Gulf means that a higher percentage of nutrient losses there reaches the Gulf than from fields farther upstream. The Lower Mississippi was estimated to have relatively high per-acre nutrient losses and deliveries to the Gulf, as well as the lowest per-pound costs of reducing nitrogen deliveries for almost all conservation practices analyzed. This chart appears in the ERS report Reducing Nutrient Losses From Cropland in the Mississippi/Atchafalaya River Basin: Cost Efficiency and Regional Distribution, released September 2018.
Wednesday, September 12, 2018
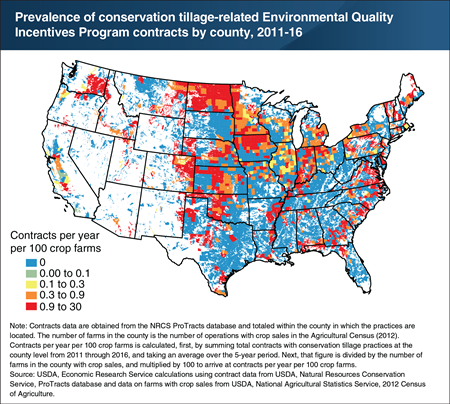
USDA offers financial assistance to farmers for implementing a wide range of conservation practices through its Environmental Quality Incentives Program (EQIP). Conservation tillage practices—including no-till, strip-till row crop planting, and mulch till—can improve soil health, reduce erosion, and reduce nutrient pollution to lakes, streams, and rivers. Farmers practicing no-till plant crops without using any sort of plow to turn residue from the prior crop into the soil. Strip tillage disturbs only the soil within the planting row, while mulch tillage minimizes soil disturbance and distributes crop residue. Between 2011 and 2016, the prevalence of EQIP contracts that included conservation tillage practices (as defined in the note) varied regionally. For example, the share was relatively high in North Dakota and northern Iowa, but much lower in neighboring counties in South Dakota. These variations may be due to underlying differences in regional adoption patterns, as well as differences in State and local funding priorities through EQIP. This chart updates data found in the April 2013 ERS report, “The Role of Conservation Programs in Drought Risk Adaptation.”
Friday, July 27, 2018
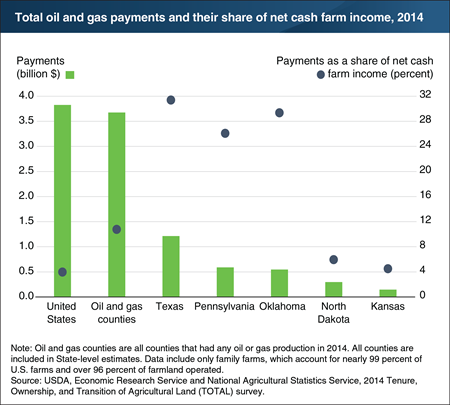
From 2005 to 2014, high energy prices and innovation in extraction methods enabled U.S. production of oil and gas to grow by 69 percent, with almost 67 percent of overall production occurring on farmland. The growth generated tens of billions of dollars of additional revenue for owners of oil and gas rights and increased the value of those rights. In 2014, farm operators owned $19.1 billion in oil and gas rights that generated $3.8 billion in payments through leases with energy firms. These payments accounted for about 4 percent of net cash farm income nationally in 2014, but made up a more substantial portion of farm income (11 percent) in oil and gas production regions. The share attributable to royalty income was particularly noteworthy in Texas, Oklahoma, and Pennsylvania, where oil and gas payments amounted to about 30 percent of net cash farm income. These States are host to productive shale plays, including the Marcellus, Barnett, Eagle Ford, and Woodford plays. This chart appears in the June 2018 ERS report, Ownership of Oil and Gas Rights: Implications for U.S. Farm Income and Wealth.
Friday, July 20, 2018
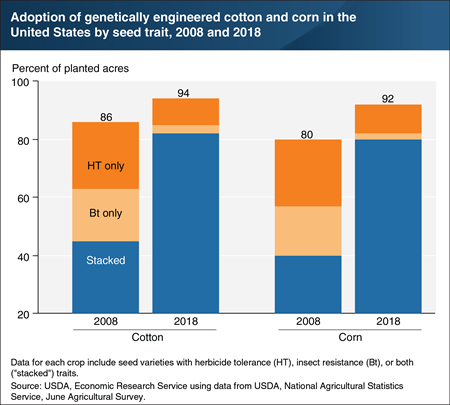
Currently, over 90 percent of corn, cotton, and soybean acreage in the United States is planted with genetically engineered (GE) seeds. Most of these GE seeds are either herbicide tolerant (HT) or insect resistant (Bt). Seeds that have both HT and Bt traits are referred to as “stacked.” A decade ago, 40 percent of U.S. corn acres and 45 percent of U.S. cotton acres were planted with stacked seeds. As of 2018, 80 percent of corn acres and 82 percent of cotton acres were planted with these varieties. Soybean seeds with stacked traits are currently not commercially available in the United States. Adoption rates for stacked seeds have slowed in recent years. Adoption rates for stacked corn seeds increased by 3 percentage points from 2017 to 2018, while rates for stacked cotton increased by only 2 percentage points. The slow growth rates for stacked seeds may be due to relatively low corn prices, or because the majority of GE seeds are already stacked. This chart is drawn from the ERS data product Adoption of Genetically Engineered Crops in the U.S., updated July 2018.
Monday, July 16, 2018
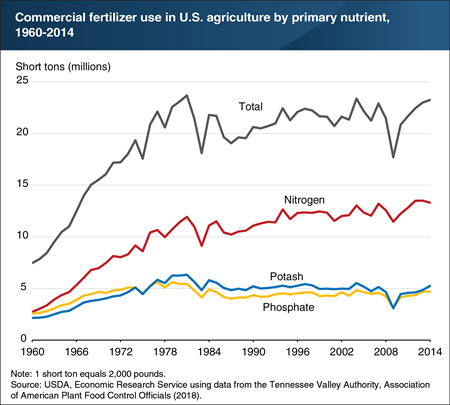
Fertilizers provide nutrients (such as nitrogen, potash, and phosphate) essential in the production of crops. The total consumption of fertilizers grew rapidly throughout the 1960s and 1970s, as U.S. farmers devoted more acreage to crop varieties and hybrids (such as corn and wheat hybrids) that respond well to more intensive use of commercial fertilizer, especially nitrogen. In 1960, farmers used about 7.5 million short tons of fertilizer—and use peaked at nearly 23.7 million short tons in 1981. After 1981, total fertilizer use fluctuated from year to year but displayed no trend, as modest growth in nitrogen use was offset by modest declines in potash and phosphate. Annual fluctuations in fertilizer use since 1981 reflected several factors, including changes in fertilizer and crop prices and changes in the mix of crops (e.g., corn uses more fertilizer than soybeans or wheat). Higher fertilizer prices limited use to some extent, while higher crop prices encouraged greater fertilizer use. Finally, macroeconomic events can affect use: for example, fertilizer use dropped in 2009, concurrent with the Great Recession. This chart appears in the ERS data product Fertilizer Use and Price, updated February 2018.


