ERS Charts of Note
Subscribe to get highlights from our current and past research, Monday through Friday, or see our privacy policy.
Get the latest charts via email, or on our mobile app for  and
and 
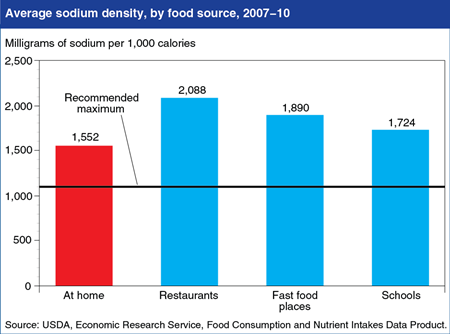
Foods prepared at home are less sodium dense than those from restaurants, but still above guidelines
Monday, July 21, 2014
Reducing sodium intake is a key recommendation in the 2010 Dietary Guidelines for Americans. Intake data from the 2007-10 National Health and Nutrition Examination Survey (NHANES) reveal that Americans age 2 and older consumed an average of 1,649 milligrams (mg) of sodium for each 1,000 calories eaten, compared to the recommended maximum of 1,100 mg per 1,000 calories. Foods prepared by restaurants, fast-food places, schools, and other away-from-home sources contain more sodium than foods prepared at home—1,879 mg per 1,000 calories versus 1,552 mg per 1,000 calories. Foods consumed at school cafeterias were found to be less sodium dense than foods eaten at restaurants and fast-food places, but higher than at-home foods. The statistics in this chart are from ERS’s Food Consumption and Nutrient Intakes data product, updated on June 27, 2014.
Wednesday, July 16, 2014
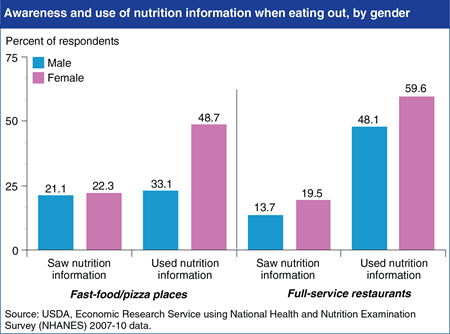
The 2010 Affordable Care Act includes a provision that will require restaurant chains with 20 or more locations to provide consumers with calorie information on menus and other nutrition information on demand. Understanding who uses current nutrition information provided voluntarily by eating places is useful for anticipating the Act’s impact. Using data from the 2007-08 and 2009-10 National Health and Nutrition Examination Survey, ERS researchers found that roughly 90 percent of respondents visited a fast-food or pizza place in the last year and about 88 percent patronized a full-service restaurant. Less than a quarter of those respondents reported seeing nutrition information. In general, women were more likely to see the nutrition information than men, and also more likely to use it in making their eating out selections. For example, in fast-food and pizza places, 48.7 percent of women who saw nutrition information used it, while only 33.1 percent of men did. In full-service restaurants, 59.6 percent of women who saw nutrition information used it, compared to 48.1 percent of men. This chart is based on statistics found in the ERS report, Consumers’ Use of Nutrition Information When Eating Out, released on June 27, 2014.
Thursday, May 15, 2014
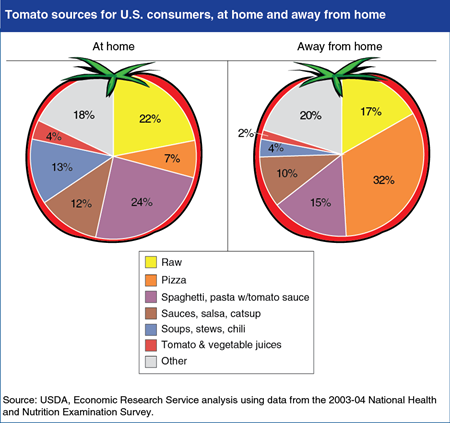
ERS researchers recently analyzed Americans’ vegetable consumption from all sources: plain raw or cooked vegetables; juices; sauces; and vegetables from mixed dishes like soups, stews, pasta dishes, and others. Tomatoes accounted for about a quarter of the average 1.5 cups of vegetables Americans ate per day. Most tomato is consumed as an ingredient in mixed foods, such as pastas and pizza. These mixed foods are much higher in sodium and calories than raw tomatoes. Researchers found that among foods prepared at home, raw tomatoes accounted for 22 percent of tomato consumption, while 24 percent came from tomato sauces for spaghetti and similar pastas. Among foods eaten away from home, pizza provided the largest share of tomato consumed (32 percent), followed by raw tomatoes (17 percent), and spaghetti and similar pastas with tomato sauce (15 percent). This chart appears in "Healthy Vegetables Undermined by the Company They Keep" in the May 2014 issue of ERS’s Amber Waves magazine.
Tuesday, March 4, 2014
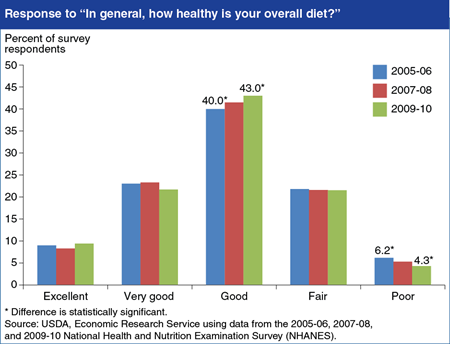
Some Americans believe they are making better food choices than they did in earlier years. In response to the question, “In general, how healthy is your overall diet?” 43 percent of respondents in the 2009-10 National Health and Nutrition Examination Survey (NHANES) rated their diets as “good,” compared to 40 percent 4 years earlier. During the same 4-year period, the number of people reporting a “poor” diet fell by 1.9 percentage points, from 6.2 to 4.3 percent. In the last three NHANES surveys, the most common response was “good,” followed by “very good” and “fair,” and the least common responses were at the extremes—“excellent” and “poor.” The proportion of respondents answering “excellent,” “very good,” or “fair” were statistically the same across the three surveys. This chart appears on ERS’s recently updated webpage about the Flexible Consumer Behavior Survey, which is a subset of questions in NHANES that collects information on the food habits, attitudes, and dietary behaviors of U.S. consumers.
Tuesday, February 18, 2014
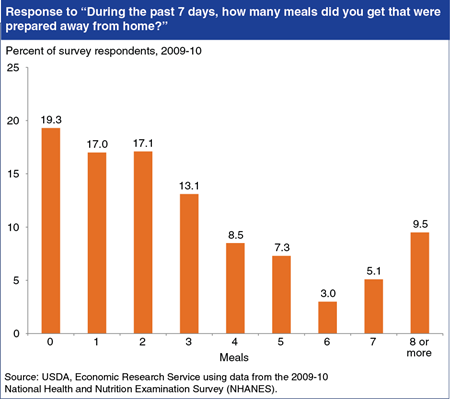
The Flexible Consumer Behavior Survey is a subset of questions in the National Health and Nutrition Examination Survey (NHANES) that collects information on the food habits, attitudes, and dietary behaviors of U.S. consumers. Some questions ask about food prepared away from home, which is of interest to nutritionists and public health professionals partly because the choices many of us make when eating out are often less healthy than our food choices at home. When asked, “During the past 7 days, how many meals did you get that were prepared away from home in places such as restaurants, fast food places, food stands, grocery stores, or from vending machines?” 9.5 percent of respondents reported 8 or more meals, down from 12.5 percent of respondents in 2007-08. The most common response was 0 meals away from home (19.3 percent of respondents). This chart appears on ERS’s recently updated webpage about the Flexible Consumer Behavior Survey.
Tuesday, December 3, 2013
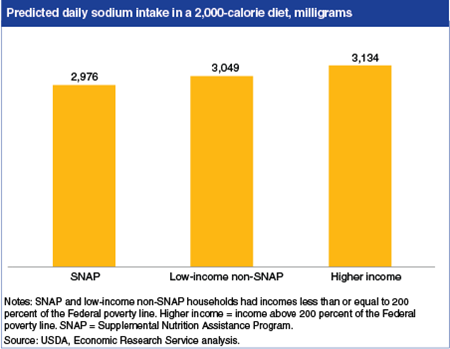
ERS researchers recently examined the quality of Americans’ diets, focusing on the effects of USDA’s Supplemental Nutrition Assistance Program (SNAP) on the food choices of low-income American adults. Researchers found SNAP participants’ diets were comparable in most ways to those of non-participants. One area in which SNAP participants did slightly better was sodium consumption: on average, SNAP participants had a lower sodium intake than either low-income non-participants or higher-income individuals. Current Federal nutritional recommendations advise keeping daily sodium intake below 2,300 milligrams, or below 1,500 milligrams for African Americans, people over age 50, and those who have hypertension, diabetes, or chronic kidney disease. The predicted difference in daily sodium consumption between SNAP participants and low-income non-participants is 73 milligrams in a 2,000 calorie diet—a little less than the amount found in half of a one-ounce bag of potato chips. Adults with higher incomes were predicted to consume 158 milligrams more of sodium per day than SNAP participants. This chart is from “SNAP Participation and Diet Outcomes” in ERS’s Amber Waves magazine, November 2013.
Monday, November 18, 2013
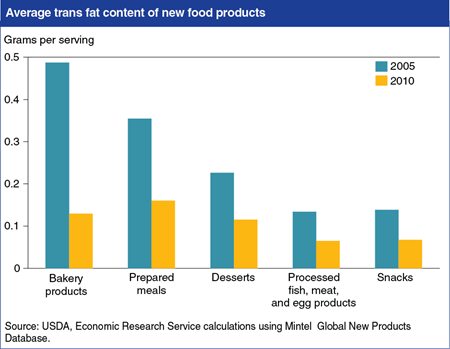
The U.S. Food and Drug Administration (FDA) announced on November 7th that it plans to take further steps to reduce trans fats in processed foods. Since 2006, the FDA has required food manufacturers to post the amount of trans fats contained in their products. In response to the labeling regulations and media attention to the negative health effects of trans fat consumption, food manufacturers reduced their use of trans fats. ERS researchers found that the average trans fat level for new bakery products (including reformulated ones) declined from 0.49 grams per serving in 2005 to 0.13 grams in 2010—a decline of 73 percent. Trans fat levels for new prepared meals, desserts, snacks, and processed fish, meat, and egg products declined by about 50 percent over the period. More information about trans fats in new food products can be found in the ERS report, New Food Choices Free of Trans Fats Better Align U.S. Diets With Health Recommendations, EIB-95, April 2012.
Thursday, October 31, 2013
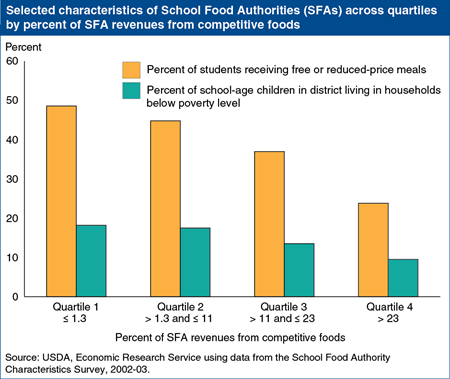
Beginning with the 2014-15 school year, competitive foods in U.S. schools—foods in cafeteria à la carte lines, vending machines, school stores, and other locations—will be subject to new nutrition standards aimed at creating a healthier nutrition environment. Concerns have been raised that the new standards may reduce revenues from competitive foods and hurt less affluent schools. ERS analysis of the 2002-03 School Food Authority Characteristics Survey found that revenues from competitive foods were highly skewed. School Food Authorities (SFAs), the foodservice management units for school districts, reported obtaining an average of 12 percent of their revenues from competitive foods. While 10 percent of SFAs received 36 percent or more of their revenues from competitive foods, revenue shares were smaller than average for the majority (54 percent) of SFAs. When separated into quartiles based on competitive foods’ share of total revenues, SFAs with higher shares were typically located in more affluent districts and served fewer low-income students receiving free and reduced-price meals than did schools with low competitive food revenues. This chart appears in “Eating Better at School: Can New Policies Improve Children’s Food Choices?” in the September 2013 Amber Waves.
Wednesday, September 11, 2013
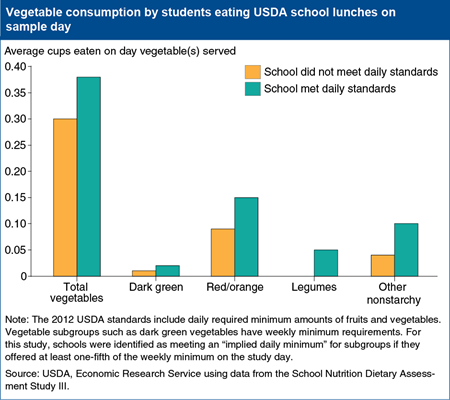
America’s schools are entering their second year of meeting new nutrition standards for USDA school lunches that feature whole grains, low-fat milk, more fruit, and a healthier mix of vegetables. To explore the question of whether children who are offered more fruits and vegetables will actually eat them, ERS researchers used a nationally representative survey of 242 schools in 2005 to match food intake data to that day’s lunch menus. After controlling for a number of student and school foodservice characteristics, serving more fruits and a healthier mix of vegetables did increase students’ vegetable consumption, although average amounts consumed were still small. For example, in schools that offered more total vegetables, students ate 0.38 cups of them at lunch on average versus the 0.30 cups eaten by students in schools that did not meet the total vegetables standard. Available alternatives mattered—students at schools that had no à la carte options, or only healthy à la carte options, had higher intakes of dark green vegetables. This chart appears in “Eating Better at School: Can New Policies Improve Children’s Food Choices?” in the September 2013 Amber Waves.
Monday, September 9, 2013
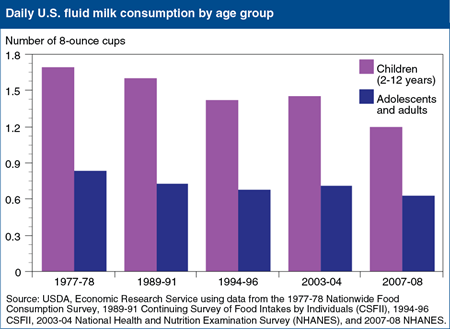
Federal dietary guidance recommends 2 cup-equivalents of dairy products per day for children ages 2-3 years, 2.5 for those ages 4-8, and 3 for Americans older than 8. However, per capita dairy consumption has been steady at about 1.5 cup-equivalents since the 1970s, despite a near tripling of cheese consumption. This static per capita dairy consumption is due to Americans drinking progressively less fluid milk—children as well as adults. USDA food intake surveys show a 25-percent decline in milk consumption by American teenagers and adults, from 0.8 cups per day in 1977-78 to 0.6 cups in 2007-08, and a 30-percent drop for children ages 2-12. In 2007-08, preadolescent children drank an average of 1.2 cups of milk per day versus 1.7 cups in 1977-78. This chart appears in “Americans Not Drinking Milk as Often as Their Parents Did” in ERS’s Amber Waves magazine, September 2013.
Friday, July 12, 2013
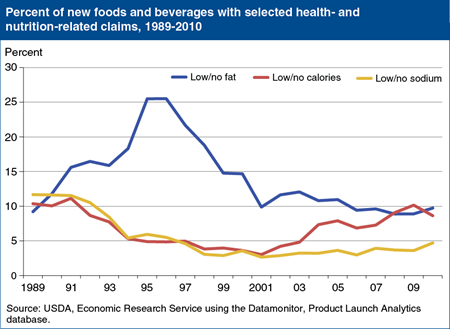
While Americans may be willing to forgo calories in their soft drinks and desserts, they seem less willing to embrace foods with lower fat and sodium levels. Mandatory nutrition labeling and consumer concerns about fat prompted food manufacturers to offer lower fat versions of high-fat foods in the early and mid-1990s. Products with “low/no fat” claims grew from 9 percent of all new products in 1989 to over 25 percent in 1996. But many consumers found the taste of these new fat-free and low-fat foods disappointing, which may have led companies to limit their use of low/no fat claims. From 1997 to 2001, the percentage of new products with low/no fat claims fell from 22 to 10 percent. Concerns that consumers associate poor taste with reduced-sodium foods may have contributed to fewer low/no sodium claims, as well. Products claiming to be “low/no sodium,” “low/no salt,” or “no salt added” fell from 12 percent of all new products in 1989 to 3 percent in 2001, before rising to 5 percent in 2010. This chart appears in “Obesity and Other Health Concerns Lead Food Companies To Step Up Health and Nutrient Claims” in ERS’s July 2013 Amber Waves magazine.
Wednesday, June 12, 2013
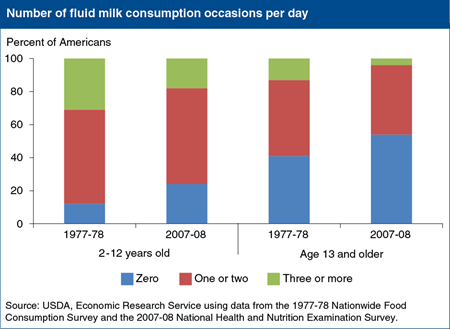
U.S. fluid milk consumption has fallen over the last 40 years from an average of 0.96 cups per person per day in 1970 to 0.61 cups in 2010. A recent ERS study found that changes in the frequency of drinking milk since the 1970s, not in portion sizes, contributed to the trend. Between 1977-78 and 2007-08, the share of children age 2-12 that did not drink fluid milk on a given day rose from 12 percent to 24 percent, while the share that drank milk three or more times per day dropped from 31 to 18 percent. The share of teenagers and adults who did not drink fluid milk on a given day rose from 41 to 54 percent, and the share that drank milk three or more times fell from 13 to 4 percent. This chart appears in the ERS report, Why Are Americans Consuming Less Fluid Milk? A Look at Generational Differences in Intake Frequency, ERR-149, released May 29, 2013.
Thursday, June 6, 2013
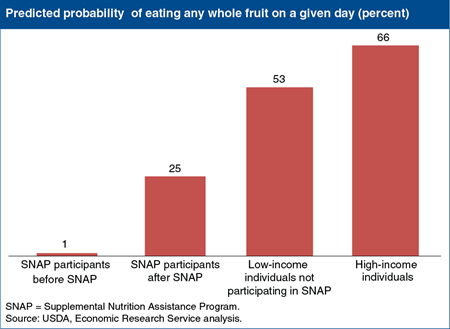
USDA’s Supplemental Nutrition Assistance Program (SNAP) provides eligible low-income households with monthly benefits to purchase food. One goal of the program is to support low-income families in making food choices consistent with dietary guidance. ERS researchers recently examined how the program affects the diets of participants. One finding that stands out is that SNAP increases the likelihood that participants will consume whole fruit by over 23 percentage points. Before participants enroll in SNAP, they rarely ever eat whole fruit on a given day. After they enroll in the program, SNAP participants have a 25-percent probability of eating whole fruit. Low-income individuals who are not participating in SNAP have a 53-percent probability and high-income individuals a 66-percent probability of eating whole fruit on a given day. This chart is based on statistics in Supplemental Nutrition Assistance Program (SNAP) Participation Leads to Modest Changes in Diet Quality, ERR-147, released April 24, 2013.
Tuesday, April 16, 2013
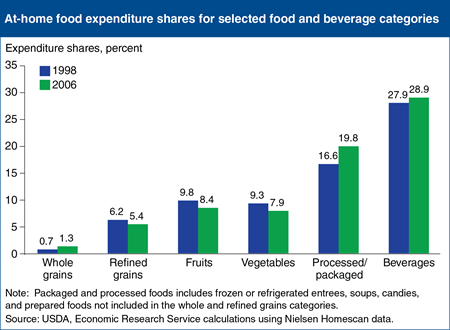
A healthy diet is the result of a chain of decisions extending from food purchase to consumption, with many of those decisions taking place in the grocery store. ERS researchers compared U.S. consumers’ at-home food purchases, as recorded by Nielsen Homescan panelists, with USDA food spending guidelines for obtaining a diet that meets the Dietary Guidelines. The ERS analysis found that food spending patterns showed little improvement between 1998 and 2006, except for an increase in the share of spending devoted to whole grains, coupled with a decline in refined grains’ share. On a less positive note, panelists allocated less of their food budgets to fruits and vegetables and more to packaged and processed foods and beverages. Expenditure shares for fruits and vegetables each fell by 1.4 percentage points between 1998 and 2006, while the expenditure share for packaged and processed foods rose by 3.2 percentage points. This chart appears in the February 2013 Amber Waves feature, Americans’ Food Choices at Home and Away: How Do They Compare With Recommendations?
Friday, March 22, 2013
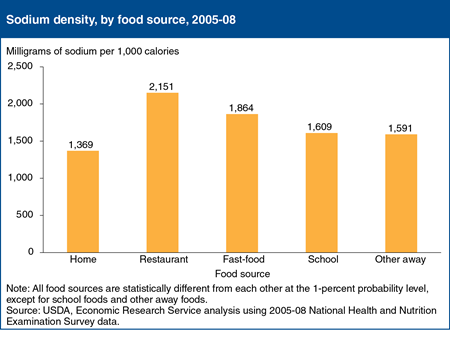
Intake data from the 2005-08 National Health and Nutrition Examination Survey (NHANES) reveal that Americans age 2 and older consumed an average of 3,085 milligrams (mg) of sodium per day, higher than the current Federal recommendation of less than 2,300 mg per day. Home foods—those obtained at supermarkets, convenience stores, and other retail outlets—provided 68 percent of Americans’ daily calories and 64 percent of sodium intake. Foods purchased from restaurants with wait staff were the most sodium dense at 2,151 mg of sodium per 1,000 calories, followed by fast-food fare at 1,864 mg per 1,000 calories. Home foods had a lower sodium density than away from home foods. The data for this chart came from “Americans’ Food Choices at Home and Away: How Do They Compare With Recommendations?” in the February 2013 issue of ERS’s Amber Waves magazine.
Wednesday, February 27, 2013
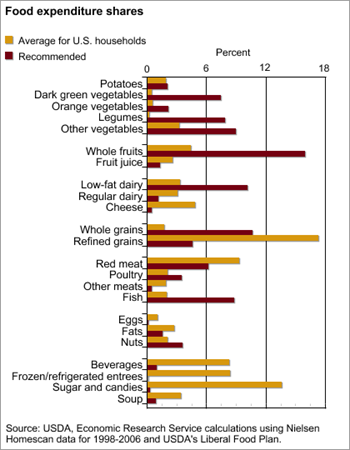
With food prepared at home accounting for close to two-thirds of Americans’ daily calories, purchasing choices made in the grocery store are the first steps to a healthy diet. ERS researchers compared consumers’ 1998-2006 grocery store purchases with USDA food spending guidelines for a nutritious diet and found that consumer spending came close to matching the guidelines for only 1 food category examined—potatoes. Grocery purchases as recorded by Nielsen Homescan panelists were compared with nutritionally-appropriate expenditure shares for 23 broad categories of foods and beverages. Panelists underspent on all vegetable categories, except potatoes. For example, they spent only 0.5 percent of their food budgets on dark green vegetables, while the food plan recommended 7 percent. Panelists also underspent on whole grains, whole fruit, lower fat dairy, nuts, poultry, and fish. They overspent on refined grains, fruit juices, regular dairy products, red meats, beverages, and sugar and candies. This chart appears in “Americans’ Food Choices at Home and Away: How Do They Compare With Recommendations?” in the February 2013 issue of ERS’s Amber Waves magazine.
Friday, February 1, 2013
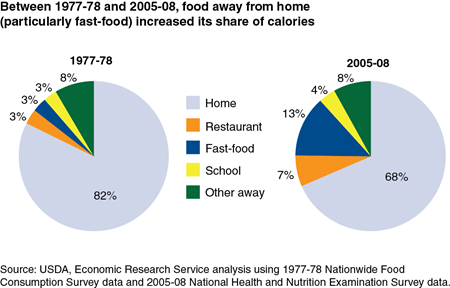
Intake data from the 2005-08 National Health and Nutrition Examination Survey (NHANES) reveal that Americans age 2 and older consumed an average of 2,002 calories per day, with 68 percent of those calories coming from at-home foods obtained at supermarkets, convenience stores, and other retail outlets. Thirty years ago, at-home foods accounted for 82 percent of U.S. caloric intake. Between 1977 and 2008, the share of calories from foods purchased at restaurants with wait staff doubled from 3.3 to 6.7 percent and fast-food places’ share grew from 3.1 to 13.2 percent. School’s share of total caloric intake rose from 3.0 to 3.7 percent. This chart appears in the ERS report, Nutritional Quality of Food Prepared at Home and Away From Home, 1977-2008, EIB-105, December 2012. See also the blog post in USDA’s Science Tuesday series.
Tuesday, January 15, 2013
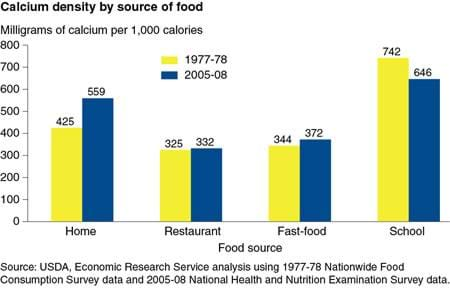
A recent analysis by ERS of national food consumption surveys found that Americans' average calcium intake rose from 743 milligrams (mg) a day in 1977-78 to 919 mg in 2005-08. The calcium density of at-home foods bought in supermarkets, convenience stores, and other retail outlets rose from 425 mg per 1,000 calories in 1977-78 to 559 mg in 2005-08. The calcium density of foods purchased at restaurants, fast food places, and other away-from-home sources remained relatively constant at 452-460 mg per 1,000 calories. Calcium densities between the two periods were the same or higher for foods from restaurants and fast-food places. The calcium density of foods obtained at school dropped between 1977-78 and 2005-08, probably due to increased availability of non-USDA foods and beverages for sale in schools. This chart appears in the ERS report, Nutritional Quality of Food Prepared at Home and Away From Home, 1977-2008, EIB-105, December 2012.
Wednesday, January 9, 2013
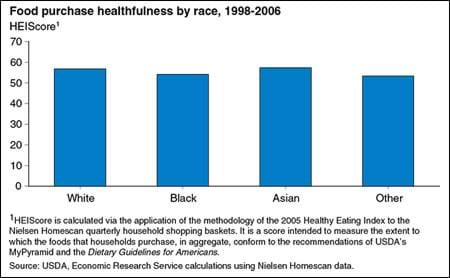
Researchers in health, nutrition, and epidemiology have established a causal link between dietary quality and health outcomes, such as obesity, overweight, and diabetes. Additional research has shown that the incidence of these detrimental outcomes can vary substantially across racial and ethnic groups in the United States. ERS researchers examined the healthfulness of grocery purchases as it varies by race in an effort to determine the role that food prepared at home might play in these differences. The healthfulness of household grocery purchases was assessed by using USDA’s Healthy Eating Index. Shopping baskets were assigned scores from 0-100 based on adherence to the Dietary Guidelines for Americans. The findings demonstrate that the differences across racial groups are small. At-home food purchases were slightly more healthful for Whites (including Hispanics) and Asians than they were for Blacks and people of other races. More importantly, the results show that people of all races have much room for improvement in their dietary quality. This chart appears in the ERS report, Assessing the Healthfulness of Consumers’ Grocery Purchases, EIB-102, November 2012.
Tuesday, December 18, 2012
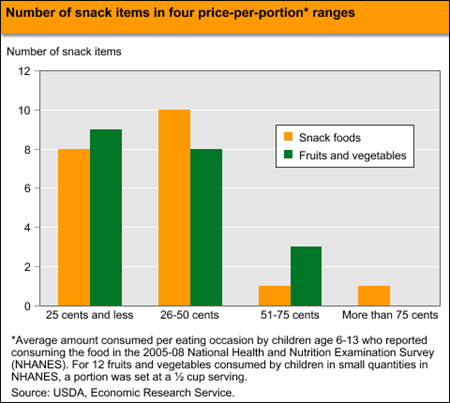
Replacing calorie-dense snack foods with calorie-sparse fruits and vegetables can be one step in addressing childhood obesity and does not have to compromise a family’s food budget. An ERS analysis of prices per portion for 20 common snack foods and 20 potential fruit and vegetable substitutes found that 9 of the 20 fruits and vegetables and 8 of the 20 snack foods cost 25 cents per portion or less; an additional 8 fruits and vegetables and 10 snack foods cost between 26 and 50 cents per portion. On average, the 20 fruits and vegetables cost 31 cents per portion and the 20 snack foods cost 33 cents per portion. A household making all possible 400 substitutions between the 20 snack foods and the 20 fruits and vegetables would save an average of 2 cents and 126 calories per swap. The statistics in this chart are from "Gobbling Up Snacks: Cause or Potential Cure for Childhood Obesity?" in the December 2012 issue of ERS’ Amber Waves magazine.


