
Competitive foods are a larger portion of school foodservice revenues in more affluent districts
- by Economic Research Service
- 10/31/2013
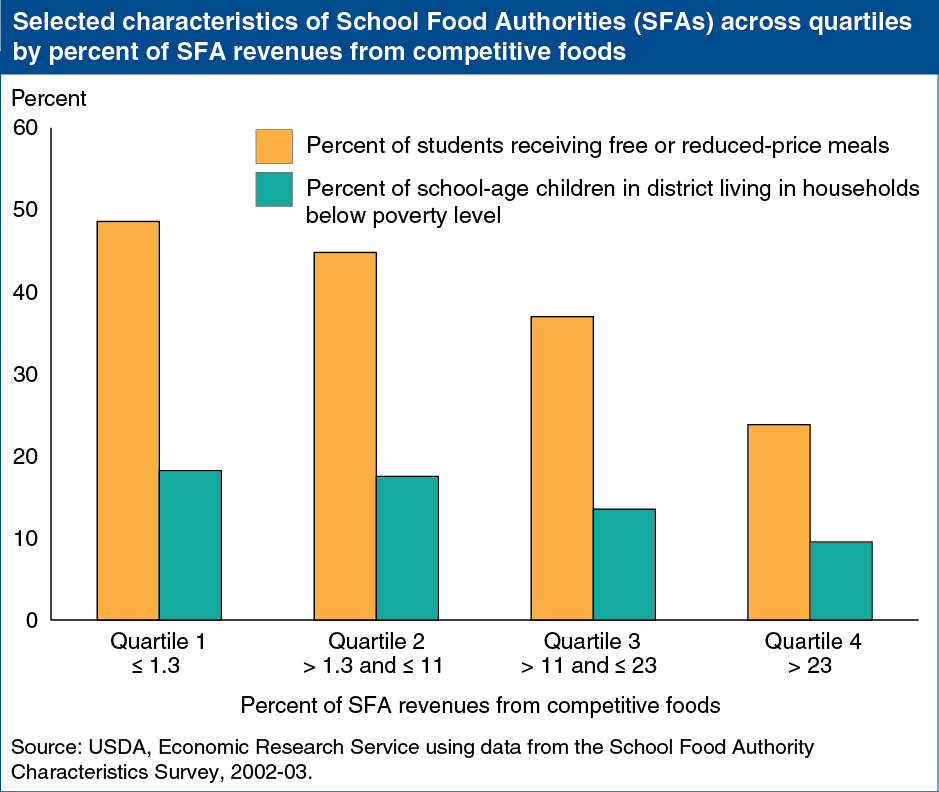
Beginning with the 2014-15 school year, competitive foods in U.S. schools—foods in cafeteria à la carte lines, vending machines, school stores, and other locations—will be subject to new nutrition standards aimed at creating a healthier nutrition environment. Concerns have been raised that the new standards may reduce revenues from competitive foods and hurt less affluent schools. ERS analysis of the 2002-03 School Food Authority Characteristics Survey found that revenues from competitive foods were highly skewed. School Food Authorities (SFAs), the foodservice management units for school districts, reported obtaining an average of 12 percent of their revenues from competitive foods. While 10 percent of SFAs received 36 percent or more of their revenues from competitive foods, revenue shares were smaller than average for the majority (54 percent) of SFAs. When separated into quartiles based on competitive foods’ share of total revenues, SFAs with higher shares were typically located in more affluent districts and served fewer low-income students receiving free and reduced-price meals than did schools with low competitive food revenues. This chart appears in “Eating Better at School: Can New Policies Improve Children’s Food Choices?” in the September 2013 Amber Waves.