ERS Charts of Note
Subscribe to get highlights from our current and past research, Monday through Friday, or see our privacy policy.
Get the latest charts via email, or on our mobile app for  and
and 
ICYMI… More time spent working on the farm leads to less off-farm labor across different commodities
Thursday, August 1, 2019
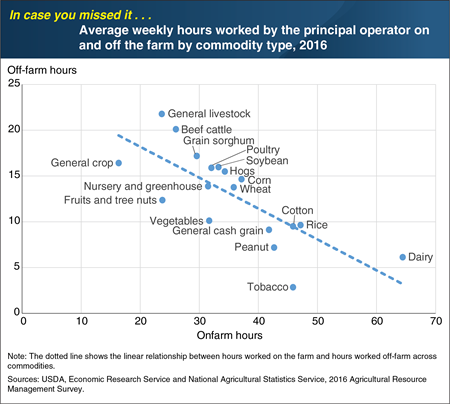
Survey data show that the more time a household allots to its farm operation, the less time is available for off-farm employment. Many farm operations require primarily part-time or seasonal work, which can allow household members to work off-farm with little interruption to the farming operation. Across all farms by commodity type, average onfarm hours worked by the principal operator in 2016 ranged from 16 hours per week for general crop farms (where no one crop accounted for a majority of the value of production) to 64 hours per week for dairy farms. Time spent working on the farm limits the time available not only for off-farm employment but also for housework, family, sleep, and leisure activities. Accordingly, the amounts of time spent working on and off the farm are negatively correlated across all commodity types. For example, dairy farmers, who tend to have the most rigid farm schedules, work only 6 hours per week off-farm on average. By comparison, beef cattle farmers tend to have highly flexible schedules and, consequently, spend an average of 20 hours per week working off-farm. This chart updates data found in the August 2018 ERS report, Economic Returns to Farming for U.S. Farm Households. Survey data is drawn from the 2016 Agricultural Resource Management Survey (ARMS), jointly administered by the National Agricultural Statistics Service and the Economic Research Service. This Chart of Note was originally published February 14, 2019.
Monday, July 22, 2019
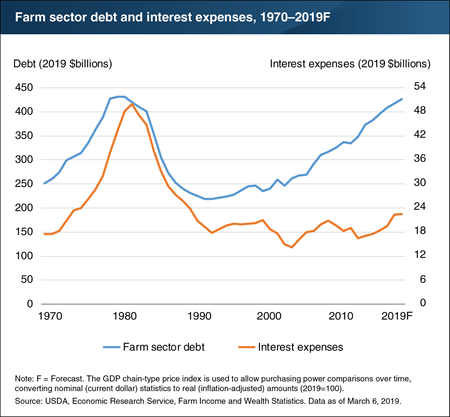
Farm sector debt has reached levels near the peak levels of the late 1970s and early 1980s. High levels of debt increase a farm’s risk of going out of business. From 1993 to 2017, real (inflation-adjusted) farm debt increased by 87 percent, or 4 percent per year on average. ERS forecasts farm debt to increase 2 percent in both 2018 and 2019. When adjusted for inflation, total farm sector debt in 2019 is forecast to be 4 percent ($4 billion) below the peak reached in 1980. Interest paid on farm debt remained relatively stable from 1990 through 2013, as interest rates declined. However, interest expenses in 2019 are forecast to increase 38 percent ($6 billion) compared to 2013. Interest expenses in 2019 are forecast to be 18 percent above the 30-year average, 19 percent above the 10-year average, but 55 percent below the peak in 1982. This chart updates data found in the July 2018 Amber Waves feature, “Current Indicators of Farm Sector Financial Health.” Find additional information and analysis on ERS’s Farm Sector Income and Finances topic page.
Friday, June 14, 2019
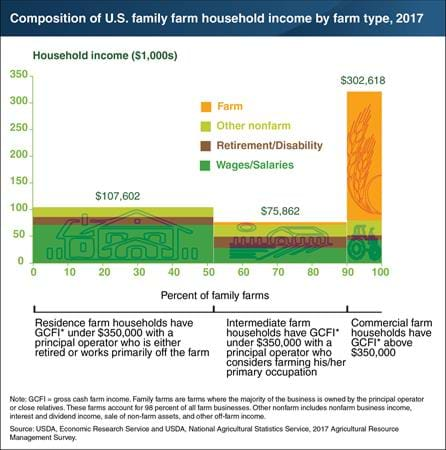
The composition of family farm household income varies by the type of farm. For example, households operating commercial family farms earned most of their income on the farm ($225,264 on average in 2017). Residence family farm households relied mostly on off-farm wages and salaries ($69,493 on average). Intermediate family farm households, meanwhile, had relatively high retirement and disability income ($19,222 on average), in part because these households had the oldest principal operators on average. Less than half of all farm households had positive incomes from their farm operations in 2017. Among commercial farm households, 86 percent had positive income from farming, compared to 51 percent of intermediate farm households and 35 percent of residence farm households. At the median, U.S. farm households earned $67,500 from non-farm sources, compared to a median loss of $800 from farming operations. This chart appears in the Amber Waves infographic “Farm Households Rely on Many Sources of Income,” published June 2019.
Thursday, May 23, 2019
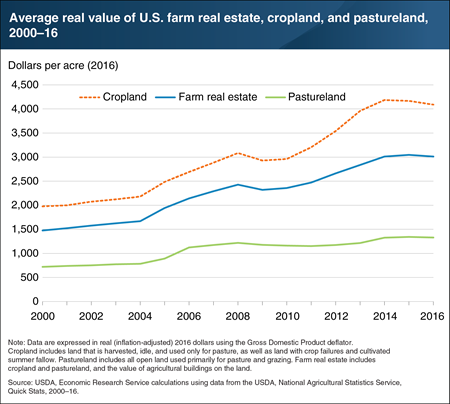
Farm real estate (including farmland and the structures on the land) accounts for over 80 percent of farm-sector assets and represents a significant investment for many farms. Beginning in the mid-2000s, higher farm incomes and lower interest rates contributed to rapid appreciation. Nationally, average per-acre farm real estate values more than doubled when adjusted for inflation, from $1,483 in 2000 to $3,010 in 2016. Two major uses of farmland are cropland and pastureland. From 2003 to 2014, U.S. cropland values doubled, appreciating faster than pastureland and reflecting a rise in grain and oilseed commodity prices. However, the value of cropland and farm real estate dipped slightly in 2008–09, reflecting the effect of the Great Recession and the downturn in the U.S. housing market. In contrast, average U.S. pastureland values remained relatively flat. This chart appears in the February 2018 ERS report, Farmland Values, Land Ownership, and Returns to Farmland, 2000–2016.
Monday, April 29, 2019
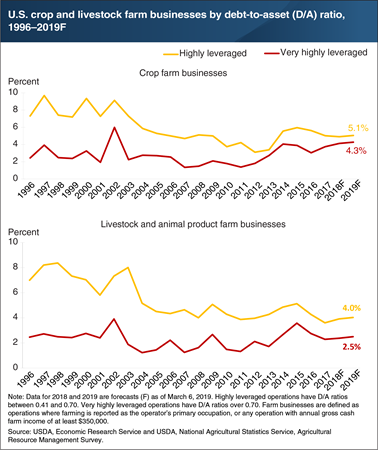
Farm businesses—operations where farming is reported as the operator’s primary occupation or that have at least $350,000 in annual sales—accounted for more than 94 percent of U.S. farm sector production in 2017. That year, farm businesses held 90 percent of all farm assets and 96 percent of farm debt. Debt-to-asset (D/A) ratios measure the amount of assets that are financed by debt, and can indicate a farm’s risk exposure and ability to overcome adverse financial events. The share of farm businesses that are highly leveraged (D/A ratio between 0.41 and 0.70) has fallen since 2015, but is forecast to increase slightly in 2018 and 2019. Farm businesses specializing in crops tend to have higher shares of both highly and very highly leveraged operations (D/A ratio over 0.70) than farm businesses specializing in livestock and animal products. In 2019, ERS forecasts 4.3 percent of crop farm businesses to be very highly leveraged, the highest share since 2002. Lending institutions consider D/A ratios (along with other measures reflecting the likelihood of default) when evaluating the credit worthiness of farms, so some of these highly and very highly leveraged farm businesses may have difficulty securing a loan. This chart updates data from the April 2014 ERS report, Debt Use by U.S. Farm Businesses, 1992–2011.
Thursday, April 25, 2019
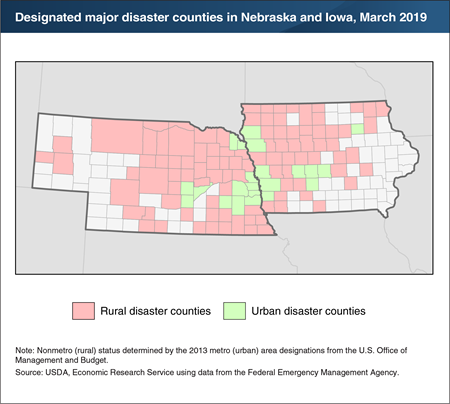
In March 2019, historic flooding led to a major disaster declaration covering 121 counties in Iowa and Nebraska. The disaster declaration covers nearly half of the population in Iowa and 93 percent of the population in Nebraska. Of the 3.3 million people living in one of the designated disaster counties in 2017, over 37 percent (1.2 million) lived in rural areas. In 2017, Iowa and Nebraska were the second- and fourth-ranked States, respectively, in agricultural cash receipts. Iowa also ranked second in total agricultural exports and was the top exporter of soybeans, pork, corn, and feed grains. Nebraska led the Nation in beef and veal exports, and ranked third among States in corn, processed grain products, and feed grain exports. Based on the 2017 Census of Agriculture, designated disaster counties produced 66 percent of the market value of agricultural products sold in Iowa and 75 percent of those sold in Nebraska. Together, the designated disaster counties accounted for 9.2 percent of the total U.S. market value of agricultural products sold in 2017. This chart uses data from the ERS State Facts Sheet data product, updated March 2019.
Thursday, April 11, 2019
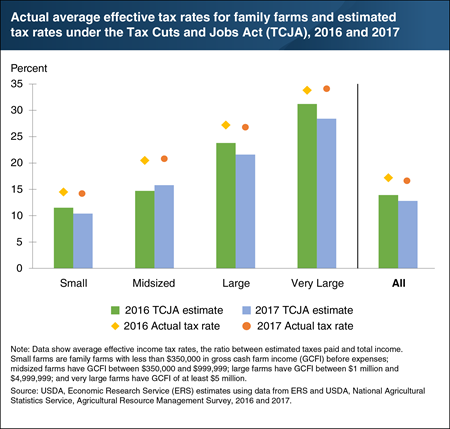
The Tax Cuts and Jobs Act (TCJA), enacted in December 2017, eliminates or modifies many itemized deductions and tax credits, while lowering Federal income tax bracket rates on individual and business income. Had the TCJA been in place in 2016, family farm households would have faced an estimated average effective tax rate of 13.9 percent, compared to the actual 17.2 percent effective tax rate that year. Had the TCJA also been in effect in 2017, the average effective tax rate would have been 12.8 percent, more than a percentage point lower than had it been in effect in 2016. By comparison, the actual effective tax rate in 2017 was 16.8 percent. The estimates vary by farm size. For example, small family farms would experience the lowest average effective tax rates, at 11.5 percent in 2016 and 10.4 percent in 2017. Only midsized family farms would have experienced an increase in their average tax rate, from 14.7 percent in 2016 to 15.8 percent in 2017. Those rates are still below the actual tax rates midsized farms experienced: 20.5 percent in 2016 and 20.8 percent in 2017. This chart updates data found in the June 2018 ERS report, Estimated Effects of the Tax Cuts and Jobs Act on Farms and Farm Households. For more on this topic, see “The Tax Cuts and Jobs Act Would Have Lowered Average Income Tax Rates for Farm Households between 2016 and 2017” in the April 2019 edition of Amber Waves.
Wednesday, March 6, 2019
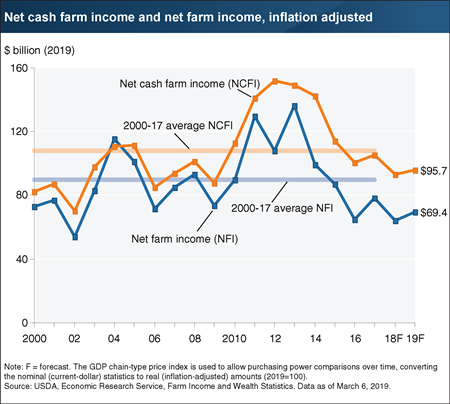
Inflation-adjusted U.S. net cash farm income in 2019 is forecast to increase $2.7 billion (2.9 percent) to $95.7 billion, while U.S. net farm income (a broader measure of farm sector profitability that incorporates non-cash items, including changes in inventories, economic depreciation, and gross imputed rental income) is forecast to increase $5.2 billion (8.1 percent) to $69.4 billion. The 2019 forecast increases are due to a combination of lower production expenses, which are subtracted out in the calculation of net income, and increases in the value of agricultural sector production. These factors contributing to higher income are expected to more than offset the forecast decline in direct Government farm payments. If forecast increases are realized, net farm income and net cash farm income would be 22.9 percent and 11.5 percent below their respective averages calculated over the 2000-17 period. Find additional information and analysis on ERS’s Farm Sector Income and Finances topic page, reflecting data released March 6, 2019.
Thursday, February 14, 2019
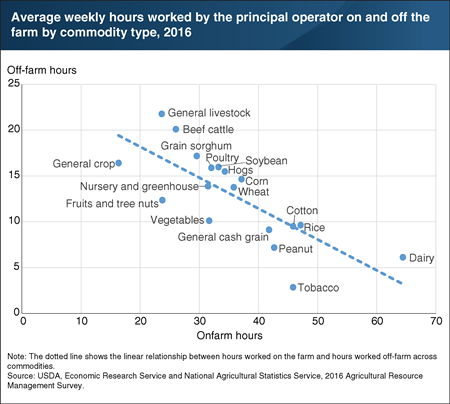
Survey data show that the more time a household allots to its farm operation, the less time is available for off-farm employment. Many farm operations require primarily part-time or seasonal work, which can allow household members to work off-farm with little interruption to the farming operation. Across all farms by commodity type, average onfarm hours worked by the principal operator in 2016 ranged from 16 hours per week for general crop farms (where no one crop accounted for a majority of the value of production) to 64 hours per week for dairy farms. Time spent working on the farm limits the time available not only for off-farm employment but also for housework, family, sleep, and leisure activities. Accordingly, the amounts of time spent working on and off the farm are negatively correlated across all commodity types. For example, dairy farmers, who tend to have the most rigid farm schedules, work only 6 hours per week off-farm on average. By comparison, beef cattle farmers tend to have highly flexible schedules and, consequently, spend an average of 20 hours per week working off-farm. This chart updates data found in the August 2018 ERS report, Economic Returns to Farming for U.S. Farm Households. Survey data is drawn from the 2016 Agricultural Resource Management Survey (ARMS), jointly administered by the National Agricultural Statistics Service and the Economic Research Service.
Friday, December 14, 2018
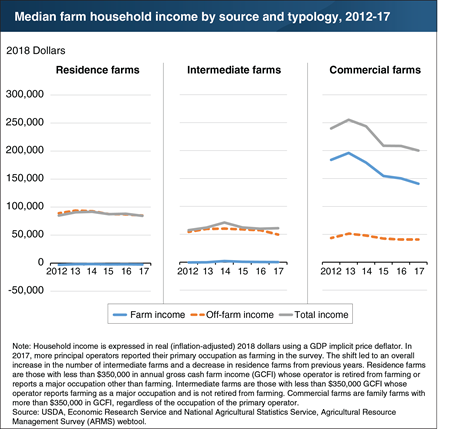
The median total household income for commercial U.S. farms is estimated to decline from $239,526 in 2012 to $200,090 in 2017. By comparison, the median farm income for residence and intermediate farms is estimated to remain relatively unchanged. In 2017, the median total household income for residence and commercial farms remained above the median income for all U.S. households ($63,172), despite declines in total income. Farm households rely on a combination of on-farm and off-farm sources of income. On-farm sources include income from the farm business, which is determined by farm costs and returns that often vary from year to year. In any given year, a significant number of farm households report negative farm income. Off-farm sources—including wage income, nonfarm business earnings, dividends, and transfers—are the main contributor to household income for residence and intermediate farms. The heavier reliance on off-farm income of these farms makes them less susceptible to changes in farming costs and returns than commercial farms. Because households operating commercial farms rely most on on-farm sources of income, they experience the largest drop in their total household income when farm sector income falls. This chart uses data from the new ERS and NASS Agricultural Resource Management Survey webtool, released December 2018.
Friday, November 30, 2018
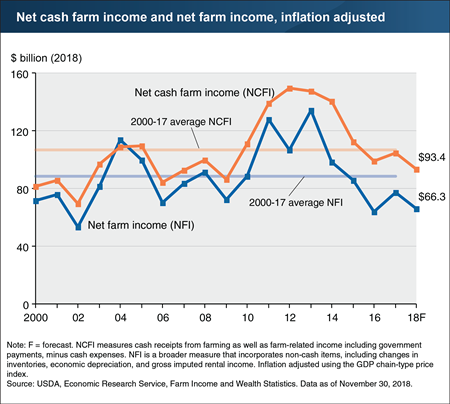
Inflation-adjusted U.S. net cash farm income is forecast to decline $10.9 billion (10.5 percent) to $93.4 billion in 2018, while U.S. net farm income (a broader measure of farm sector profitability that incorporates non-cash items, including changes in inventories, economic depreciation, and gross imputed rental income) is forecast to decline $10.8 billion (14.1 percent) to $66.3 billion. If forecast declines are realized, net cash farm income would be the lowest since 2009; net farm income would be 3.3 percent above its level in 2016 (its lowest since 2002). Both profitability measures are forecast below their long-term averages.
The forecast declines are due to a combination of higher production expenses, which are subtracted out in the calculation of net income, as well as a decline in the value of agricultural sector production. However, direct Government farm payments are forecast to increase $1.8 billion (15.2 percent) to $13.6 billion in 2018, reflecting higher anticipated payments for supplemental and ad hoc disaster assistance and miscellaneous programs, including Market Facilitation Program payments to assist farmers in response to trade disruptions. Find additional information and analysis in Highlights From the November 2018 Farm Income Forecast, released November 30, 2018.
Monday, November 5, 2018
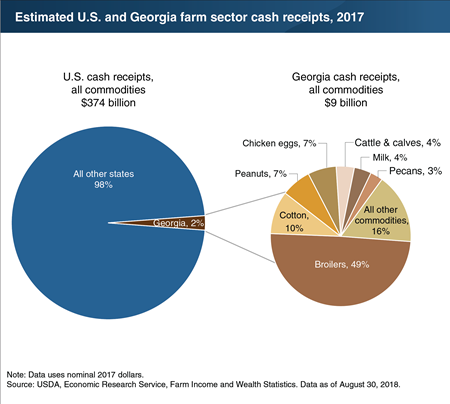
Each August, ERS estimates the previous year’s farm sector cash receipts—the cash income received from agricultural commodity sales. Historical State-level estimates provide baseline information that can be useful in gauging the financial impact of unexpected events that affect the agricultural sector, such as the recent hurricane that struck Georgia and surrounding States. In 2017, cash receipts for all U.S. farm commodities totaled $374 billion. Georgia contributed about 2 percent ($9 billion) of that total, ranking 15th among all States. Broilers (chickens that are raised for meat) accounted for the largest share of cash receipts in Georgia at $4.4 billion (49 percent of Georgia’s cash receipts)—followed by cotton at $878 million (10 percent of Georgia’s receipts. Georgia led the Nation in cash receipts from broilers and ranked second in cotton cash receipts, behind Texas. Georgia also led the country in cash receipts from peanuts and pecans—accounting for 47 percent and 38 percent, respectively, of the U.S. totals for those commodities—although they amounted to a smaller share of the State’s total cash receipts. This chart uses data from the ERS U.S. and State-Level Farm Income and Wealth Statistics data product, updated August 2018.
Friday, October 19, 2018
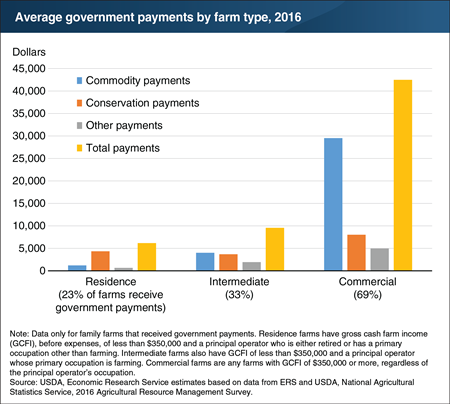
Federal Government programs distribute payments each year to farms, farm operators, and their households. For example, USDA’s Conservation Reserve Program and Environmental Quality Incentive Program provide payments to operators for conservation purposes. And USDA’s commodity programs, such as Price Loss Coverage and Agriculture Risk Coverage, pay producers when prices or revenues fall below a certain level. “Other payments” include disaster assistance programs and other Federal, State and local programs. In 2016, only 23 percent of all residence farms and 33 percent of all intermediate farms received any government payments, compared to 69 percent of all commercial farms. The amount of government payments received varied by farm type. Commercial farms that received payments got an average of $42,459, with commodity payments accounting for the majority (70 percent) of the total. On the other hand, conservation payments were relatively more important for residence and intermediate farms—accounting for about 70 percent and 38 percent of total payments, respectively. This chart updates data found in the August 2018 ERS report, Economic Returns to Farming for U.S. Farm Households.
Monday, October 15, 2018
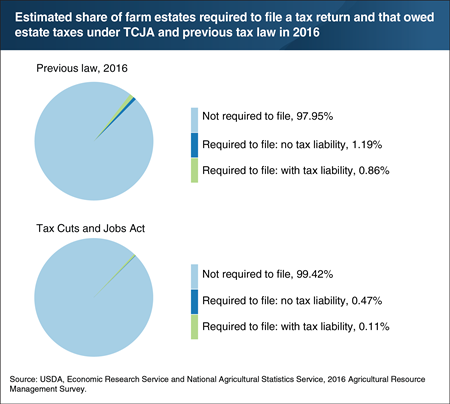
The Tax Cuts and Jobs Act (TCJA), passed in December 2017, doubled the Federal estate tax exemption amount to $11.18 million per individual. The estate tax exemption amount has increased significantly since 2000, when the exemption was $675,000, resulting in fewer farm estates that must file a tax return and that owe estate taxes. ERS researchers estimated that 39,214 farm estates were created in 2016 and, had the TCJA been in effect in 2016, only 0.58 percent of these farm estates would have been required to file an estate tax return. After accounting for adjustments, deductions, and expenses, 0.11 percent would have owed estate taxes, with an aggregate estate tax liability estimated at $104 million. By comparison, ERS estimated that under the previous law, 2.05 percent of farm estates were required to file an estate tax return in 2016 and that 0.86 percent owed estate taxes. The aggregate liability was estimated at $496 million. This chart uses data found in the June 2018 ERS report, Estimated Effects of the Tax Cuts and Jobs Act on Farms and Farm Households.
Monday, September 24, 2018
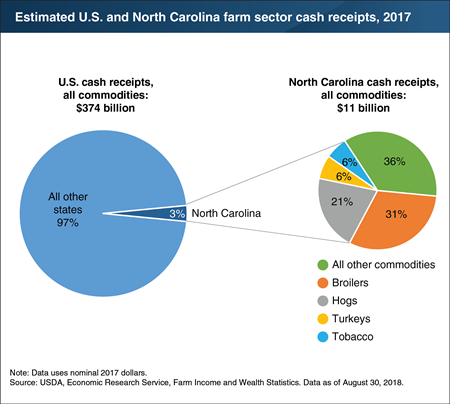
Each August, as part of the its Farm Income data product, ERS produces estimates of the prior year’s farm sector cash receipts—the cash income the sector receives from agricultural commodity sales. State-level estimates provide background information about States subject to unexpected changes that affect the agricultural sector, such as the recent hurricane that struck North Carolina and surrounding States. In 2017, cash receipts for all U.S. farm commodities totaled $374 billion. North Carolina contributed about 3 percent ($11 billion) of that total, ranking eighth among all States. Broilers (chickens that are raised for meat) accounted for the largest share of cash receipts in North Carolina at 31 percent ($4 billion), compared to 12 percent nationwide—followed by hogs at 21 percent ($2 billion), compared to 11 percent nationwide. The State ranked third in the nation in cash receipts for both broilers and hogs. North Carolina led the country in cash receipts from tobacco, sweet potatoes, and turkeys—accounting for 50, 47, and 15 percent of the U.S. total for those commodities, respectively—although they contributed a smaller share of the State’s total cash receipts. This chart uses data from the ERS U.S. and State-Level Farm Income and Wealth Statistics data product, updated August 2018.
Monday, September 17, 2018
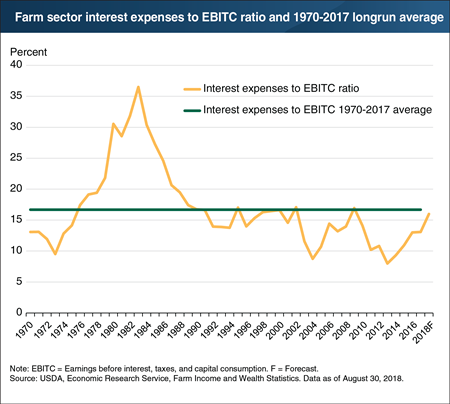
The ratio of interest expenses to earnings before interest, taxes, and capital consumption (interest-to-EBITC) measures the farm sector’s ability to pay interest expenses on outstanding debt out of its earnings—a useful metric of the sector’s financial durability. High interest rates and low farm income caused the interest-to-EBITC ratio to peak at 37 percent in 1983—a development that coincided with higher rates of farm bankruptcies and loan defaults. After 1983, the interest-to-EBITC ratio declined year after year until 1995 and reached its 1970-2017 low of 8 percent in 2013. ERS’s 2018 forecast of 16 percent remains below the longrun average of 17 percent. A 16-percent EBITC means that 16 percent of net farm earnings—before interest, taxes, and capital consumption—are spent on interest payments. Although inflation-adjusted farm debt increased 84 percent from 1994 (the lowest value since 1964) to 2017 (the most current estimate), interest expenses have remained relatively stable because of declining interest rates. If farm income remains near current levels and interest rates increase as currently forecast, projected interest expense-to-farm earnings ratios suggest that the farm sector as a whole is unlikely to face extensive debt repayment challenges by 2019. However, if farm income falls substantially, more farmers will find it difficult to meet their debt obligations. This chart updates data found in the July 2018 Amber Waves feature, “Current Indicators of Farm Sector Financial Health.”
Wednesday, August 22, 2018
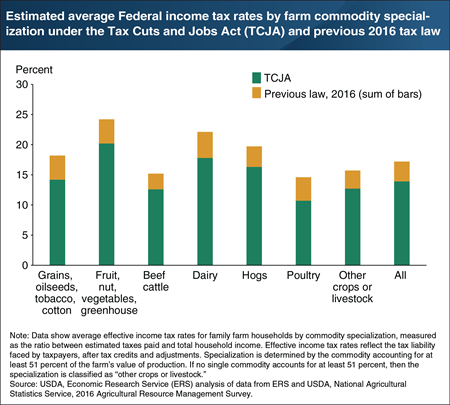
The Tax Cuts and Jobs Act (TCJA) of 2017 eliminates or modifies many itemized deductions and tax credits, while lowering tax bracket rates on individual and business income. Had the TCJA been in place in 2016, ERS estimates that family farm households would have experienced a decline of 3.3 percentage points on average in their effective tax rate—the share of income paid in taxes after tax credits and adjustments are taken into account. The effects of the TCJA vary across specializations. Dairy producers would have experienced the largest decline at 4.3 percentage points. This was largely due to the new TCJA deduction for business income, since dairy farmers tend to earn a higher share of total household income from the farm business. Producers of beef cattle, which represented the greatest number of farms of any specialty in 2016, would have experienced the smallest decline at 2.6 percentage points. Beef cattle producers generally operate small farms with farm income making up a lower share of their total household income, which results in smaller tax reductions than for farm households with a higher share of farm income. This chart uses data found in the June 2018 ERS report, Estimated Effects of the Tax Cuts and Jobs Act on Farms and Farm Households.
Wednesday, August 15, 2018
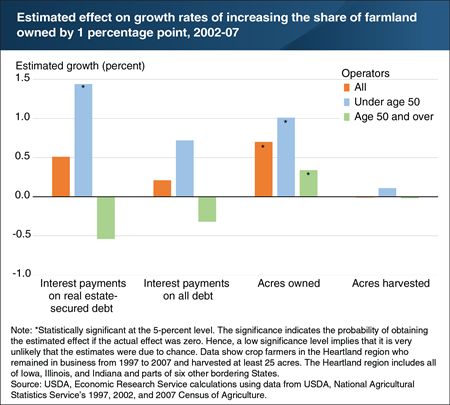
For many farmers, farm real estate represents a substantial share of total household wealth and is the most important source of equity used to secure loans. Recent ERS research tested the extent to which owning a larger share of their land allowed farmers in different age groups to borrow more, buy more land, or expand operations. Younger farmers (under age 50 in 1997) may need more credit (because they are in a growth phase of the business) and may be more constrained by their wealth (because they have less of it). For younger farmers, owning an additional 1 percent of one’s land increased the growth rate of interest expenses on real estate-secured debt by 1.44 percentage points between 1997 and 2007. Younger farmers with larger land wealth gains also bought more land: owning an additional 1 percent of one’s land increased the growth rate in land owned by 1.01 percentage points. For the average farm in the sample, that would increase interest expenses by $281, debt by $3,465, and land owned by 4.9 acres. There was no significant effect for older farmers. This chart appears in the February 2018 Amber Waves feature, “Changing Farmland Values Affect Renters and Landowners Differently.”
Thursday, August 2, 2018
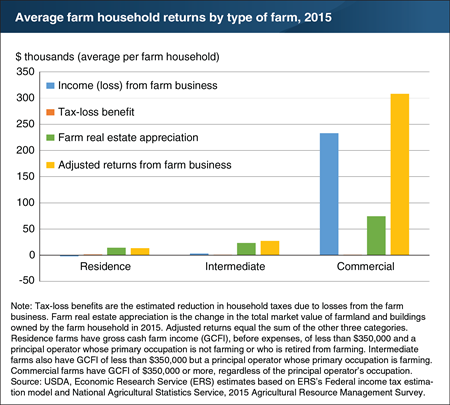
Of the roughly 2 million U.S. farm households, more than half report negative income from their farming operations each year. Most farms are small, and the proportion incurring farm losses is higher for households operating smaller farms—where most or all of their income is typically derived from off-farm activities. However, many households offset their off-farm income with these farm losses, thus reducing their taxable income. Also, in many years, farm real estate values have increased, which bolsters the economic returns for farmland owners. When these tax-loss benefits and changes in farm real estate values are taken into consideration, the returns to farming increased in 2015. For example, for residence farm households, estimated average returns increased from a negative $2,241 to positive $13,619. The increases in average returns for intermediate and commercial farm households were even greater. Finally, the share of total farm households with positive returns from their farm operation rose from 43 percent to 70 percent, primarily due to the broad increases in farmland real estate prices in 2015. This chart appears in the August 2018 ERS report, Economic Returns to Farming for U.S. Farm Households.
Tuesday, July 3, 2018
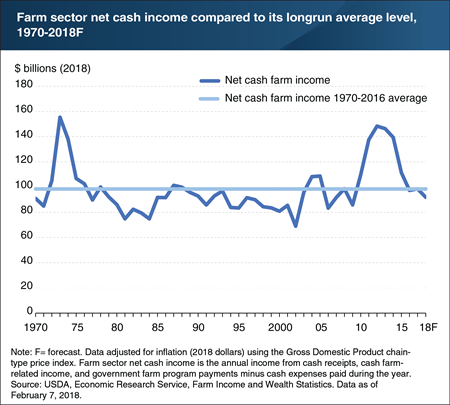
Farm sector net cash farm income is a measure of the profitability of farming and, hence, the ability of farmers to meet their loan obligations, invest in new machinery, remain in production, expand their operations, and provide for family living expenses. Beginning in 2010, inflation-adjusted farm sector net cash income rose to near record highs, peaking in 2012. Much of this growth was due to commodity cash receipts, which increased by $113.2 billion from 2009 to 2014. Between 2012 and 2016, however, farm sector net cash income fell 33 percent to $97.3 billion. This is the largest multiyear decline since the 1970s in both absolute and percentage terms. Slowing global demand, a strengthening dollar, and large inventories depressed crop as well as animal and animal product prices and contributed to the decline. Although the decline is large, when viewed over a longer time horizon, net cash farm income has returned near levels seen before the record growth from 2010 to 2013. ERS forecasts net cash farm income in 2018 to be 7 percent below the average across 1970-2016. This chart appears in the July 2018 Amber Waves feature, “Current Indicators of Farm Sector Financial Health.”


