
Note: Updates to this page are discontinued. The material—last updated on August 8, 2023—remains on the site for reference.
The Coronavirus (COVID-19) pandemic led to significant changes in U.S. consumers’ food spending patterns in early 2020 before returning to pre-pandemic spending patterns. While closures of restaurants and nonessential businesses contributed to record unemployment increases during March and April 2020, unemployment fell to below pre-pandemic levels by December 2021. Although income and employment improved, some U.S. households continue to face difficulties obtaining adequate food, particularly in the face of increasing food prices.
USDA, Economic Research Service (ERS) data products and data collaborations provide insights into the pandemic’s effects on food spending, food prices, and food sufficiency. Current information is available from the ERS Food Expenditure Series, the ERS Food Price Outlook, and the U.S Bureau of the Census Household Pulse Survey—developed in collaboration with ERS and other agencies.
- Food Spending During the Pandemic
- Food Prices During the Pandemic
- Food Sufficiency During the Pandemic: The Household Pulse Survey
Food Spending During the Pandemic
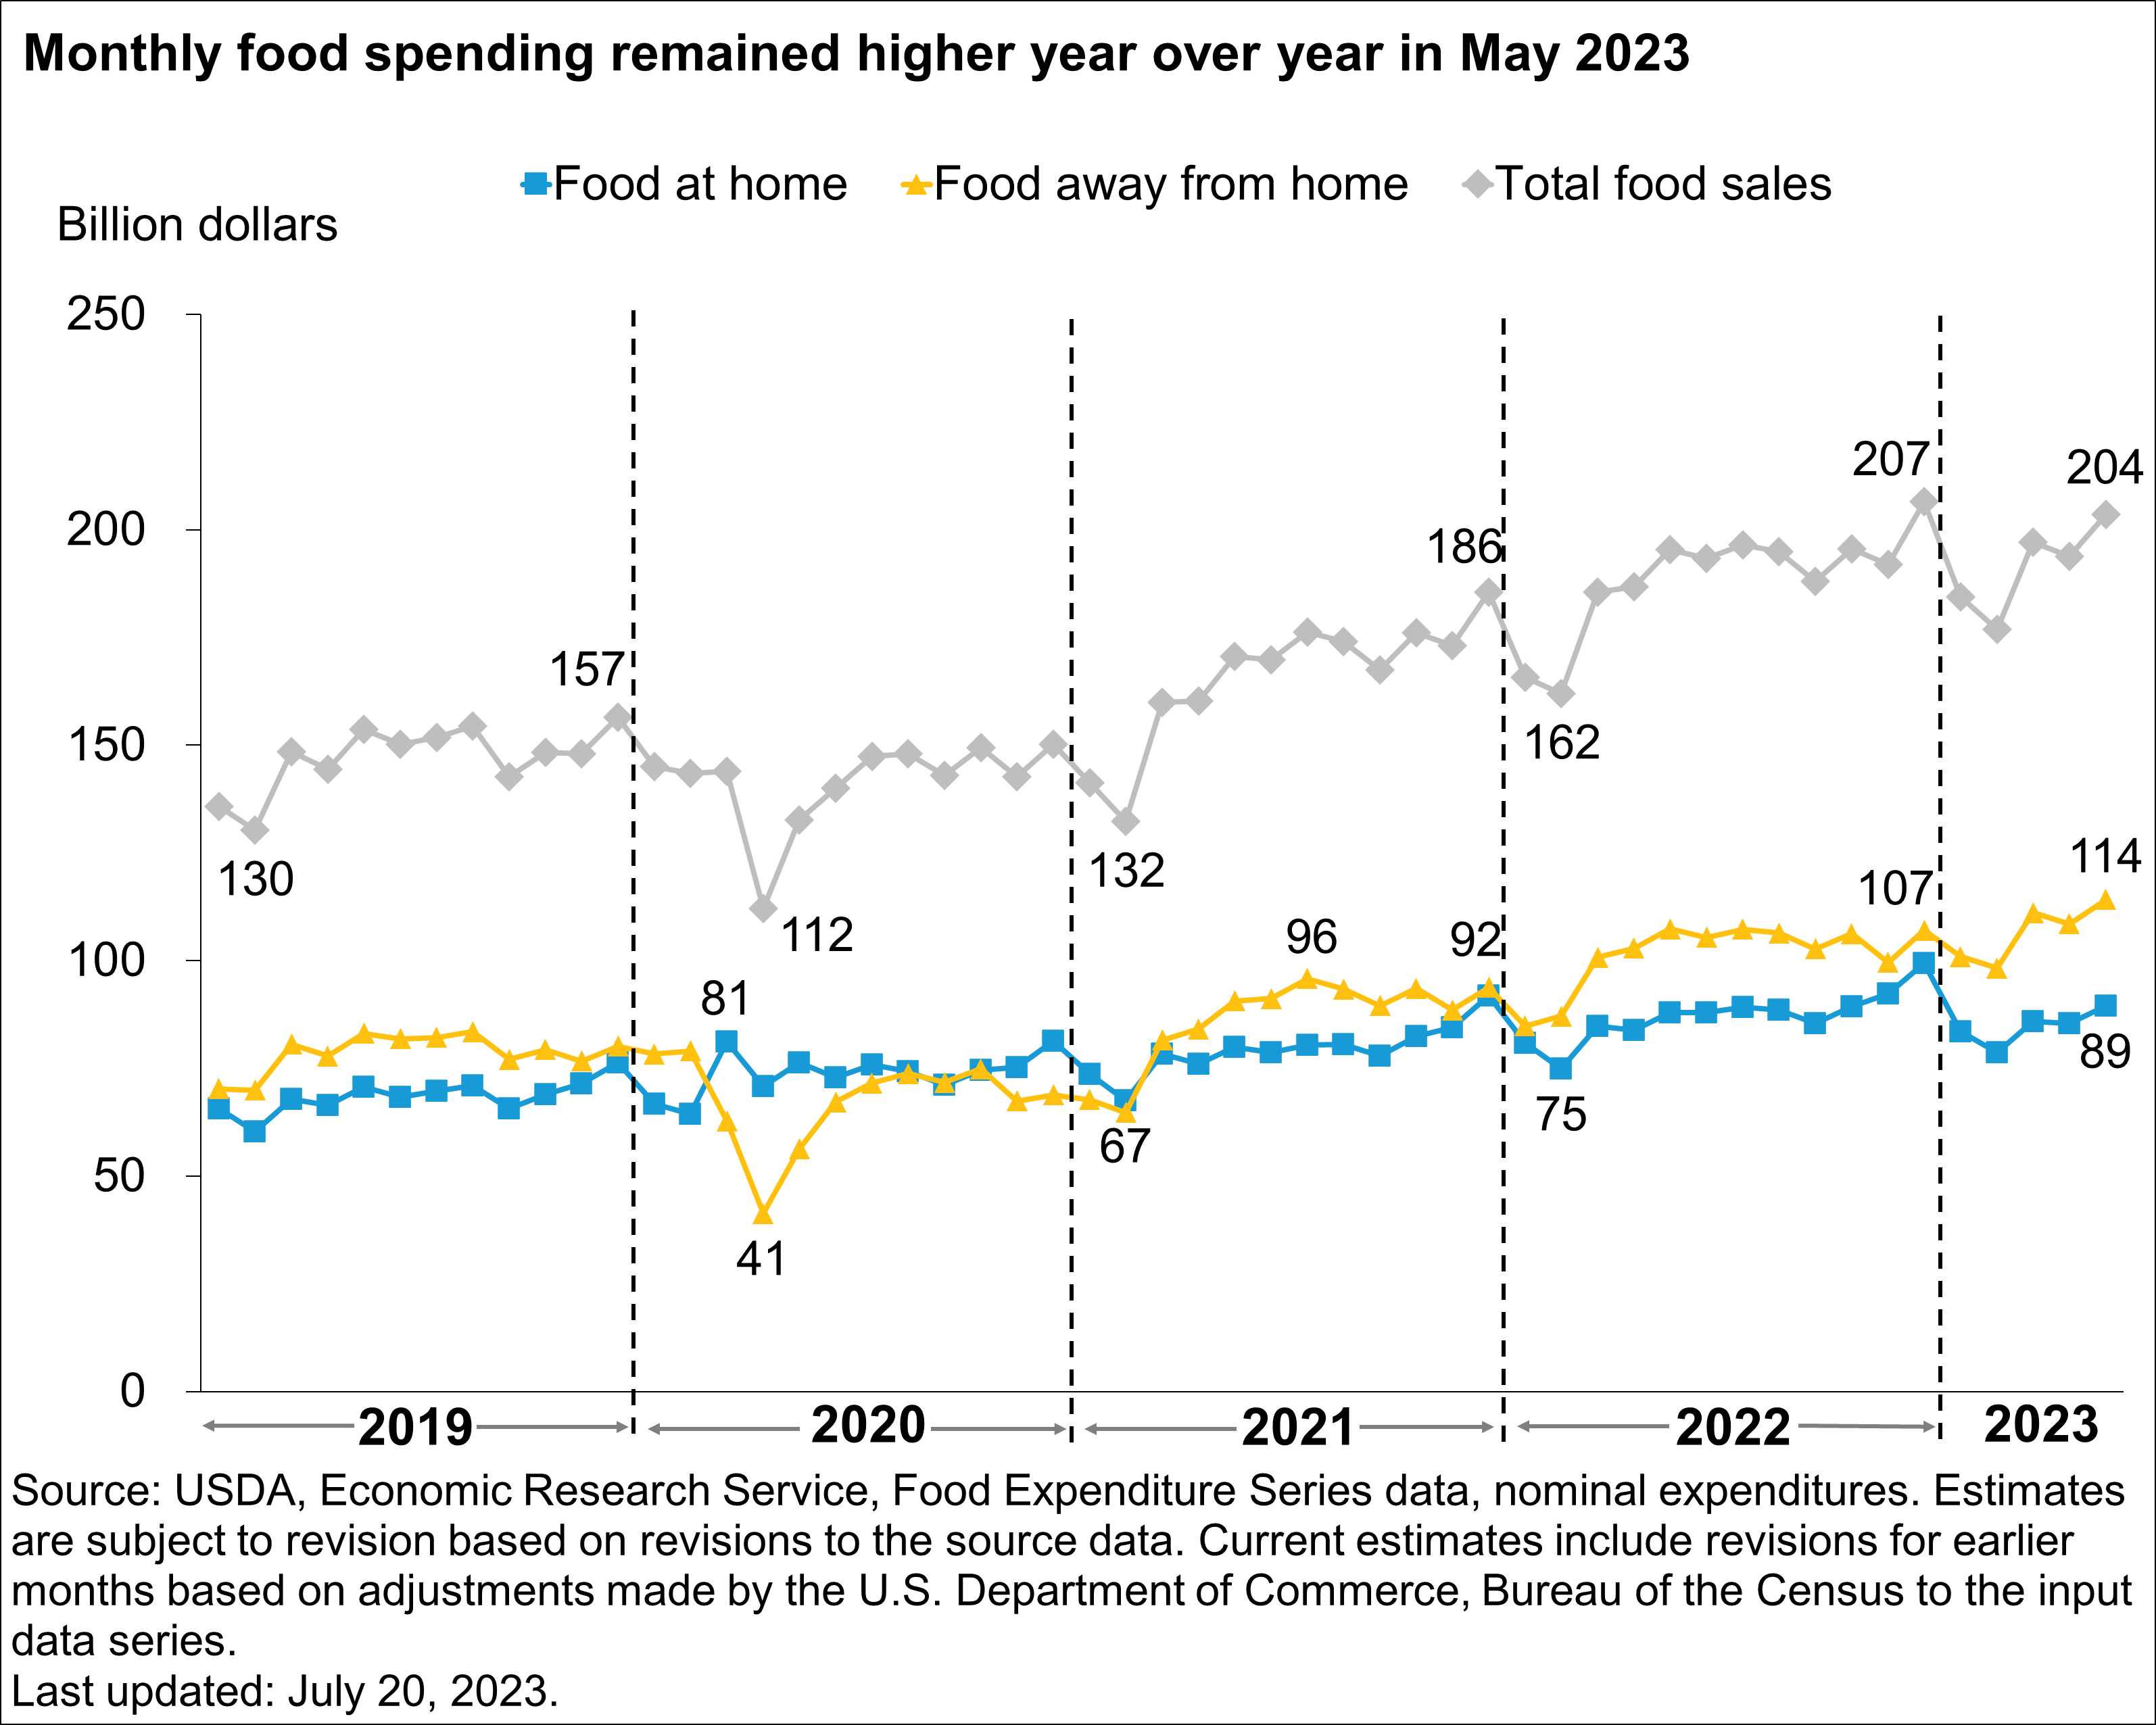
Analyzing data from the USDA, ERS Food Expenditure Series found May 2023 expenditures at food-away-from-home establishments—restaurants, school cafeterias, sports venues, and other eating-out establishments—increased by 5.2 percent compared to April 2023 and were 6.3 percent higher than May 2022. Such food expenditures remained higher than pre-pandemic levels after their steep decline in March 2020 when the Coronavirus (COVID-19) pandemic began. In March 2020, efforts to limit the spread of COVID-19 included stay-at-home orders that led to significant changes in U.S. consumers’ food spending patterns. Following a sharp decline during March–April 2020, food-away-from-home spending returned to pre-pandemic levels by April 2021. Food-away-from-home spending outpaced food-at-home spending in each month since March 2021, returning to the pattern seen during each month of 2019. Total food expenditures presented year-over-year increases from March 2021 through May 2023.
While higher expenditures partially reflect inflation, total inflation-adjusted expenditures on food (not shown) were 6.0 percent higher in May 2023 compared with May 2019.
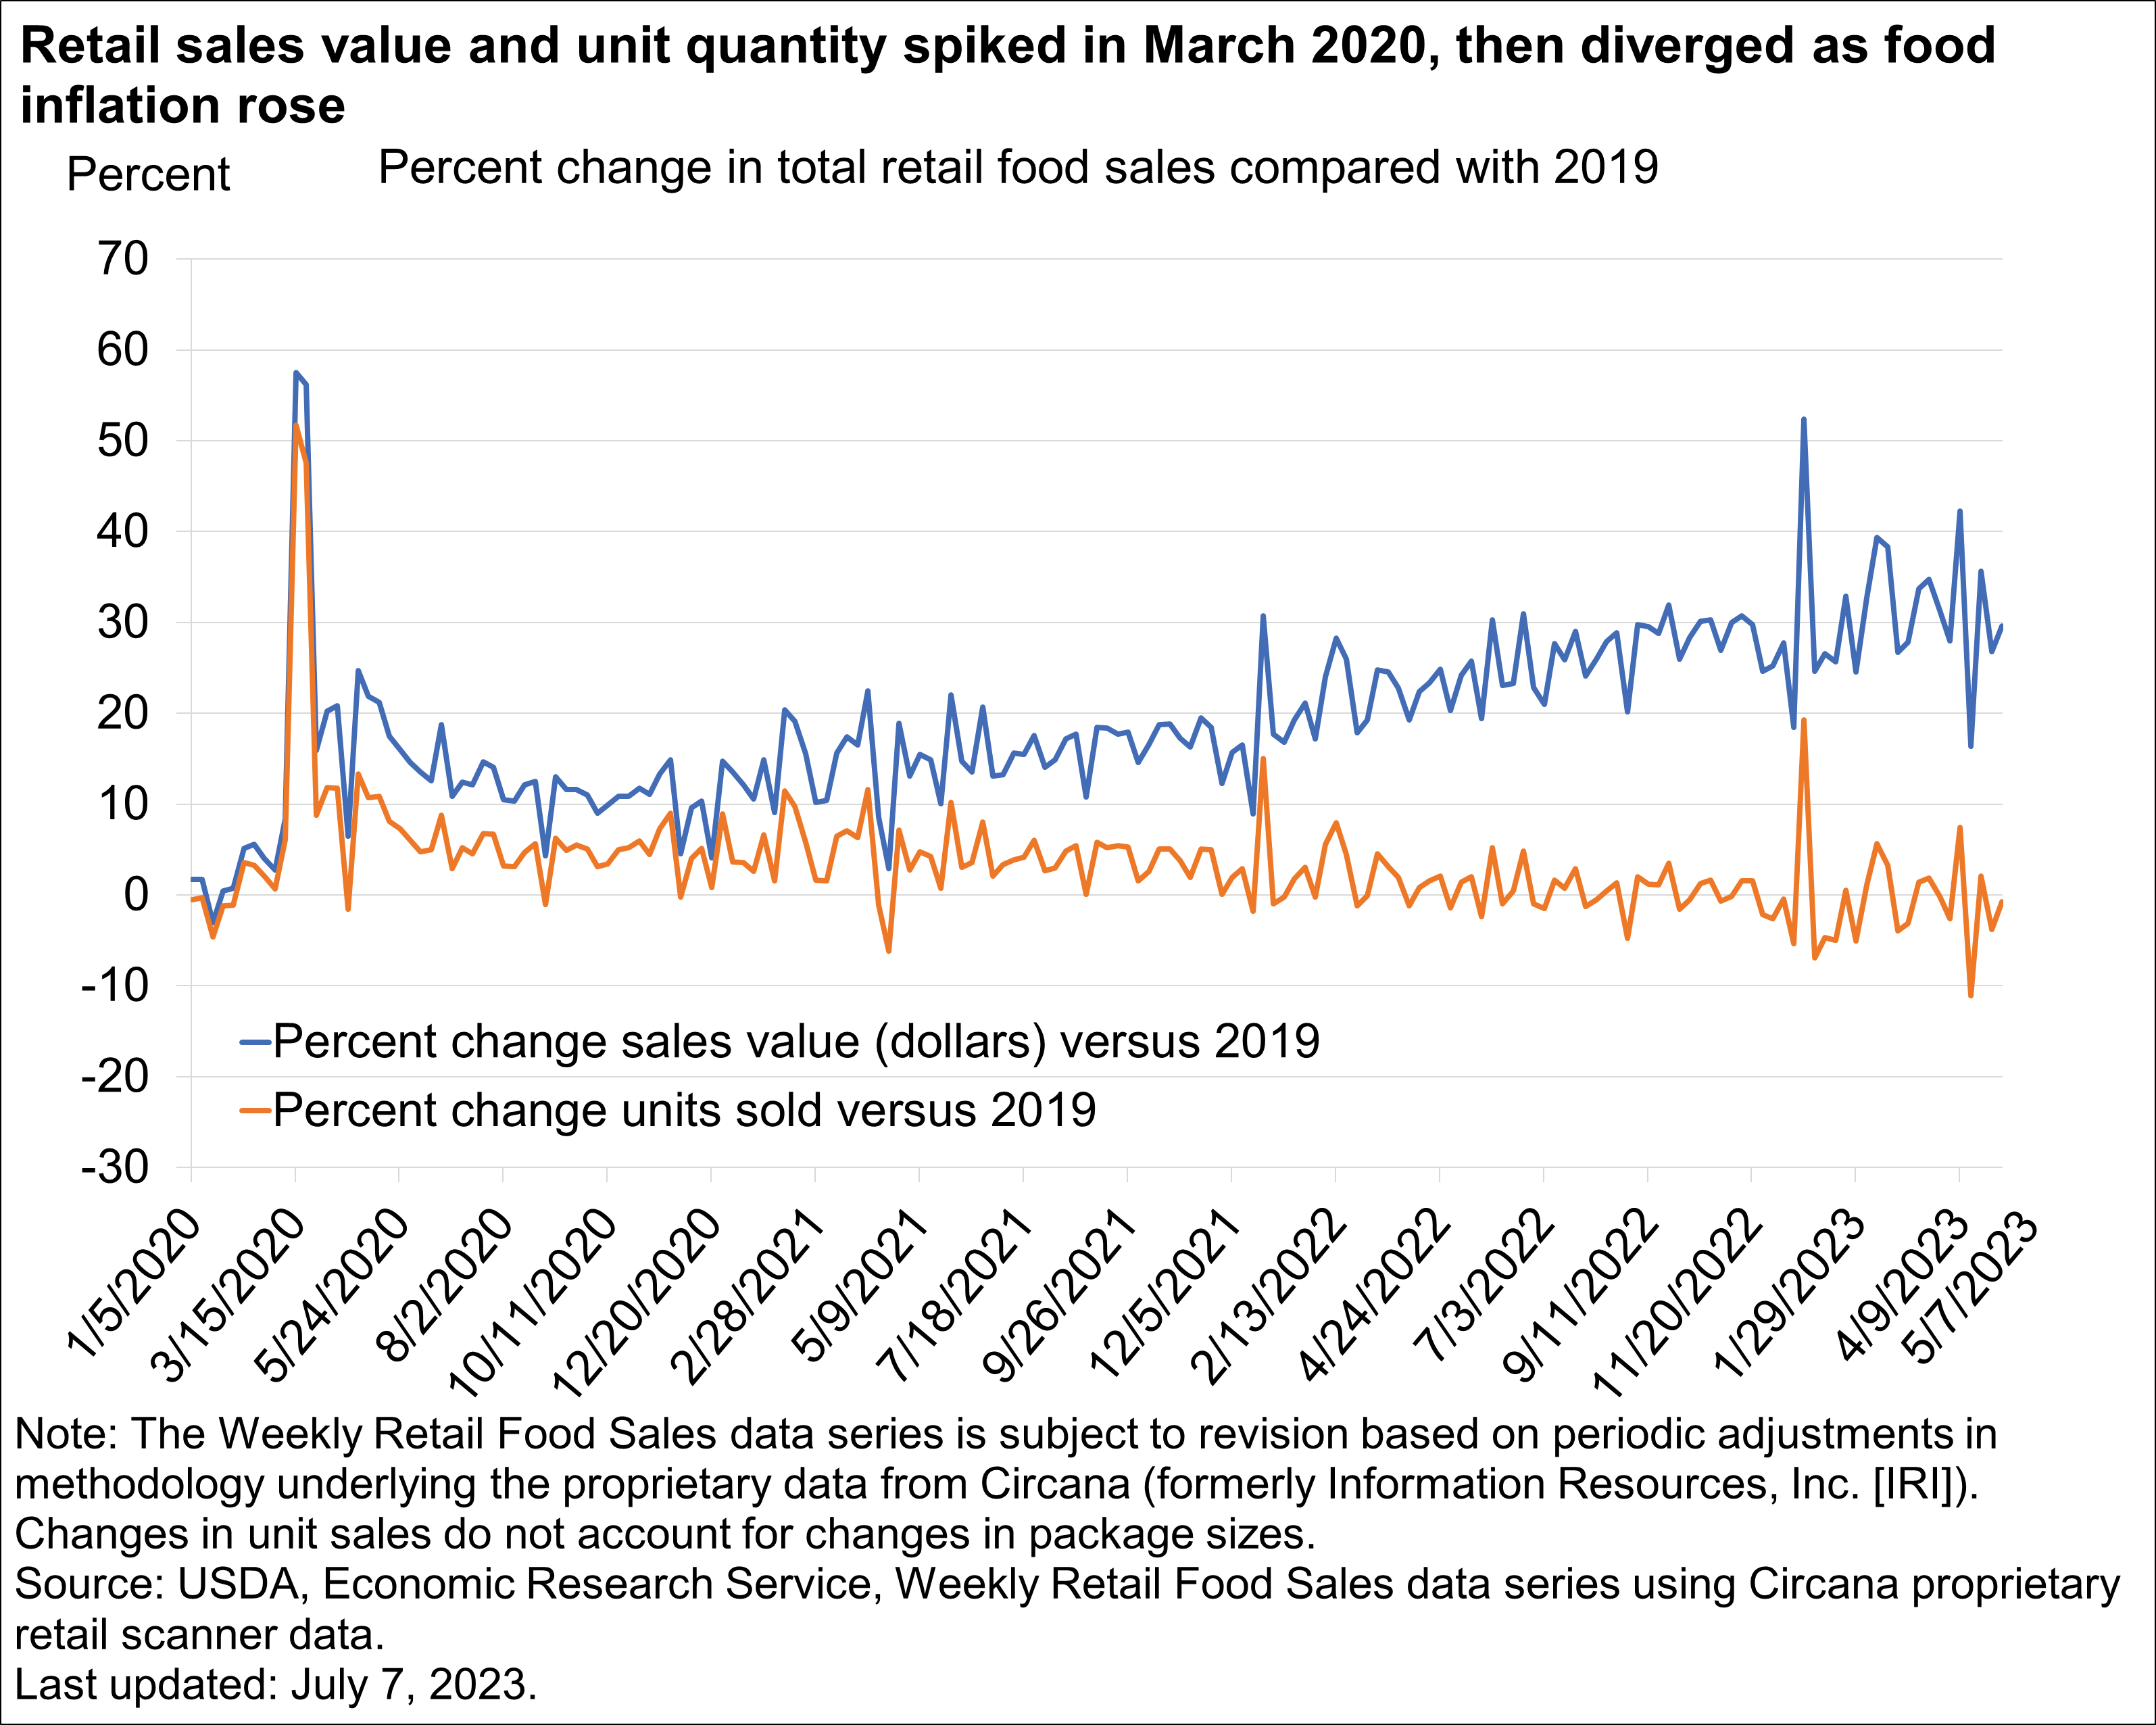
The USDA, ERS Weekly Retail Food Sales data series provided a more current and detailed picture of food-at-home retail sales during the pandemic. Early in the COVID-19 pandemic, retail food sales rose sharply and peaked during March 9–22, 2020, with 57.5 and 56.2 percent higher food-at-home sales compared with the same weeks in 2019. Sales values stabilized but remained higher than 2019 through 2022, largely due to inflation (see ERS Data Products Show Food-At-Home Price Inflation From Producers to Consumers). Food at home sales quantities–number of units purchased–in 2022 declined from 2020 and 2021 but remained slightly higher than 2019. By the week ending May 7, 2023, the value of food retail sales was 29.6 percent above the same week in 2019, while quantity was 0.8 percent lower than in 2019. However, unit quantity sales do not capture if consumers made changes in response to rising prices, such as switching to more economical products or buying larger package sizes.
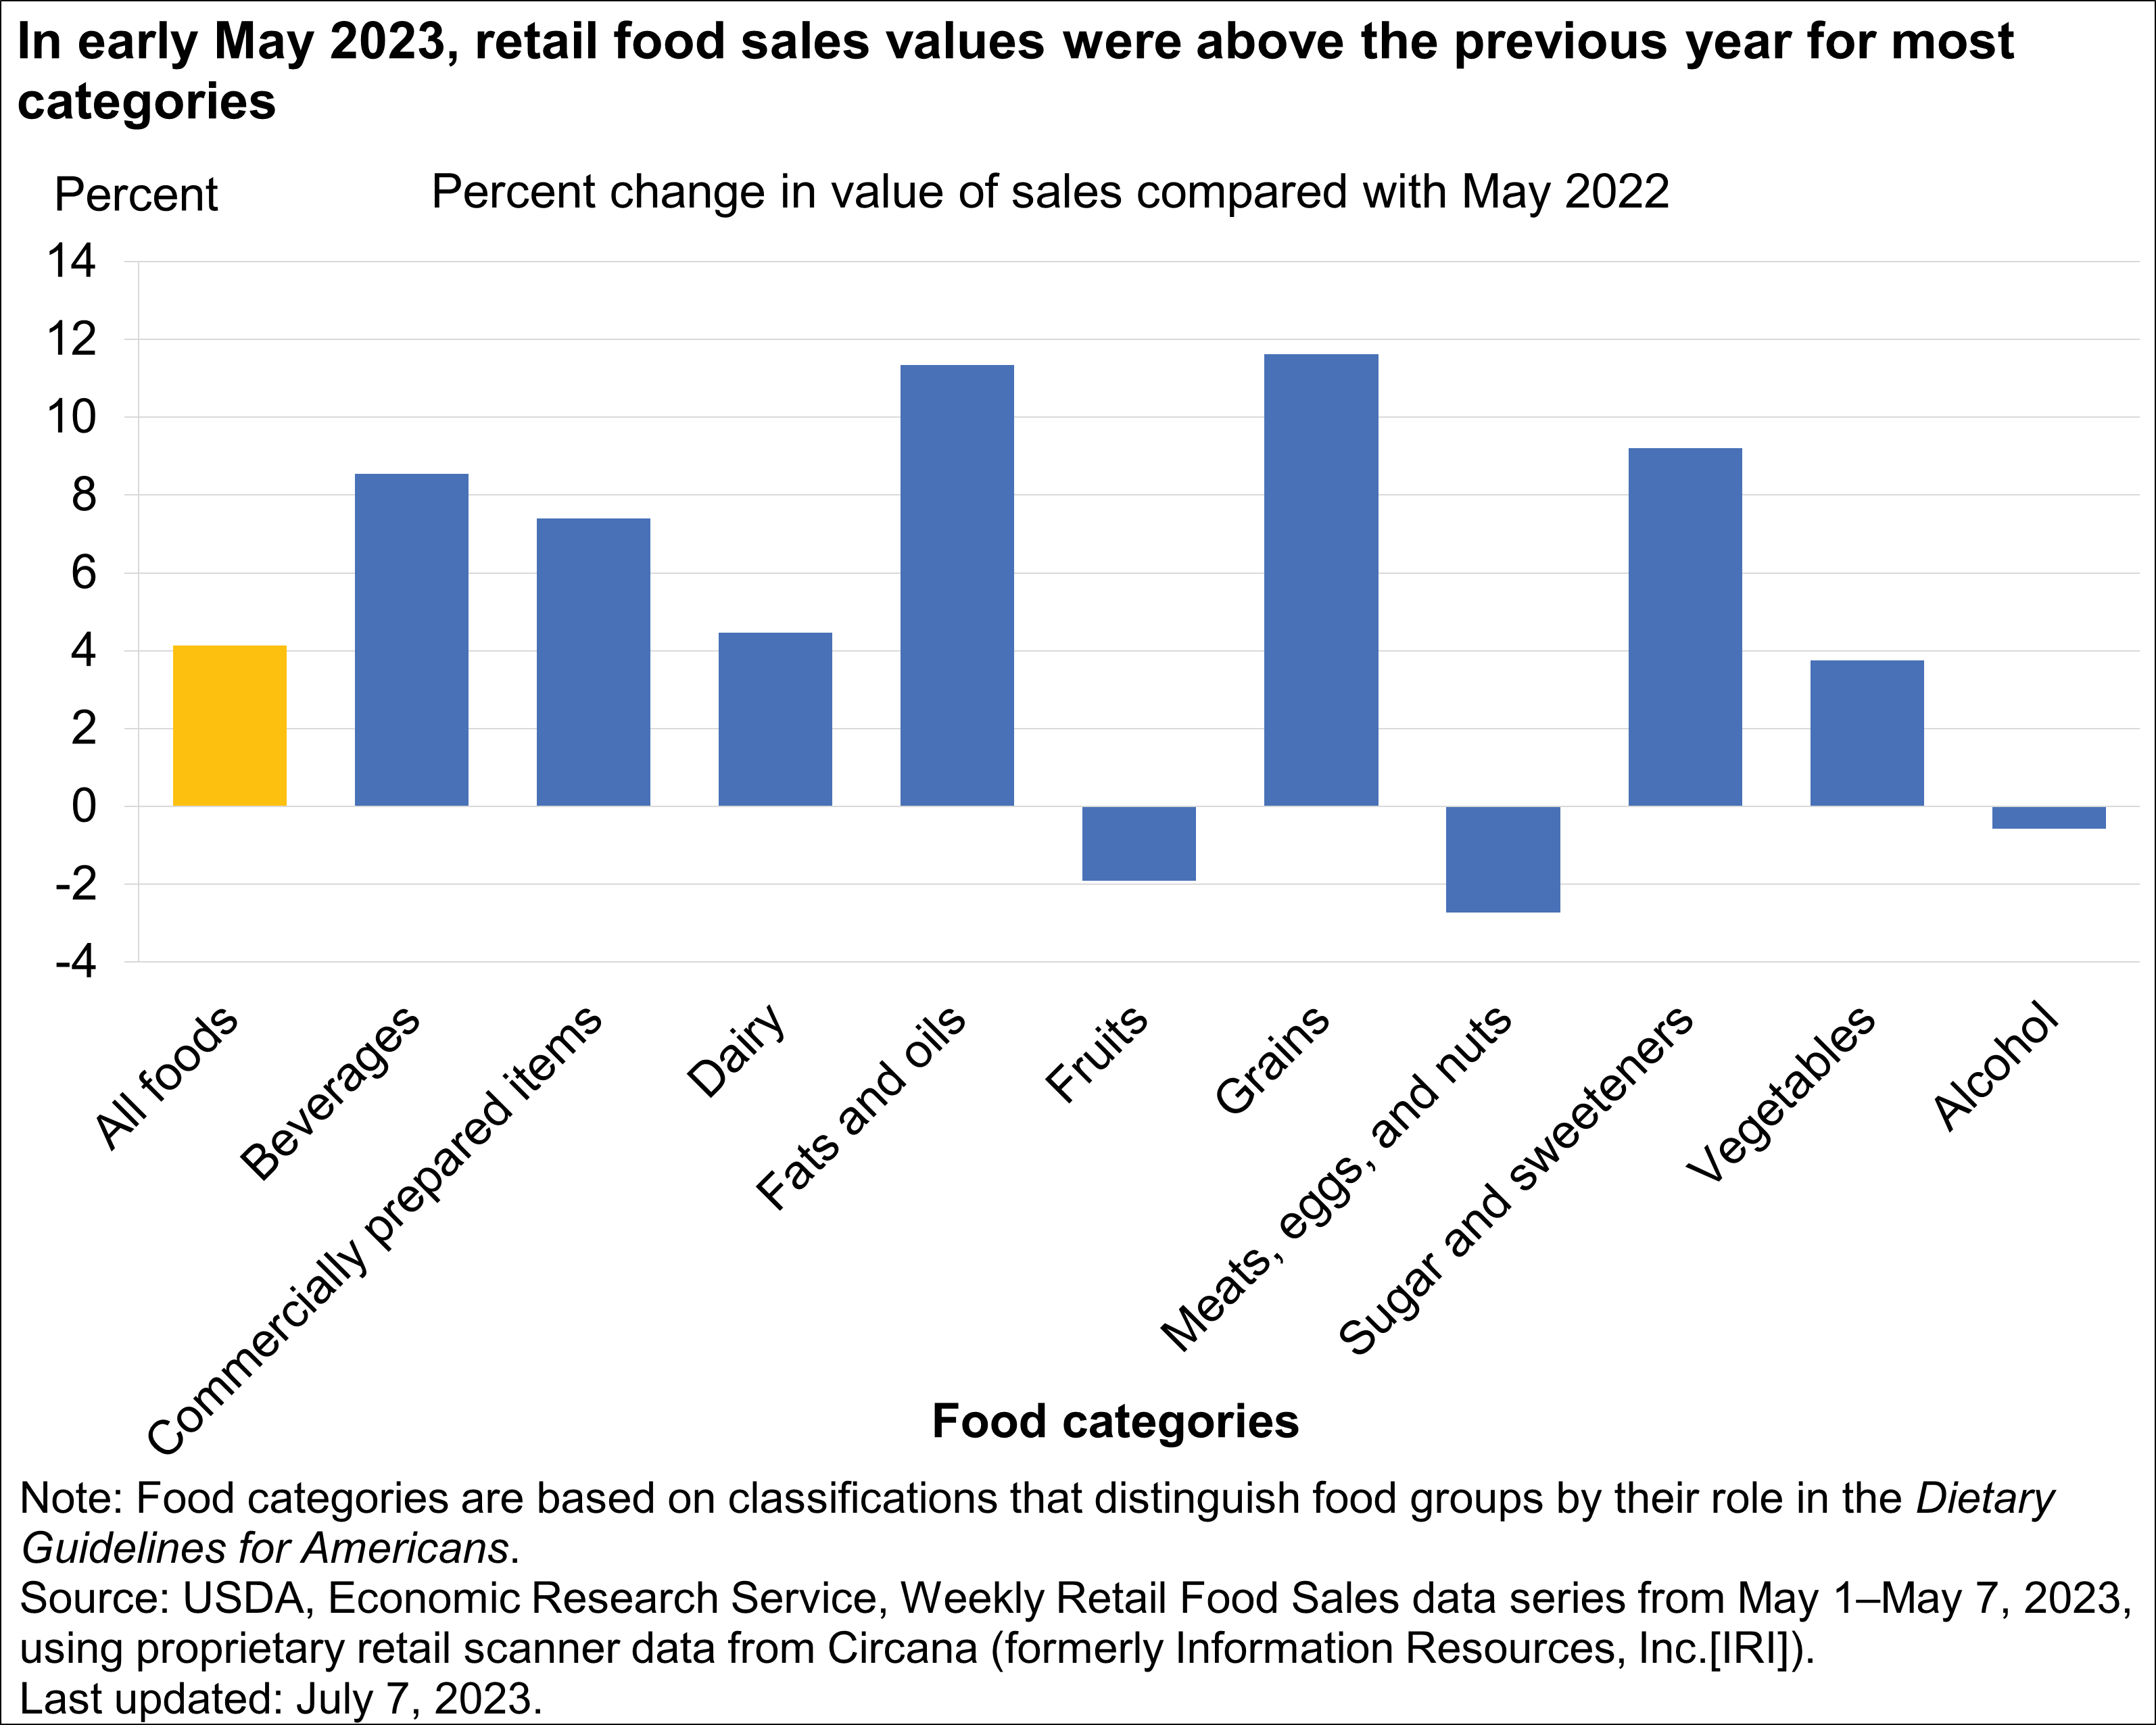
A comparison with the previous year provides insights into changes in sales within the pandemic period. The overall value of retail food sales was higher compared with the same week in 2022, as a whole and in most food categories, with substantial variation among categories.
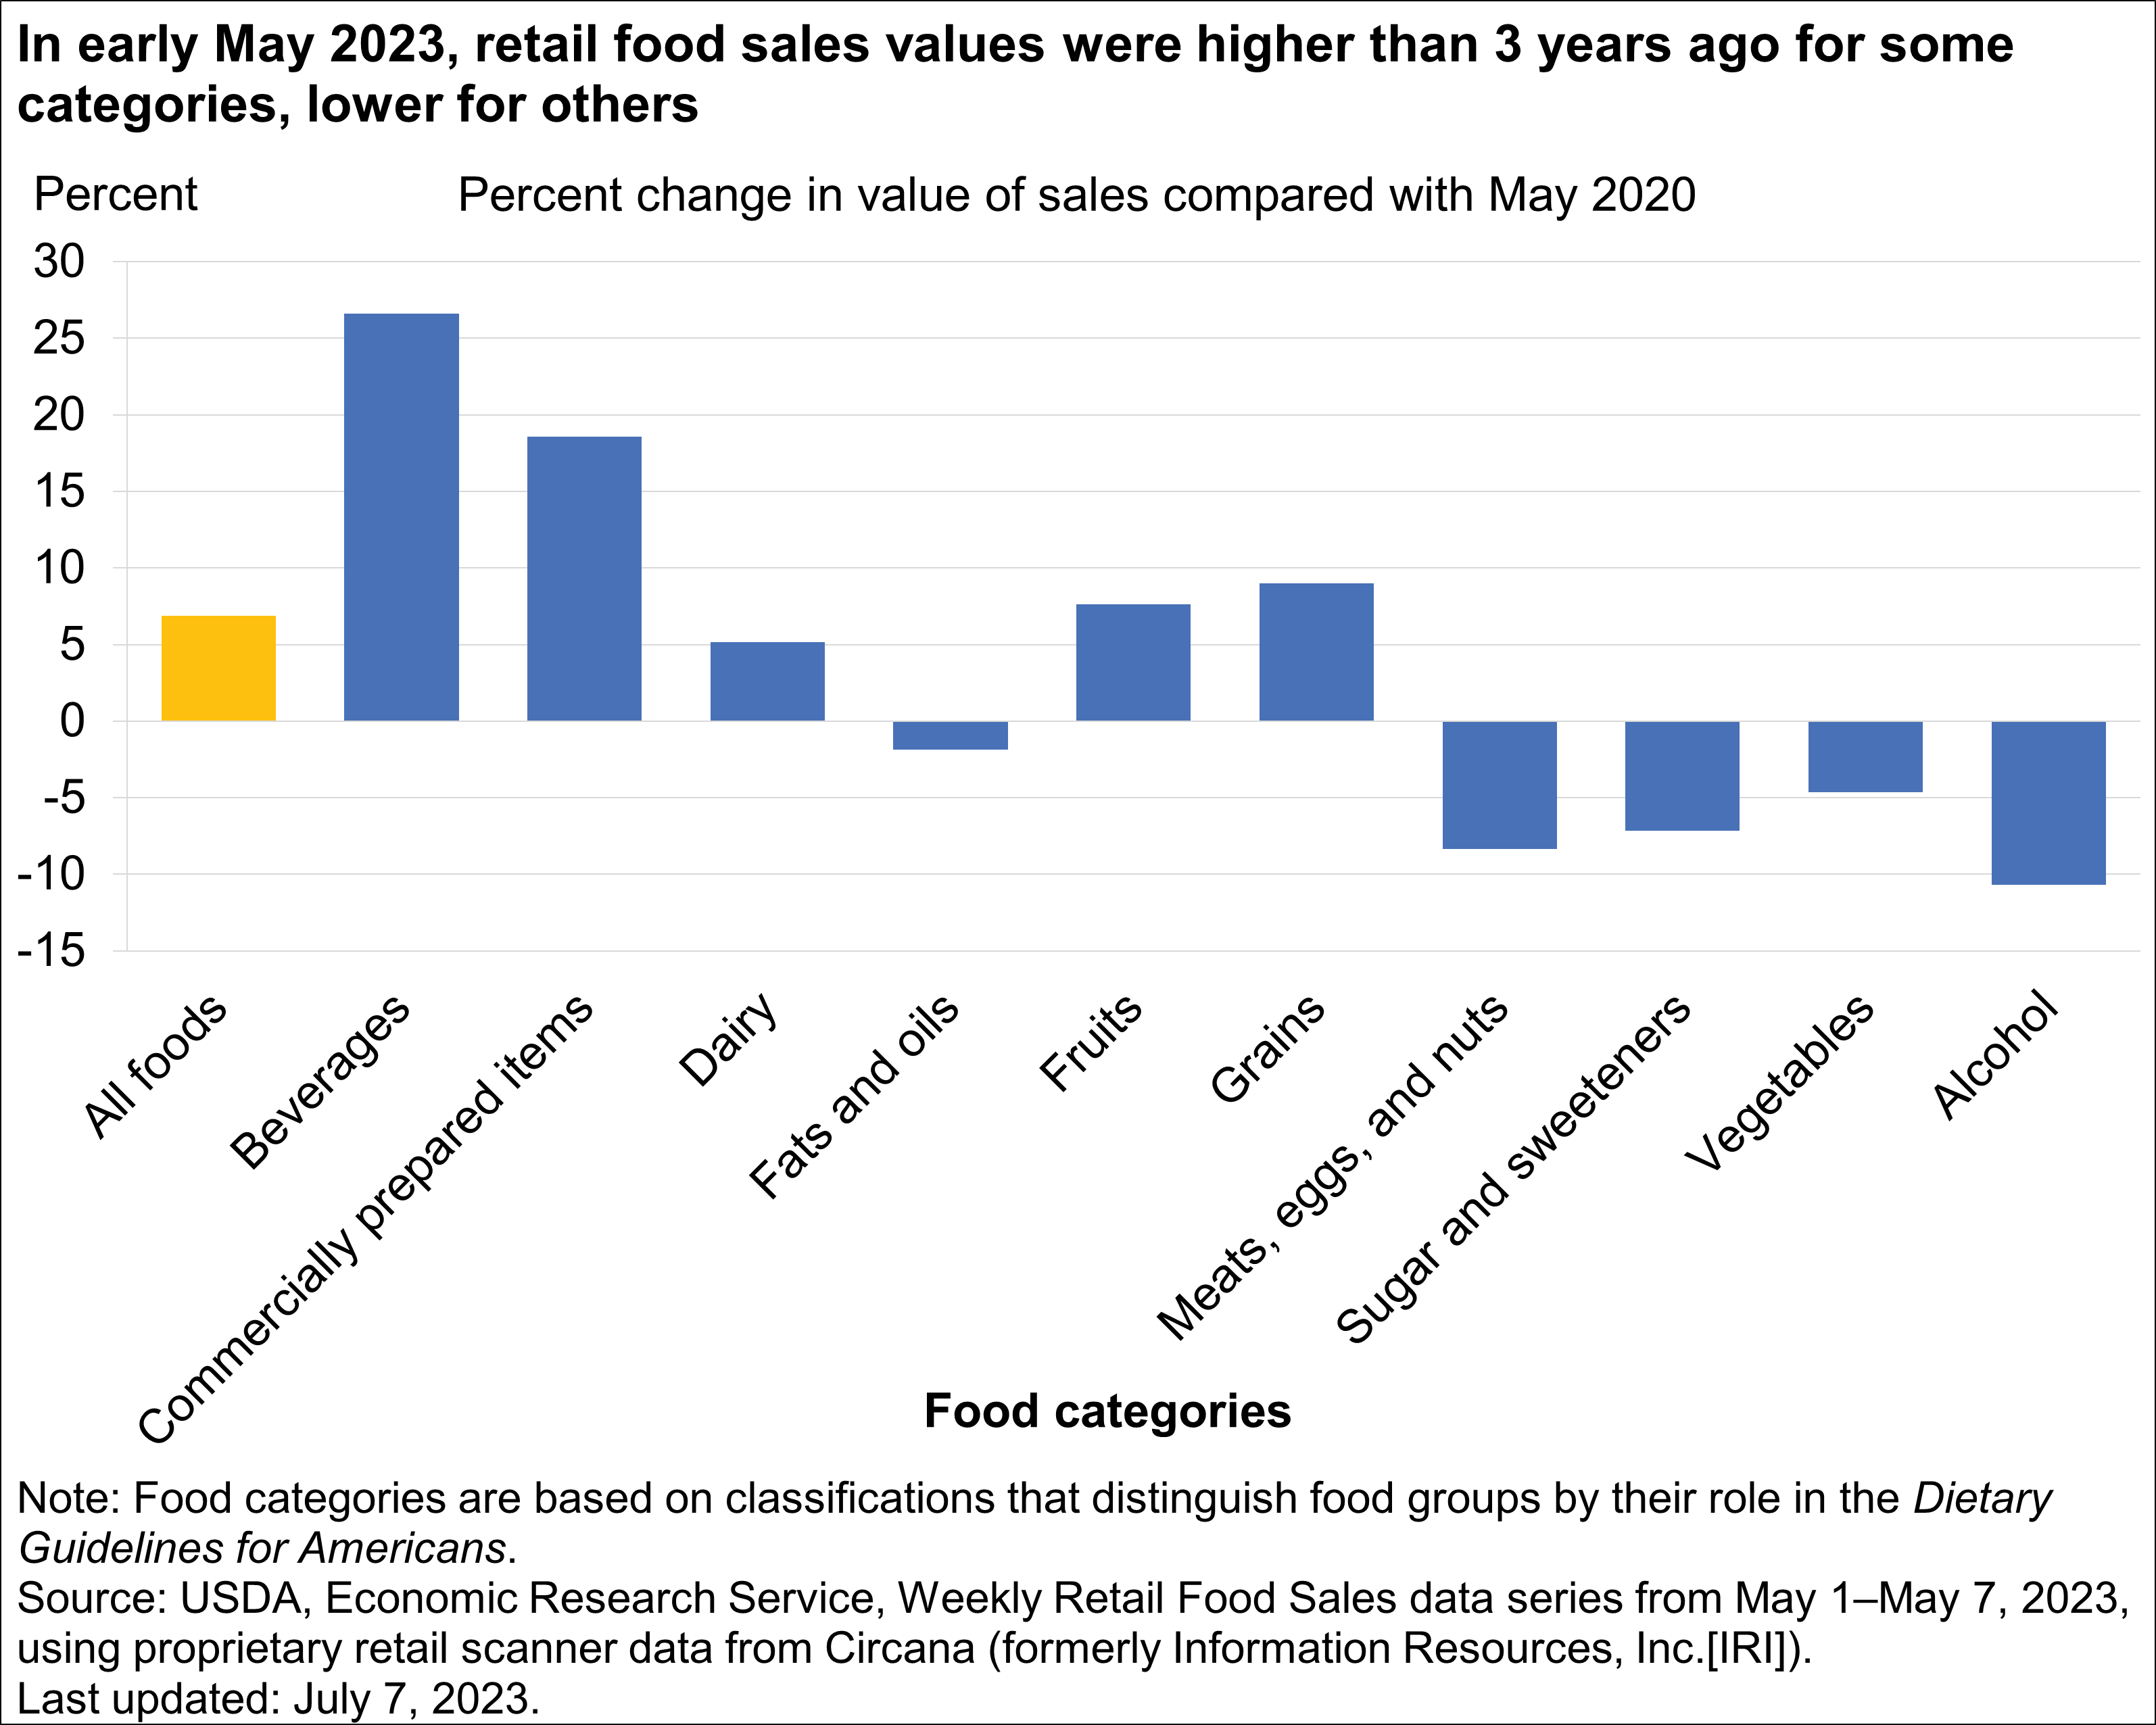
Compared with the same week in 2020, the value of retail food sales during the week ending May 7, 2023, was higher for some categories but lower for others.
Food Prices During the Pandemic
Food price changes early in the Coronavirus (COVID-19) pandemic partly reflected the impact of illnesses and safety measures on labor supply and productivity in the United States. For example, most fresh-market vegetable growers rely on seasonal labor to produce and place crops into supply channels. COVID-19 illnesses reduced the supply of farm workers in producing regions. Also, procedural changes to comply with recommended social distancing and sanitary protocols may have reduced productivity for some processing and packaging facilities.
Since early 2022, food price changes may reflect higher costs for labor and energy—as well as supply-chain challenges, weather impacts, avian influenza, and international trade conditions. For more information, see the Livestock, Dairy, and Poultry Outlook: July 2023 and Wheat Outlook: July 2023.
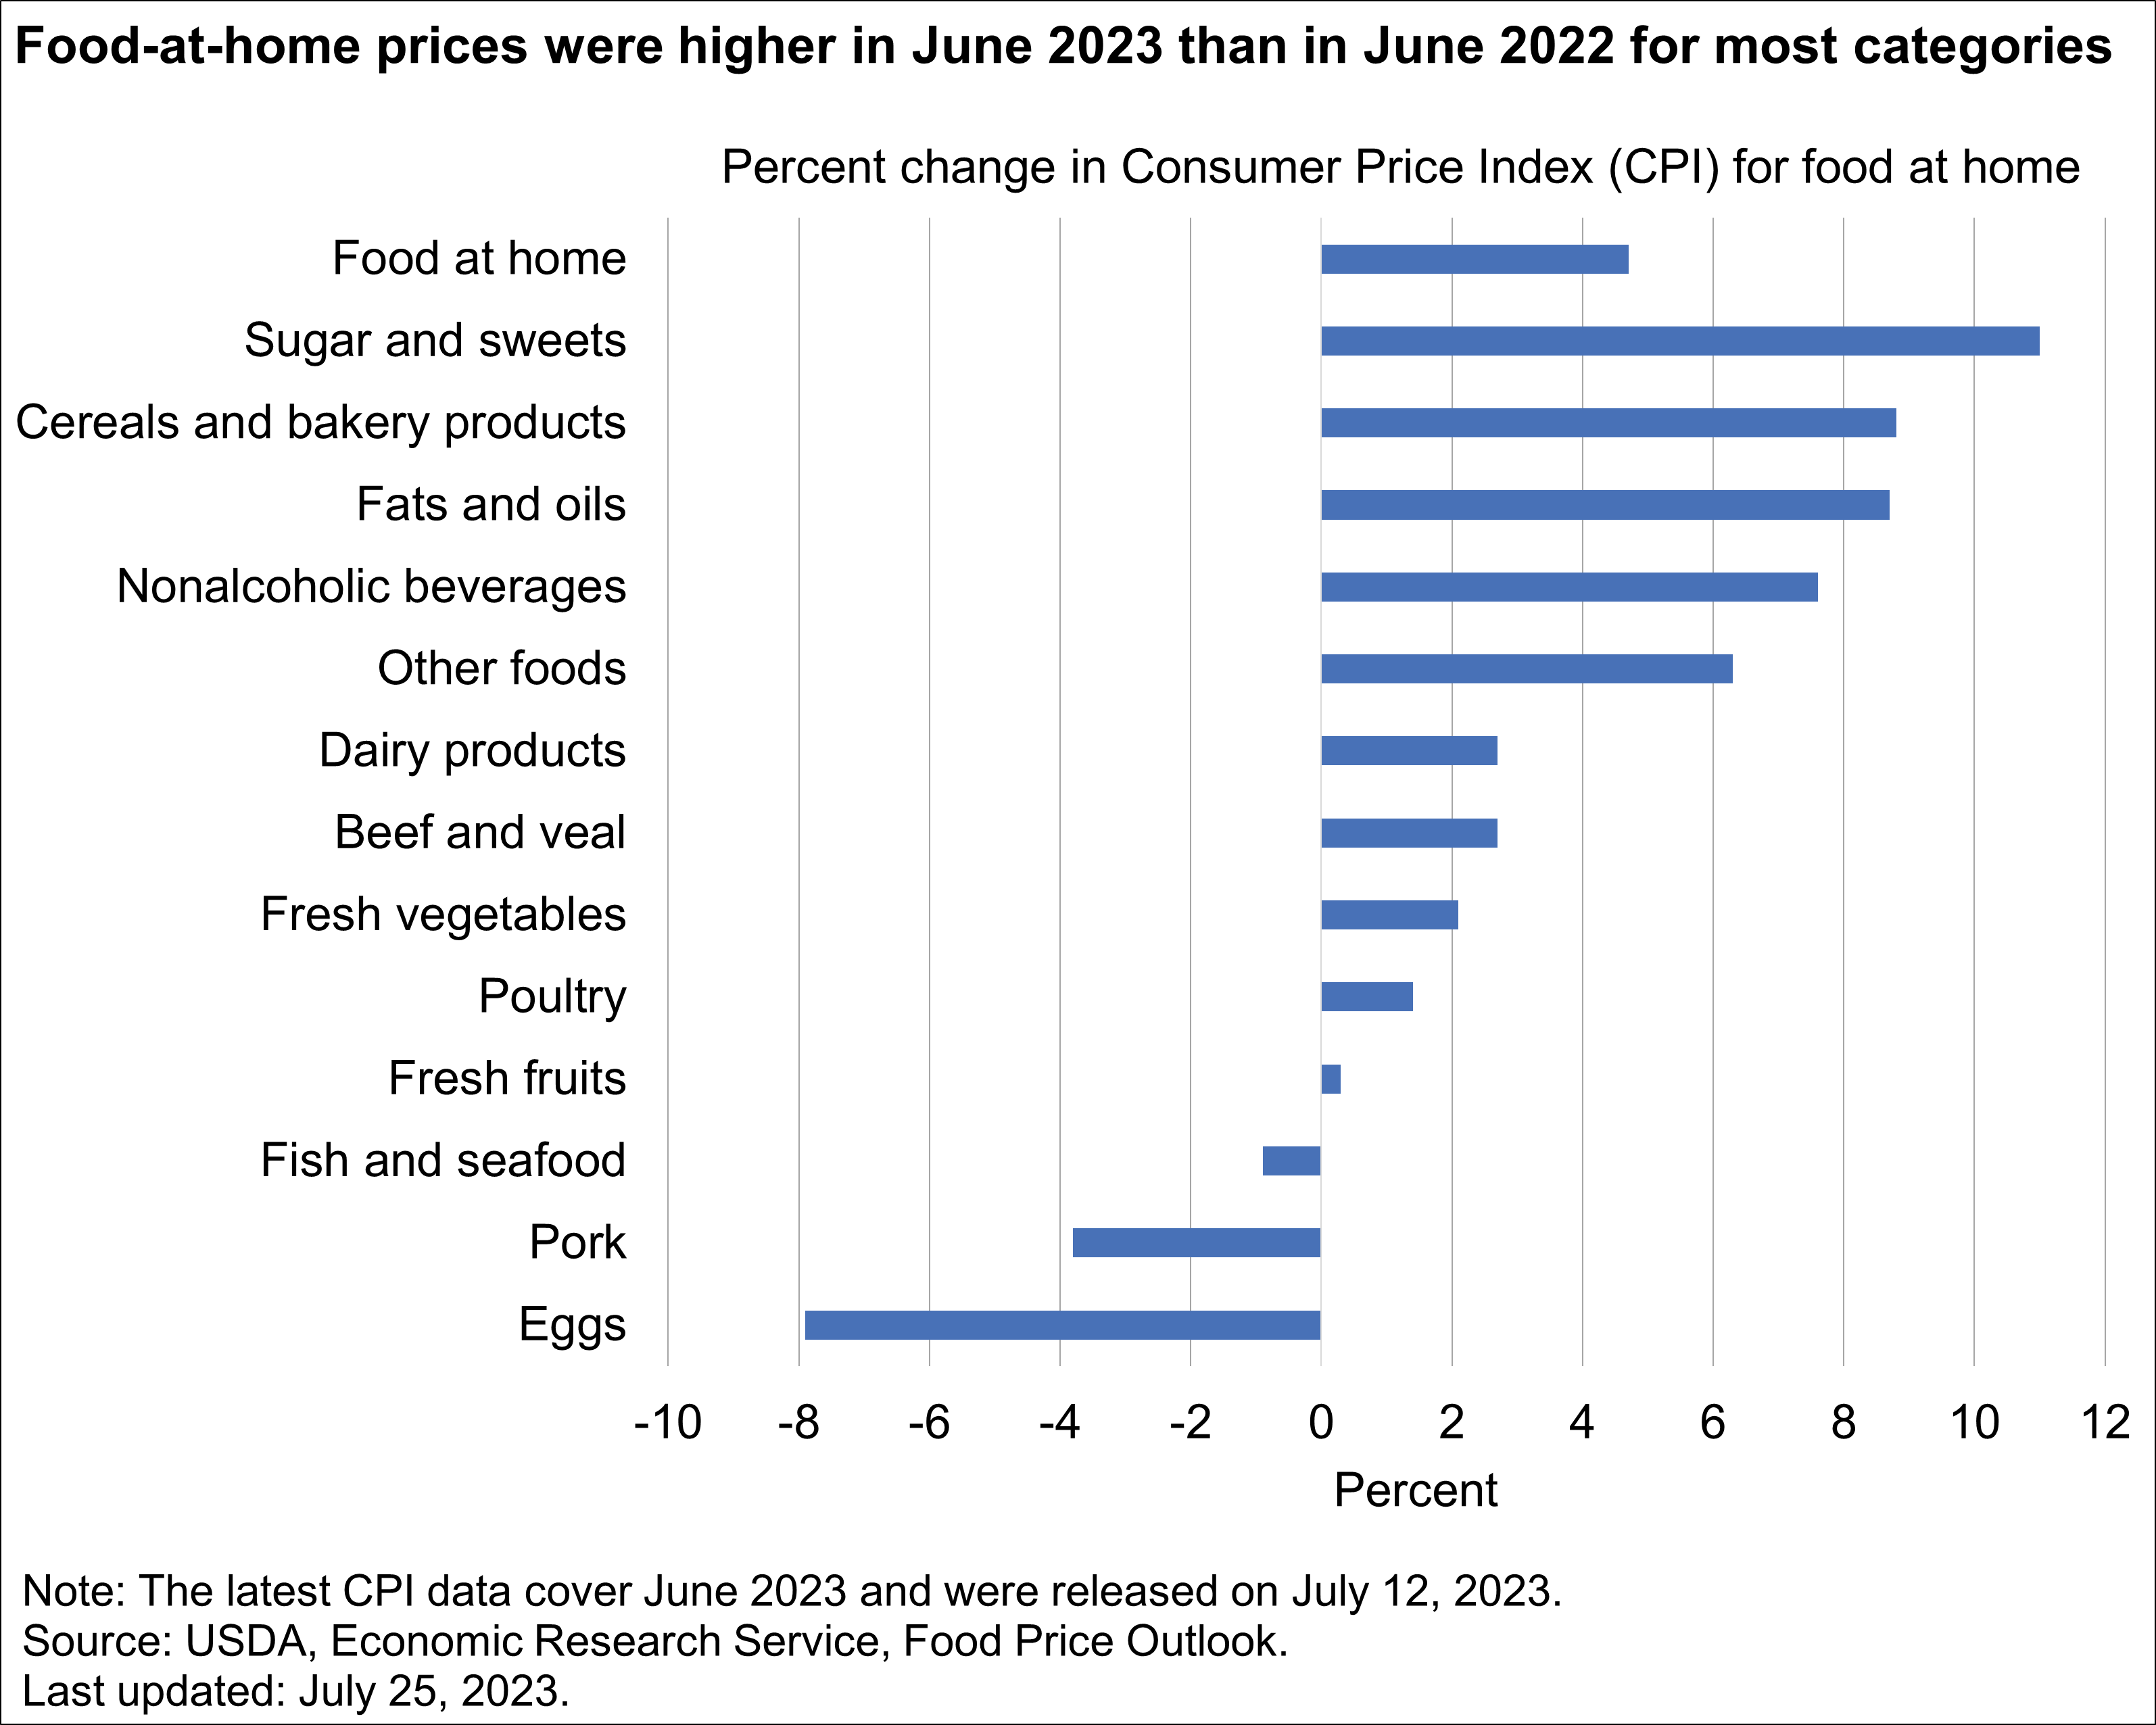
The USDA, ERS Food Price Outlook tracks changes in the Consumer Price Index (CPI) for food at home and food away from home. The CPI for food measures retail price changes of food over time. Retail food prices were higher in June 2023 than June 2022 for most categories, while prices declined for eggs (-7.9 percent), pork (-3.8 percent), fish and seafood (-0.9 percent). The highest price increases were for sugar and sweets (11.0 percent), cereals and bakery products (8.8 percent), and fats and oils (8.7 percent).
Food Sufficiency During the Pandemic: The Household Pulse Survey
To produce timely information on the economic and social effects of COVID-19 on U.S. households, the U.S. Department of Commerce, Bureau of the Census worked with USDA, Economic Research Service and other Federal agencies to develop the Household Pulse Survey (HPS). HPS is an online survey asking respondents about educational, employment, health, housing, and food-related outcomes. Data were collected for Phase 1 of HPS during April 23–July 21, 2020; Phase 2 during August 19–October 26, 2020; Phase 3.0 during October 28, 2020–March 29, 2021; Phase 3.1 during April 14–July 5, 2021; Phase 3.2 during July 21–October 11, 2021; Phase 3.3 during December 1, 2021–February 7, 2022; Phase 3.4 during March 2–May 9, 2022; Phase 3.5 during June 1–August 8, 2022; Phase 3.6 during September 14–November 14, 2022; Phase 3.7 during December 9, 2022–February 13, 2023; and Phase 3.8 during March 1– May 8, 2023. Phase 3.9 began June 7, 2023 and will continue through August 7, 2023. HPS includes an indicator of food sufficiency for U.S. households, as well as an indicator of child food sufficiency.
- Food insufficiency means a household did not have enough food to eat sometimes or often in the last 7 days.
- Low food sufficiency means a household did not have enough food to eat sometimes in the last 7 days.
- Very low food sufficiency means a household did not have enough food to eat often in the last 7 days.
For more information about the difference between food insufficiency and food insecurity, see Food Security in the United States Measurement.
Measuring Food Insufficiency
The food sufficiency item in HPS asks about food eaten in the household in the last 7 days to assess rapid changes in food sufficiency.
Household adults are asked the following:
In the last 7 days, which of these statements best describes the food eaten in your household? Select only one answer.
- Enough of the kinds of food (I/we) wanted to eat
- Enough, but not always the kinds of food (I/we) wanted to eat
- Sometimes not enough to eat
- Often not enough to eat
Adults who select (1) are classified as living in households with full food sufficiency; those who select (2) are classified as living in households with marginal food sufficiency. Those who select (3) or (4) are counted as having low and very low food sufficiency, respectively. Those who respond with (3) or (4) are classified as food insufficient, meaning a household did not have enough to eat in the last 7 days.
Prevalence of Food Insufficiency
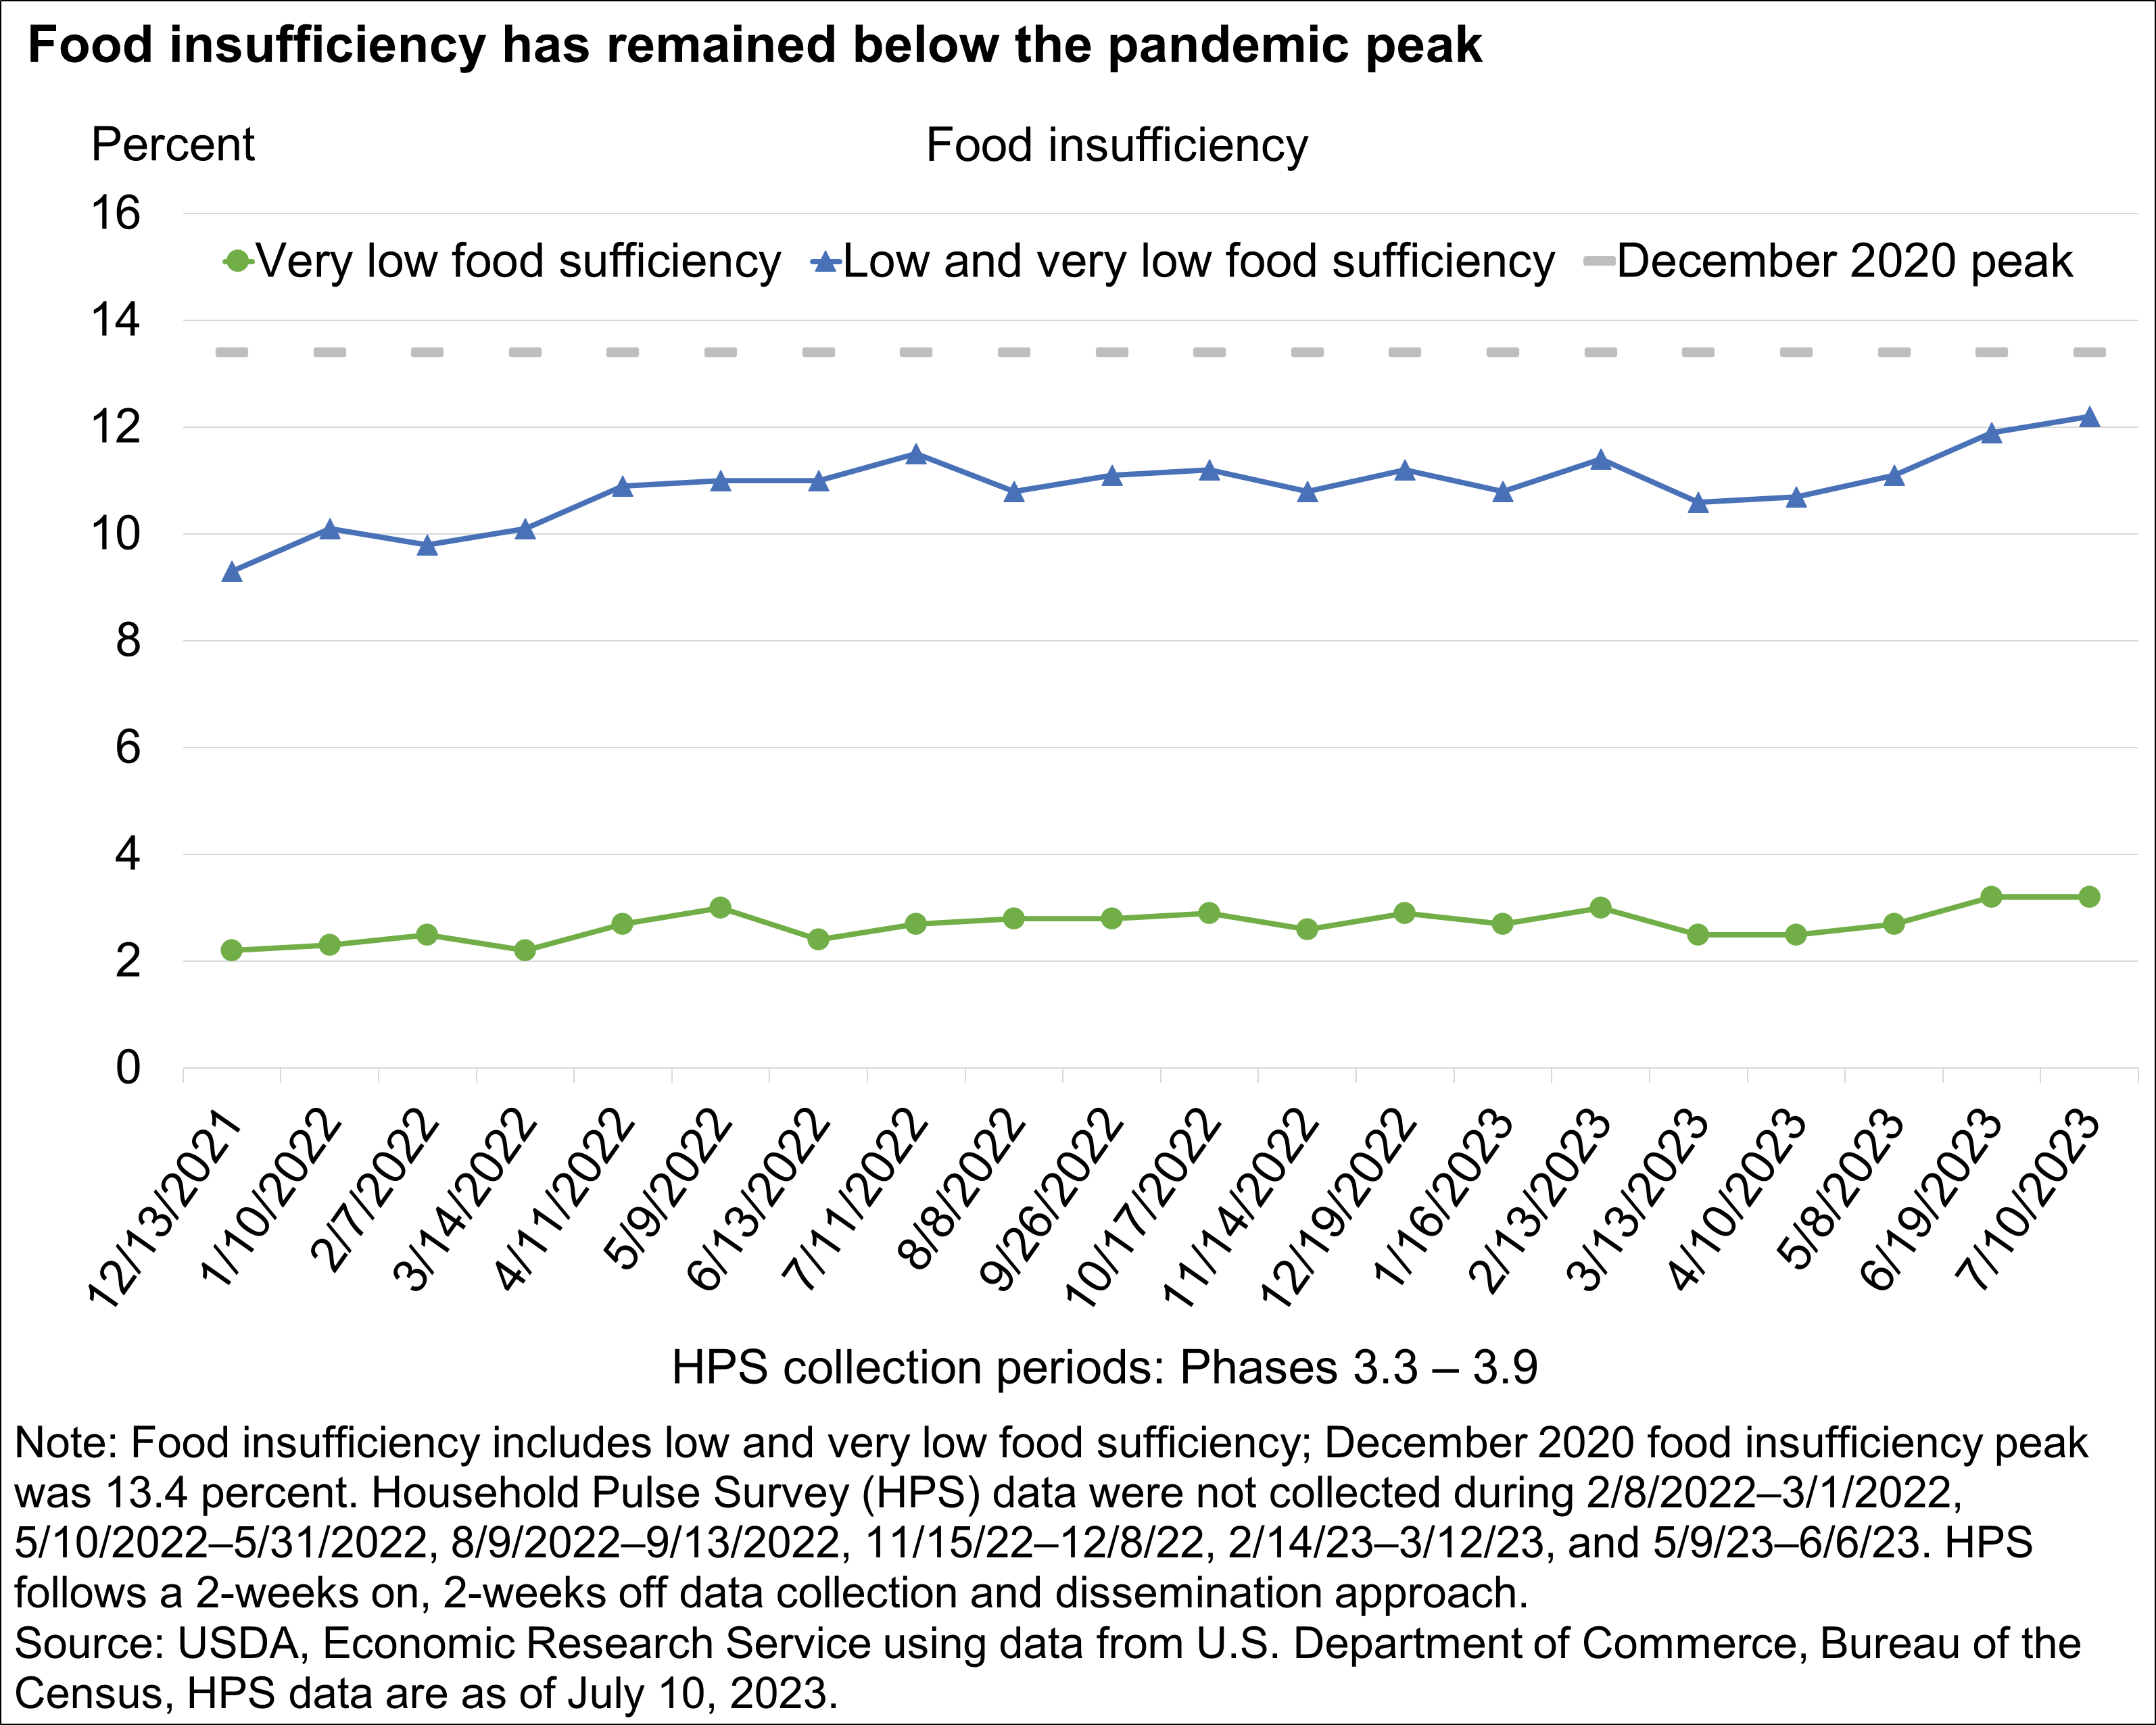
The prevalence of food insufficiency—low and very low food sufficiency—peaked at 13.4 percent in December 2020, shown in the graphic below as the dotted grey reference line. As of July 10, 2023, the prevalence of food insufficiency was estimated at 12.2 percent and the prevalence of very low food security was 3.2 percent.
Data from HPS and other sources are not entirely comparable. For more information, see the Household Pulse Survey Technical Documentation from the U.S. Department of Commerce, Bureau of the Census. There is no directly comparable measure of food insufficiency prior to the Coronavirus (COVID-19) pandemic. USDA, ERS monitors the annual prevalence of food insecurity in U.S. households with data from the Current Population Survey Food Security Supplement. These data also include the food sufficiency question, but with a 12-month reference period. The December 2021 Current Population Survey Food Security Supplement reported that 3.3 percent of U.S. households described their household’s food situation over the previous 12 months as "sometimes or often not having enough to eat" (food insufficiency), with 0.7 percent reporting "often not having enough to eat" (very low food sufficiency).
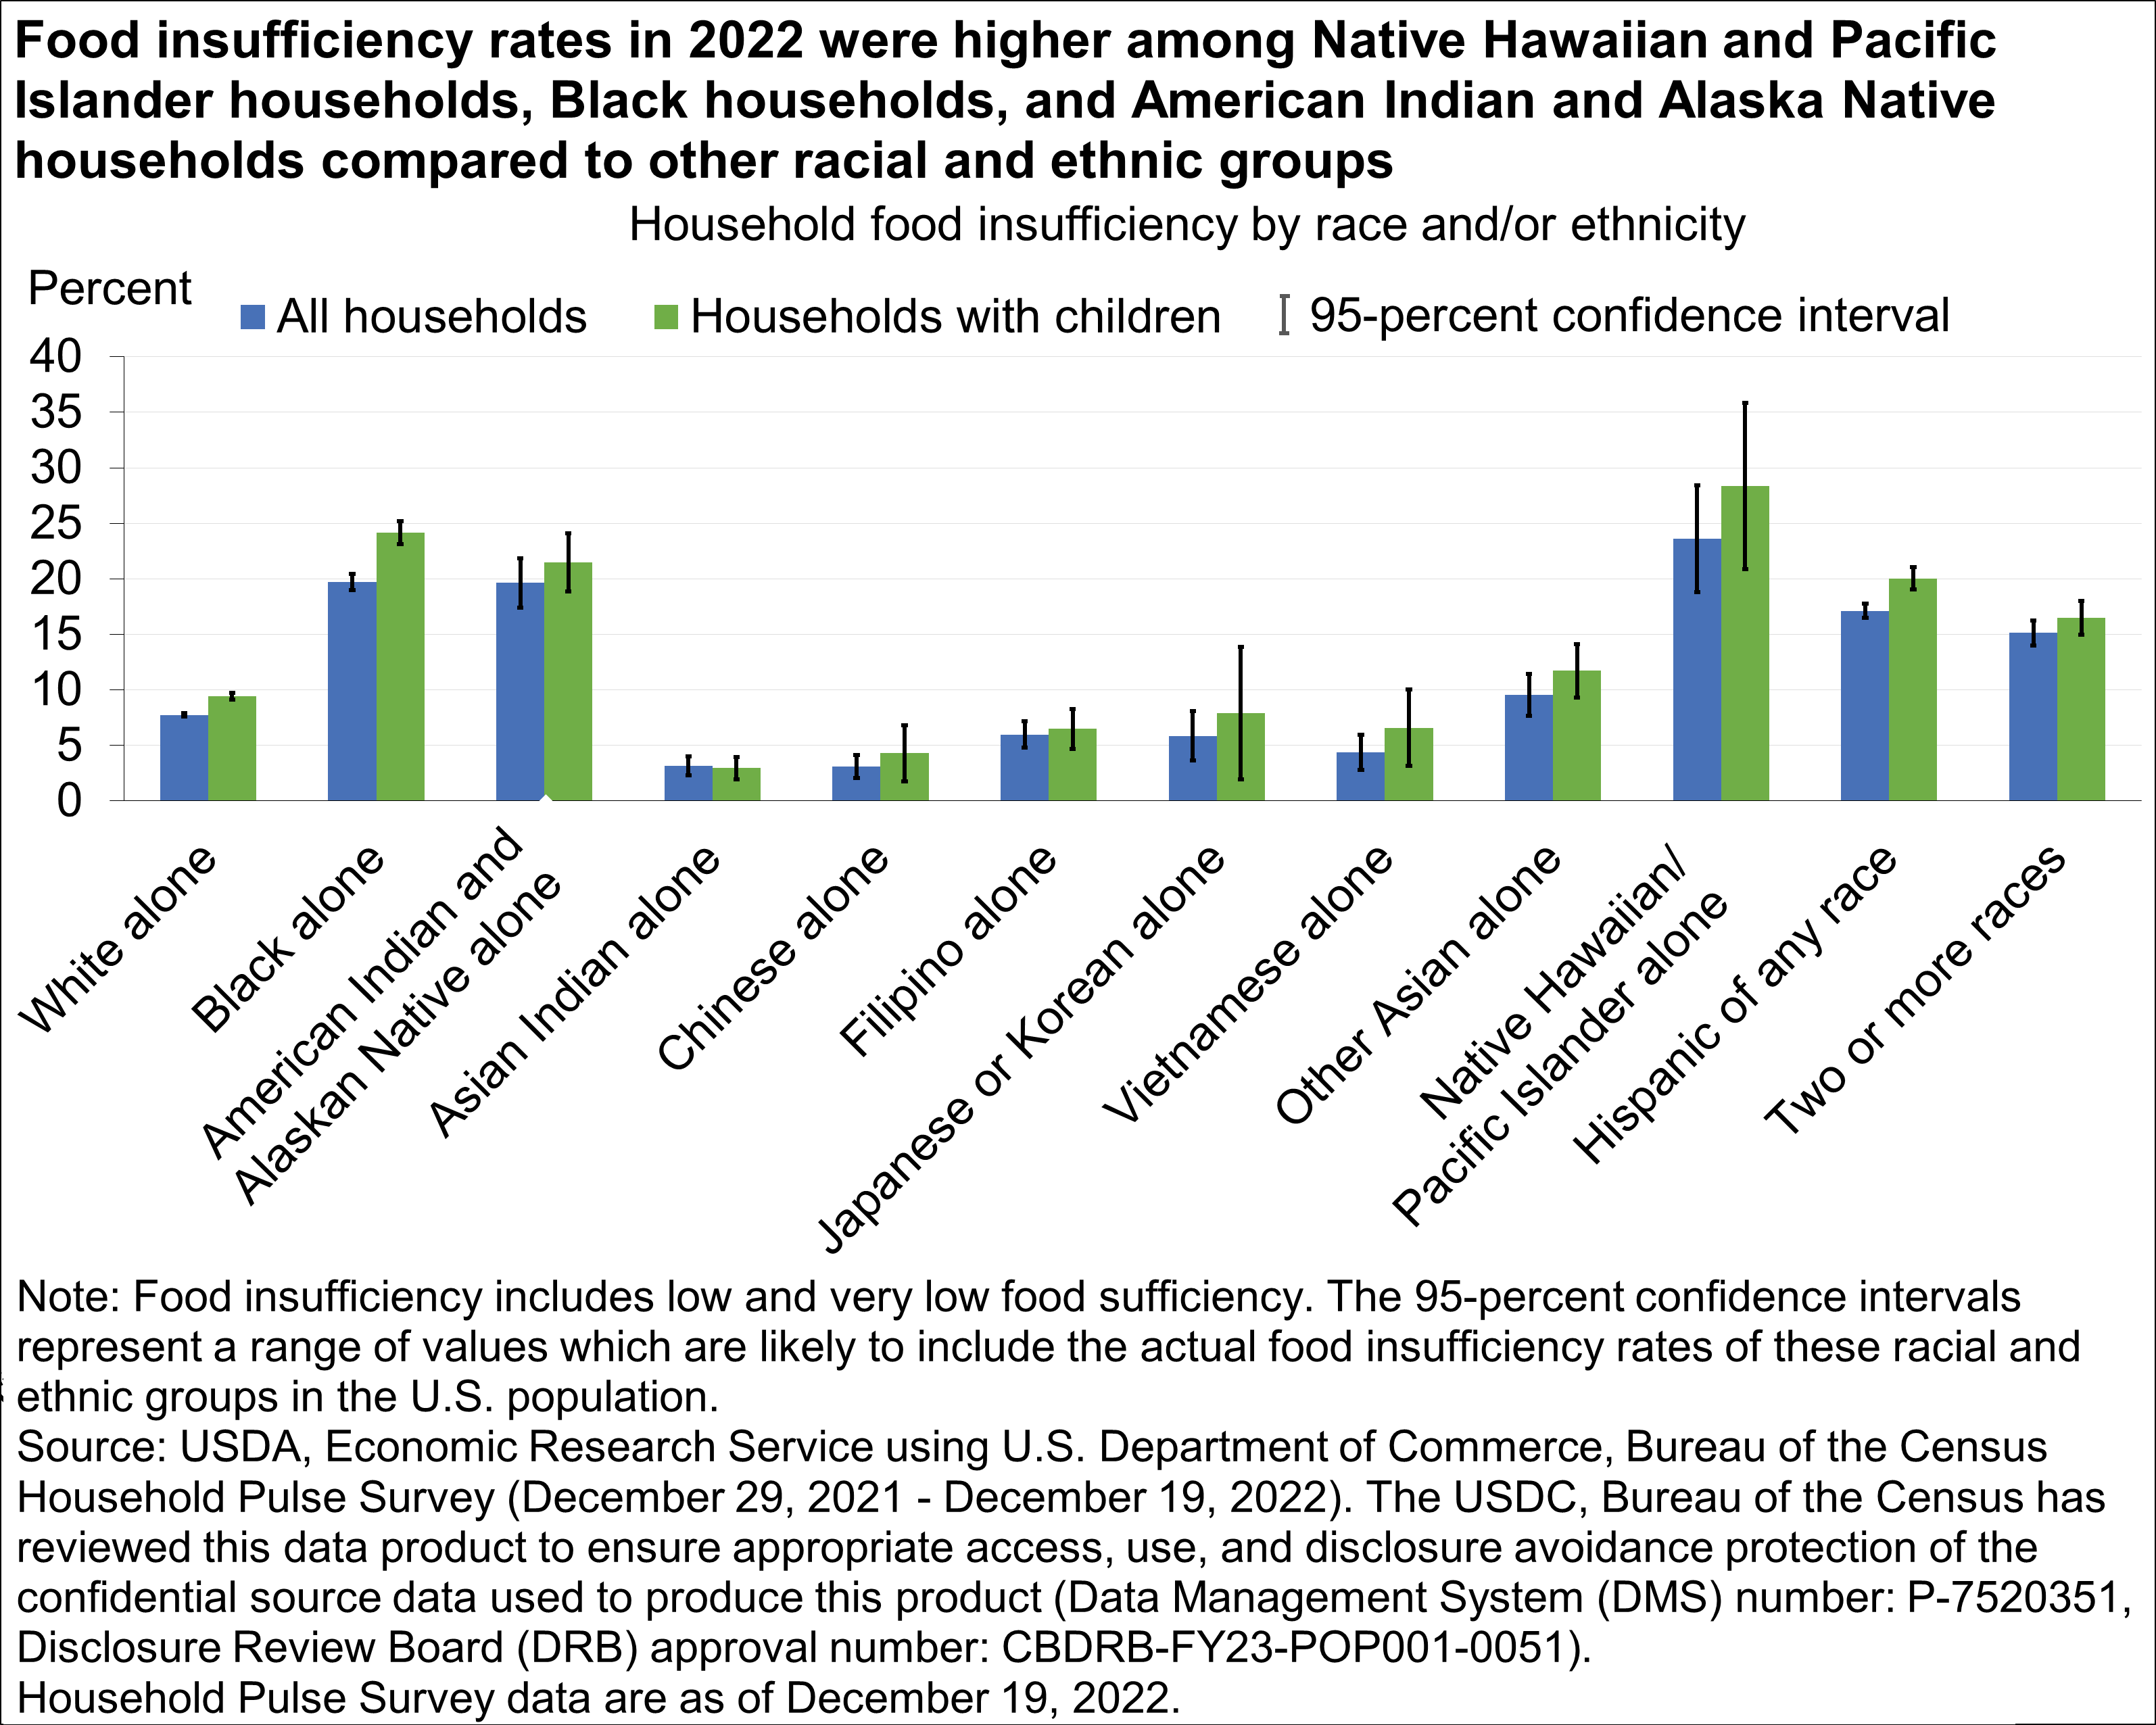
Very low and low food sufficiency during the COVID-19 pandemic affected certain groups of the U.S. population more than others. From December 29, 2021–December 19, 2022, Native Hawaiian and Pacific Islander households (23.6 percent), Black households (19.7 percent), and American Indian and Alaska Native households (19.6 percent) had the highest rates of food insufficiency. Hispanic households (17.1 percent) also experienced high rates of food insufficiency during this period. Eastern Asian households (including Chinese, Filipino, Vietnamese, and Japanese or Korean households) had lower rates of food insufficiency than other racial and ethnic groups—including White households. For most groups, food insufficiency was higher for households with children.
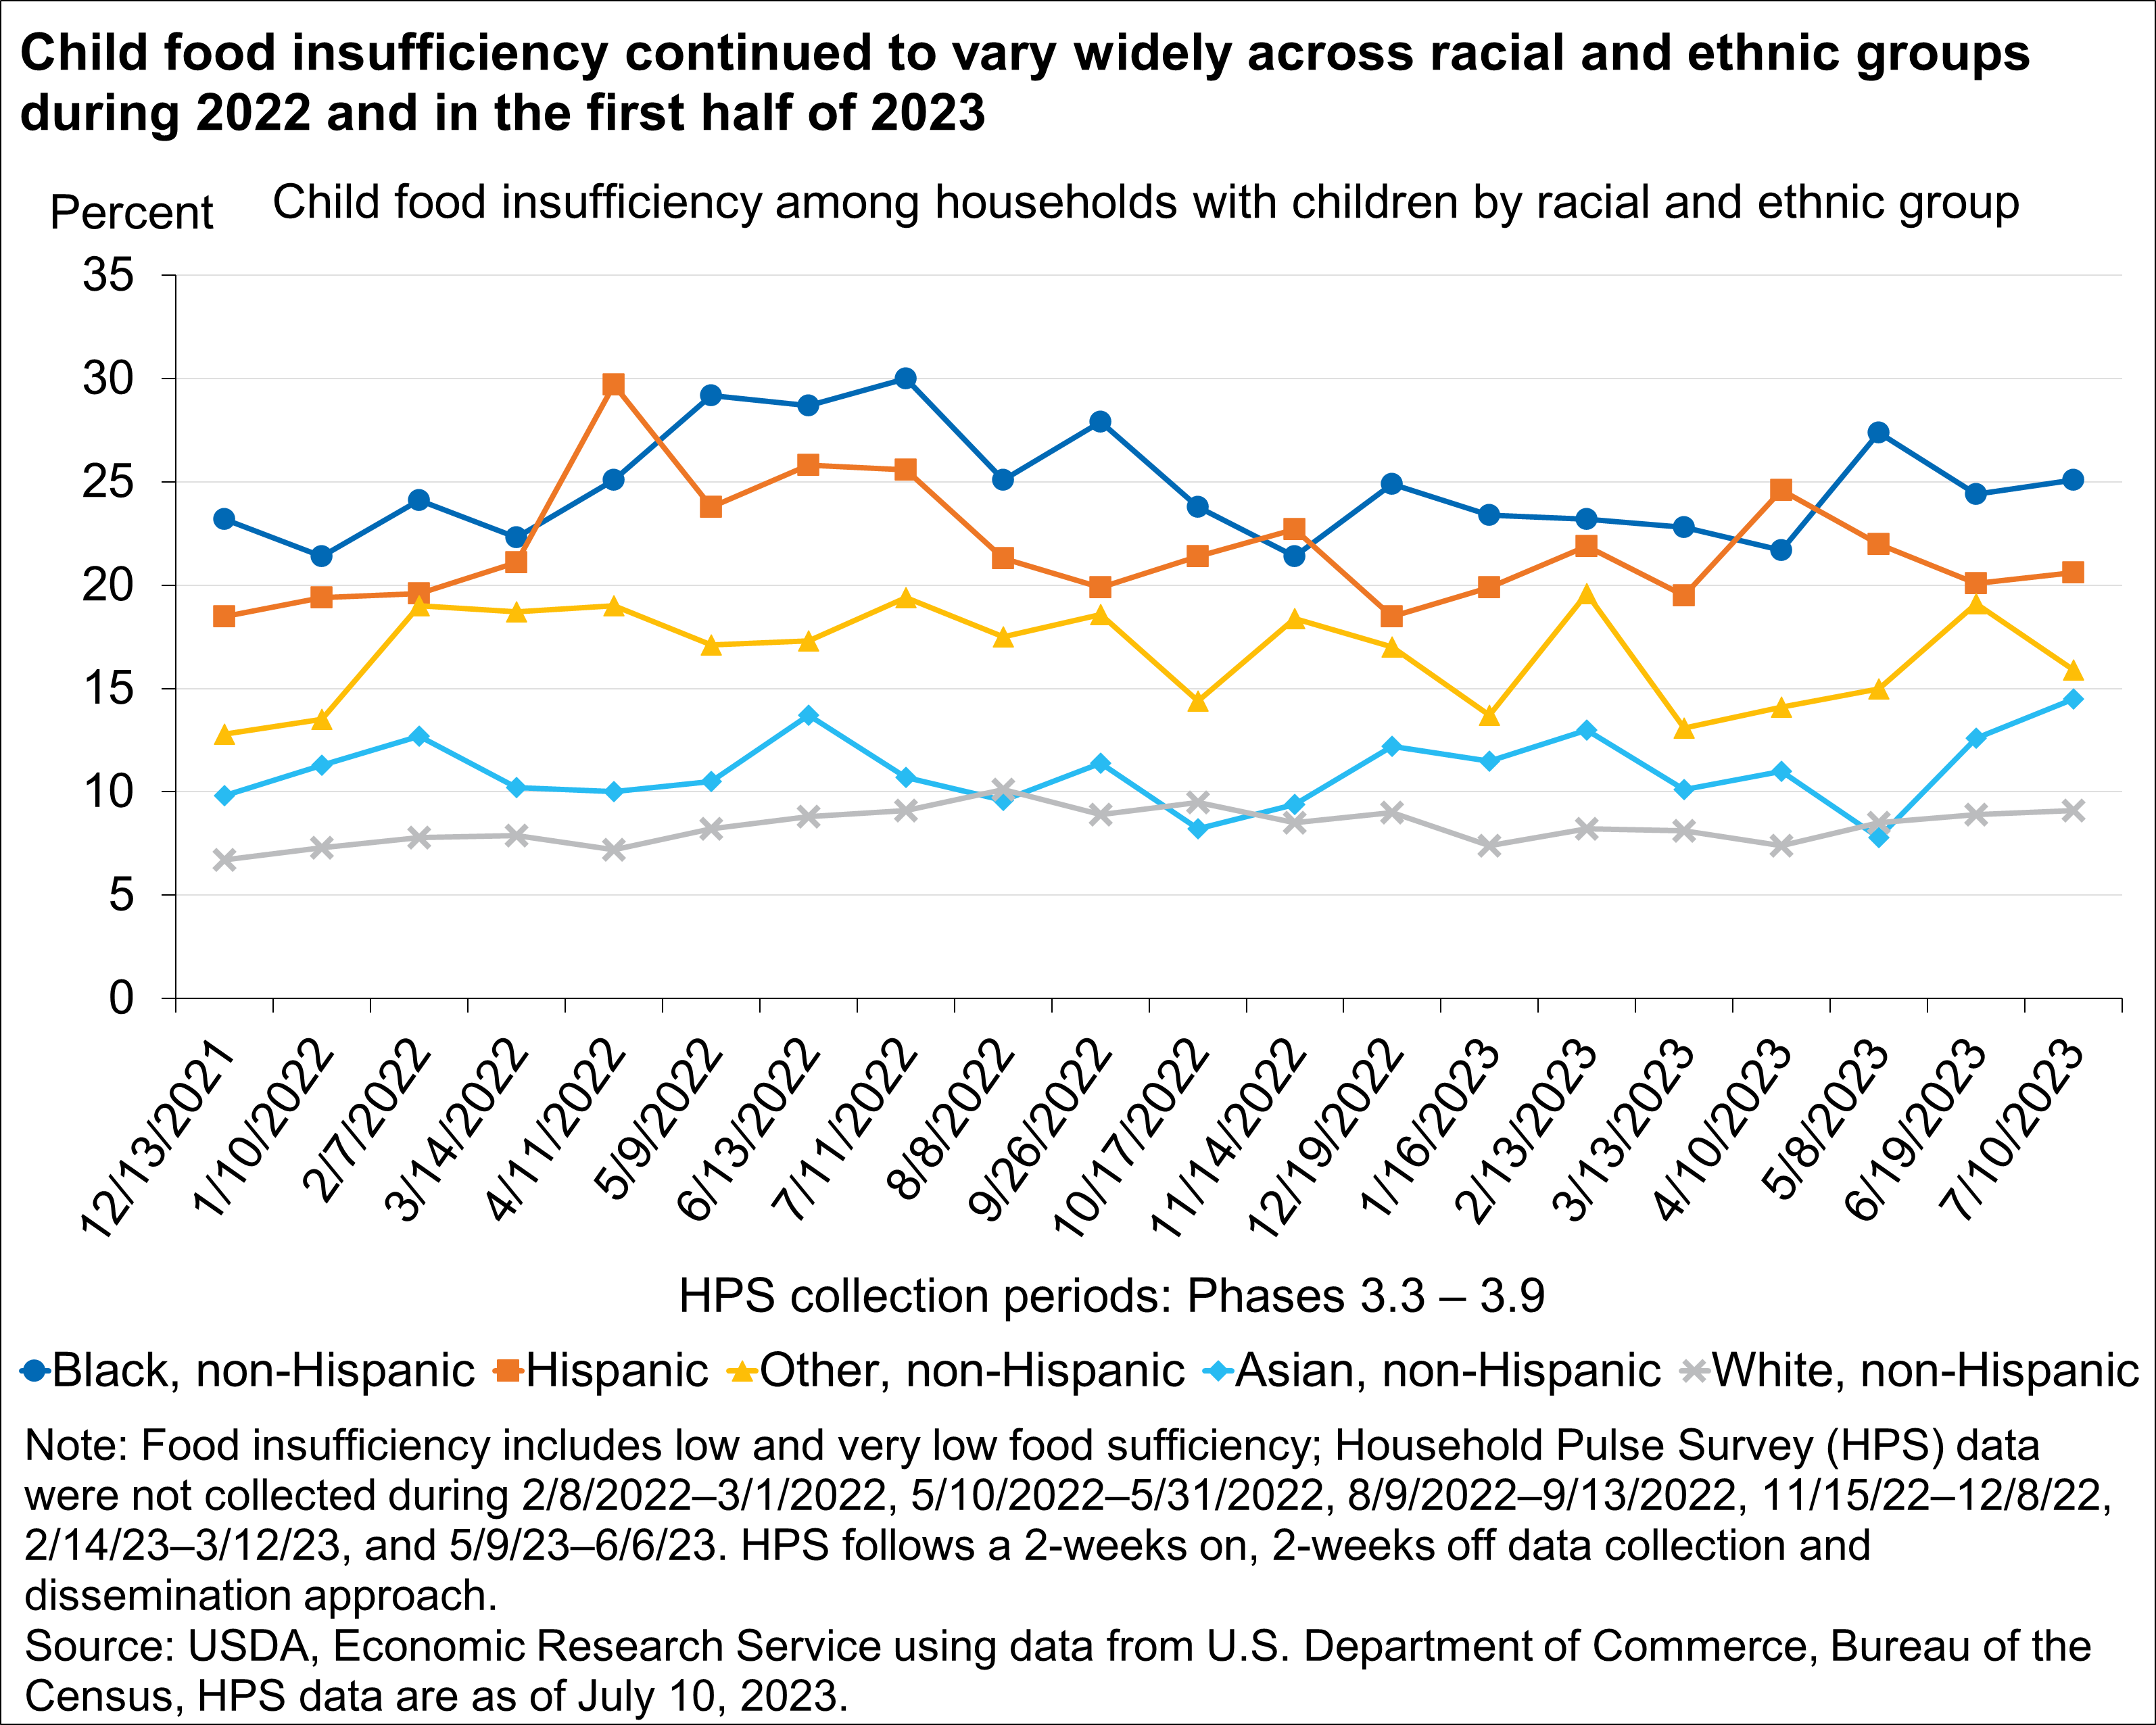
Disparities across racial and ethnic groups are also seen in child food insufficiency. As of July 10, 2023, 25.1 percent of Black, non-Hispanic households, 20.6 percent of Hispanic households, and 15.9 percent of Other, non-Hispanic households reported their children sometimes or often did not have enough to eat during the past week—compared with 14.5 percent for Asian, non-Hispanic households and 9.1 percent for White, non-Hispanic households.
Additional statistics on household food security in the United States are available: see Key Statistics and Graphics and Interactive Charts and Highlights.
Recent Research
- Cost of School Meals and Households’ Difficulty Paying for Expenses: Evidence From the Household Pulse Survey (EB-37, July 2023)
- ERS Data Products Show Food-At-Home Price Inflation From Producers to Consumers (Amber Waves, July 10, 2023)
- COVID-19 Working Paper: Obesity Prevalence Among U.S. Adult Subpopulations During the First Year of the COVID-19 Pandemic (AP-115, July 2023)
- The Food and Nutrition Assistance Landscape: Fiscal Year 2022 Annual Report (EBB-255, June 2023)
- COVID-19 Working Paper: Food-Away-From-Home Acquisition Trends Throughout the COVID-19 Pandemic (AP-113, May 2023)
- New Analysis Approach Illuminates Differences in Food Spending Across U.S. Populations (Amber Waves, May 31, 2023)
- Amber Waves: 2022 Year in Review (AP-112, February 2023)
- Selected Charts from Ag and Food Statistics: Charting the Essentials, February 2023 (AP-111, February 2023)
- COVID-19 Working Paper: National Trends in Food Retail Sales During the COVID-19 Pandemic: Findings from Information Resources, Inc. (IRI) Retail-Based Scanner Data (AP-108, December 2022)
- Food Insecurity Decreased for U.S. Households With Children in 2021, but Increased for Households Without Children (Amber Waves, November 2022)
- People Working From Home During the Pandemic Spent Less Time Eating Away From Home (Amber Waves, October 2022)
- Higher Retail Meat Prices Reduced Household Economic Well-Being During the COVID-19 Pandemic (Amber Waves, October 2022)
- Household Food Security in the United States in 2021 (ERR-309, September 2022)
- Pandemic-Related Program Changes Continued to Shape the U.S. Food and Nutrition Assistance Landscape in Fiscal Year 2021 (Amber Waves, September 2022)
- Supplemental Nutrition Assistance Program Online Purchasing Expanded in First Two Years of Pandemic (Amber Waves, September 2022)
- Adult Obesity Prevalence Increased During the First Year of the COVID-19 Pandemic (Amber Waves, July 2022)
- The Food and Nutrition Assistance Landscape: Fiscal Year 2021 Annual Report (EIB-237, June 2022)
- Quantifying Consumer Welfare Impacts of Higher Meat Prices During the COVID-19 Pandemic (ERR-306, April 2022)
- Spending Gap Between Full-Service and Quick-Service Restaurants Widened During Coronavirus (COVID-19) Pandemic (Amber Waves, April 2022)
- COVID-19 Working Paper: The Impact of COVID-19 Pandemic on Food-Away-From-Home Spending (AP-100, March 2022)
- Higher Aggregate Incomes Buoyed U.S. Food Spending During the Coronavirus (COVID-19) Recession (Amber Waves, March 2022)
- Food Insecurity for Households With Children Rose in 2020, Disrupting Decade-long Decline (Amber Waves, February 2022)
- Free Meal Sites Expanded Rapidly To Provide Meals to Children During the Early Months of the Pandemic (Amber Waves, November 2021)
- Household Food Security in the United States in 2020 (ERR-298, September 2021)
- The Food and Nutrition Assistance Landscape: Fiscal Year 2020 Annual Report (EIB-227, August 2021)
- Online Supplemental Nutrition Assistance Program (SNAP) Purchasing Grew Substantially in 2020 (Amber Waves, July 2021)
- Updated Food Access Research Atlas Now Maps Changes in Low-Income and Low-Supermarket Access Areas in 2019 (Amber Waves, June 2021)
- For the Second Time in 25 Years, Annual U.S. Food Spending Declined in 2020 (Amber Waves, May 2021)
- Retail Food Price Inflation in 2020 Outpaced Historical Average by 75 Percent (Amber Waves, March 2021)
- Working From Home Leads to More Time Spent Preparing Food, Eating at Home (Amber Waves, February 2021)
Data Resources
- Food Expenditure Series
- Food Price Outlook
- Food Security in the United States
- Weekly Retail Food Sales
Related Topics
- Food Security in the U.S.
- Food Access
- Food Consumption and Demand
- Consumer and Producer Price Indexes