


Illuminating the Issues: How ERS Research Informs Decisions
The Economic Research Service (ERS) shapes its research program and products to assist those who routinely make or influence public policy and program decisions. Public policymakers and private industry leaders alike depend on ERS expertise and objectivity to inform and enhance their decision making.
The following are some examples how ERS provides insights into key issues in agriculture, trade, food, and rural America, and how stakeholders and policymakers use that information. Not only does ERS provide this information through recently published research and analysis on its website, but also through briefings for policy officials and live webinars (recordings provided here).
What is the role of family farms in U.S. Agriculture?
Family farms account for 99 percent of all farms and 90 percent of all agricultural production. Even among large farms with at least a million dollars in sales, family operations account for over 80 percent of production. On a family farm, the principal operator—the person primarily responsible for day-to-day management decisions—also owns the farm business. Agriculture is an unusual industry, because family businesses still dominate. ERS research defines family farms, identifies their role in U.S. agriculture, and informs farm policy.
ERS analyses, which rely on annual farm surveys administered by ERS and USDA’s National Agricultural Statistics Service (NASS), track changes in the size distribution of farms, the mix of commodities that they produce, their commercial linkages to suppliers and buyers, and the households that operate them. ERS researchers explore why family businesses are so common in agriculture, and assess the special risks that these family businesses face.
These analyses are used by USDA agencies, such as the Farm Service Agency and the Natural Resources Conservation Service, to help define and count specific types of farms (such as family farms, small farms, and beginning farmers) for implementation of farm programs. ERS reports, and briefings based upon them, are used by USDA’s Office of the Secretary of Agriculture and elsewhere in the executive branch to understand the organization of agriculture and how commodity and conservation policies might affect farm organization. The ERS annual report on America’s Diverse Family Farms is used by the Congressional Research Service (for new Congressional staffers) as a basic source of information on organization of the farm sector. It is also used by a wide range of media sources for reporting on family farms and farm organization.
America’s Diverse Family Farms, and other reports like The Evolving Distribution of Payments From Commodity, Conservation, and Federal Crop Insurance Programs are available on the ERS website. Visit the ERS Farm Structure and Organization page for more information.
What does the global agricultural trade landscape look like?
Global agricultural trade, valued at more than $1 trillion in 2015, has grown by about 3.6 percent per year over the past two decades. Growth occurred across all major categories of agricultural trade, with trade in oilseeds and edible oil products showing the largest increase. By contrast, growth across countries and regions was uneven. Agricultural exports by the five BRIIC (Brazil, Russia, India, Indonesia, China) countries grew much faster than the global average. Agricultural imports of emerging economies grew quickly, dominated by growth in China’s imports. In addition to the overall increase in trade, there have been significant shifts in trade patterns and trade policy. Rising domestic support in some countries and sanitary, phytosanitary, and other technical barriers to trade increasingly limit market access.
ERS research provides the context for decisions that need to account for the global nature of today’s food and agricultural markets. Specifically, the research presented in the ERS report The Global Landscape of Agricultural Trade: 1995-2014 offers a comprehensive view of key trends in trade and trade policy that will shape outcomes. The report covers some of the most pressing trade topics, providing information to be used by USDA and other U.S. Government officials to evaluate policy options and inform discussions on how U.S. and competitor policies can be oriented to maintain a level playing field for U.S. agriculture around the world.
What is the status of household food security in the United States?
Most U.S. households have consistent, dependable access to enough food for active, healthy living—they are food secure. But some American households experience food insecurity at times during the year, meaning their access to adequate food is limited by a lack of money and other resources. The estimated percentage of U.S. households that were food insecure in 2016—12.3 percent—was essentially unchanged from 2015 (12.7 percent), but continued a downward trend from a high of 14.9 percent in 2011. The prevalence of very low food security also essentially unchanged, at 4.9 percent in 2016 and 5.0 percent in 2015.
ERS plays a leading role in Federal research on food security and food security measurement in U.S. households and communities. An annual ERS report Household Food Security in the United States includes changes in food insecurity from previous years, the prevalence of food insecurity by selected household characteristics, and food insecurity among children. This report provides USDA, academic researchers, State and local governments, advocacy groups, and not-for-profit organizations with official statistics on the prevalence of food security—defined as consistent access to enough food for active, healthy living—and a direct measure of those in need of assistance. Users depend on this statistical report to track changes in food insecurity over time, across space, and among population groups. Food insecurity is a leading indicator of material hardship in the United States and has been used to identify effectiveness of Federal nutrition assistance programs.
What are the latest indicators of social and economic conditions in rural America?
Rural America encompasses 72 percent of the Nation’s land area, houses 46 million residents, and plays an essential role in the overall economy. Rural areas are more economically diverse than in the past, with employment reliant not only on agriculture and mining but also manufacturing, services, and trade. Rural counties with economies based on tourism and recreation maintained higher-than-average population growth rates during 2010-16. For rural areas as a whole, employment has increased modestly since 2011 and median incomes are rising once again. Infrastructure investments, like expanding broadband internet access, could improve economic performance and contribute to quality of life through more robust delivery of education, healthcare, public safety, and other services.
ERS researchers examine trends in rural areas of the United States and produce reports throughout the year on social and economic conditions in rural America. Rural America at a Glance, an annual report summarizing current conditions, specifically focuses on county-level trends in population change, mortality, employment change by industry, income and poverty, as well as access to broadband service. These are important indicators of opportunities and challenges facing rural America, which in turn help inform decisions about rural development programs.
Rural America at a Glance is used by rural researchers, local and regional stakeholders, and federal policymakers to stay up-to-date about broad demographic and economic trends affecting rural communities. The research covers several topics relevant to rural development decision-making; for example, regarding new investments in rural infrastructure, business loans, and housing assistance.
How much do major foodborne illnesses cost in the United States?
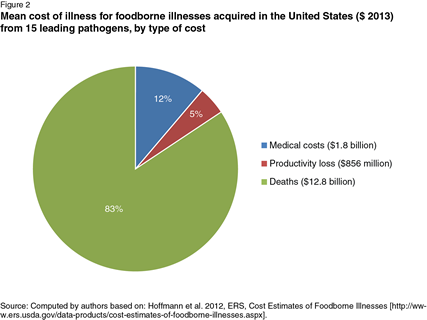 The Centers for Disease Control and Prevention (CDC) estimates that each year in the United States, there are 48 million cases of foodborne illness, and the costs associated with illness from 14 major pathogens is over $14 billion. ERS is one of the world leaders in estimating the costs of foodborne illness. ERS's data product, Cost Estimates of Foodborne Illnesses, provides detailed information about the costs of these illnesses and the cost of illness estimates are revised every 5 years to reflect current health care costs and changes in epidemiology.
The Cost Estimates of Foodborne Illness provides Federal agencies such as USDA's Food Safety and Inspection Service (FSIS) with a set of consistent, peer-reviewed estimates to develop regulations for meat and poultry slaughter and processing plants, in regulatory cost-benefit analysis required for federal rule-making, and to inform their management of food safety programs and set priorities. The estimates also provide other stakeholders in the food and agriculture industry, state departments of public health, and the general public with a means of understanding the relative impact of different foodborne infections in the United States.
ERS research in action
The above examples show how policymakers regularly use ERS research to inform decisions. However, ERS is also often cited in other organizations' research, providing trusted, policy-neutral information for the research community to produce their own work that informs many other policy decisions. Here are two examples from the past year from the Congressional Budget Office and Congressional Research Service.
- Congressional Budget Office: Options to Reduce the Budgetary Costs of the Federal Crop Insurance Program
- Congressional Research Service: Major Agricultural Trade Issues in the 117th Congress