ERS Charts of Note
Subscribe to get highlights from our current and past research, Monday through Friday, or see our privacy policy.
Get the latest charts via email, or on our mobile app for  and
and 
Friday, April 25, 2014
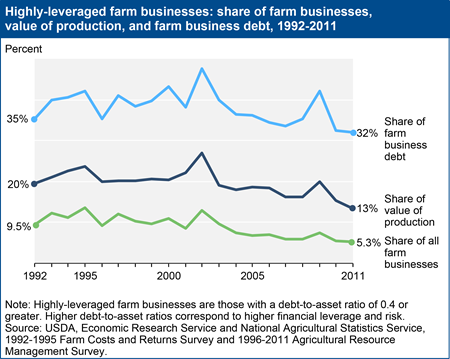
While the average leverage of farm businesses—as measured by debt-to-asset (D/A) ratios—has decreased over time, some farms remain highly leveraged. The D/A ratio that implies financial vulnerability varies with individual farm business characteristics, but a commonly used threshold to indicate high leverage is a D/A ratio greater than 0.4. Using this definition, highly-leveraged farms consistently accounted for a disproportionate but declining share of the total value of production by all farm businesses between 1992 and 2011. In 2011, 5.3 percent of farm businesses were highly leveraged and contributed 13.4 percent of farm businesses’ total value of production; by comparison, in 1992, 9.5 percent of farm businesses, responsible for 19.6 percent of production, were highly leveraged. The declining role of highly-leveraged farms suggests the sector’s financial resiliency has increased over time because financial shocks—such as an unexpected drop in income or a sudden jump in interest rates—would likely affect fewer farm businesses, producing a smaller share of the value of production. This chart appears “Farm Businesses Well-Positioned Financially, Despite Rising Debt” in the April 2014 Amber Waves online magazine.
Thursday, April 3, 2014
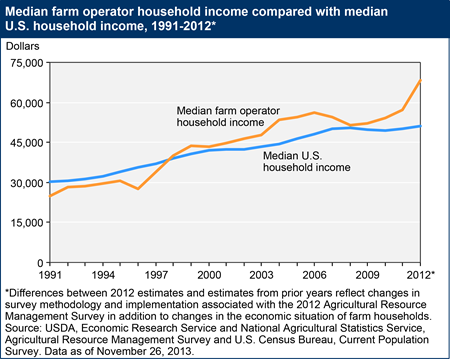
Since the 1980s, ERS has reported an income measure for farm operator households comparable to the U.S. Census Bureau's measure for all U.S. households. From 1991 to 1997, median farm household income (which is driven almost entirely by off-farm income) was consistently less than median U.S. household income. Since 1998, however, the opposite has been true. The reversal may reflect greater returns to farm household skills employed off the farm, in addition to other factors such as changes in the composition of the farm population. As such, the size of the median household income gap reflects differences in the location and type of nonfarm jobs held by the typical farm and U.S. household, as well as variation in farm income. This chart is found in the ERS topic page on Farm Household Well-being, updated February 2014.
Tuesday, February 11, 2014
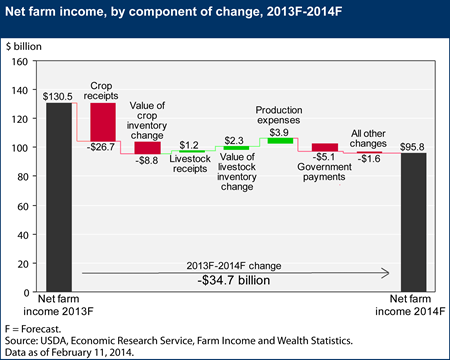
USDA’s initial forecast for 2014 net farm income is $34.7 billion lower than current expectations for 2013, but is $8 billion higher than the average of the previous 10 years. Lower crop cash receipts, and, to a lesser degree, a change in the value of crop inventories and reduced government farm payments, drive the expected drop in net farm income. Crop receipts are expected to decrease more than 12 percent in 2014, led by an expected $11-billion decline in corn receipts and a $6-billion decline in soybean receipts. Elimination of direct payments under the Agricultural Act of 2014 and uncertainty about program enrollment during 2014 result in a projected $5.1 billion decline in government payments. On the other hand, total production expenses are forecast to decline $3.9 billion in 2014, which would be only the second decline in the last 10 years. Livestock receipts and value of inventory change also are expected to increase a combined $3.5 billion in 2014, largely due to higher dairy receipts and the potential for expansion of the beef cattle herd for the first time since 2007. This chart is based on the data available in Farm Income and Wealth Statistics, updated February 11, 2014.
Monday, January 6, 2014
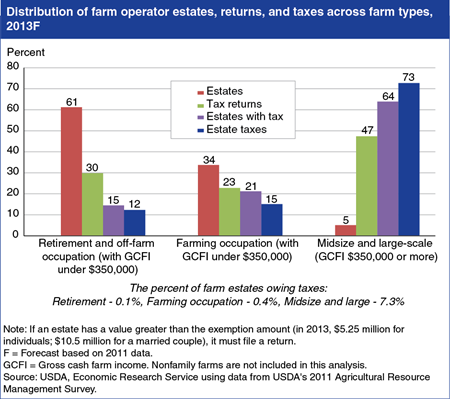
The Federal estate tax applies to the transfer of property after death. Under present law, the estate of a decedent who at death owns assets in excess of the estate tax exemption amount ($5.25 million in 2013 for an individual, $10.5 million for married couples) must file a Federal estate tax return. Based on simulations using farm-level survey data from the 2011 Agricultural Resource Management Survey (ARMS), only about 2.7 percent of family farm estates would be required to file an estate tax return in 2013, with a much smaller share of estates (about .6 percent) owing any Federal estate tax. The impact of the Federal estate tax varies by farm type. Most Federal estate taxes are owed by larger family farm estates. Although these farms account for only about 5 percent of all family farm estates, they account for 73 percent of total family farm estate taxes paid. Only about 7.3 percent of the estimated 2,103 estates involving larger family farms are likely to owe Federal estate taxes in 2013. This chart is found in the ERS topic page on Federal Tax Issues, updated November 2013.
Wednesday, November 13, 2013
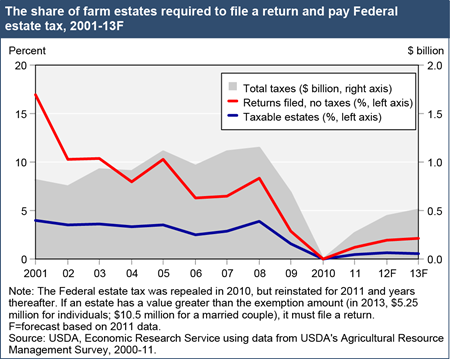
The Federal estate tax applies to the transfer of property after death; it was repealed in 2010 but reinstated for 2011 and years thereafter. Under present law, the estate of a decedent who at death owns assets in excess of the estate tax exemption amount ($5.25 million in 2013 for an individual, $10.5 million for married couples) must file a Federal estate tax return, and those estates are subject to a 40 percent tax rate on the nonexempt amount. Based on simulations using farm-level survey data from the 2011 Agricultural Resource Management Survey (ARMS), in 2013, only about 2.7 percent of farm estates would be required to file an estate tax return, with a much smaller share (about .6 percent) owing any Federal estate tax. Total Federal estate tax liabilities on all farm estates in 2013 are estimated at about half a billion dollars. Historically, these amounts have been much higher. Since 2000, the exemption amount has grown considerably, while the maximum tax rate has fallen. Consequently, the share of estates required to file a return or pay taxes has fallen. This chart is found in the Federal Tax Issues topic page on the ERS website, updated November 2013.
Wednesday, September 25, 2013
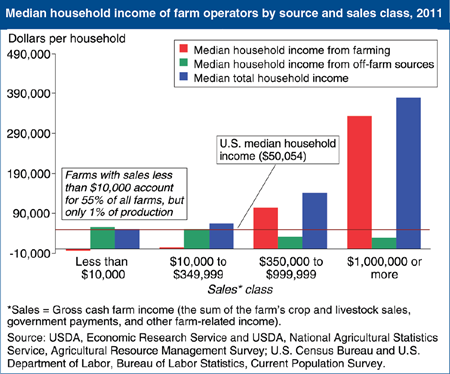
Median total household income among all farm households ($57,050) exceeded the median for all U.S. households ($50,054) in 2011. More than half of U.S. farms are very small, with annual sales under $10,000; the households operating these farms typically draw all of their income from off-farm sources. Median household income and income from farming increase with farm size, as defined by sales. The typical household operating the largest commercial farms earned about $380,000 in 2011, and most of that came from farming. This chart is found in the chart collection, Ag and Food Statistics: Charting the Essentials, on the ERS website, updated September 2013.
Friday, September 13, 2013
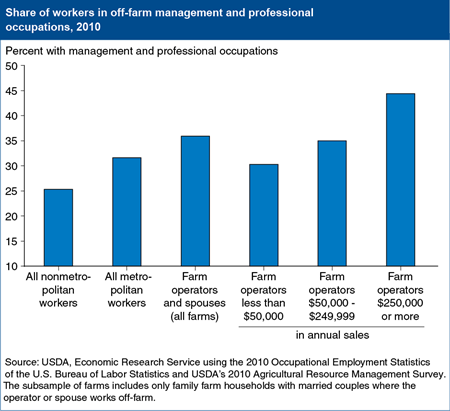
Most farm households earn income from nonfarm sources, and in 2011, roughly 56 percent of their nonfarm income came from off-farm jobs, on average. Based on USDA’s 2010 Agricultural Resource Management Survey, when working off-farm, 36 percent of farm operators and their spouses reported working in management and professional occupations. This share is much higher than that for nonmetropolitan area workers in general (25 percent) and is even higher than that for metropolitan area workers (32 percent). Among farm couples where the operator, spouse, or both reported working off-farm, operators of larger farms reported the highest shares of employment in management and professional occupations, suggesting that many of them are able to apply the knowledge and skills used in managing a sizeable farm operation to other areas of employment. This chart is found in “When Working Off the Farm, Farm Operators Most Commonly Work in Management and Professional Occupations” in the September 2013 issue of ERS’s Amber Waves magazine.
Monday, July 29, 2013
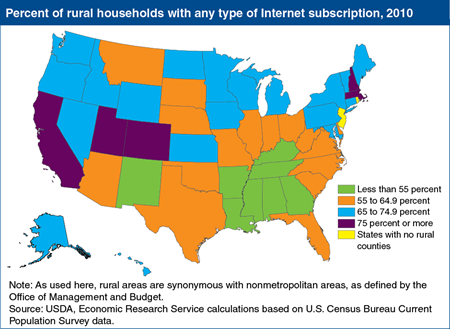
By 2010, 73 percent of U.S. urban households had home subscriptions to the Internet, compared with only 62 percent of rural households and farms, according to Current Population Survey (CPS) data. Rural Internet usage, however, is not uniform across the country. On average, rural households in the Northeast and West are more likely to have some form of inhome access to the Internet, while households in the rural South are the least likely to subscribe. The regional disparity in subscriber rates reflects, to some degree, demographic differences such as income, education, and age. Among rural households that use the Internet, broadband adoption rates (not shown here) are lowest in Appalachia and in several areas—such as Michigan and South Carolina—that experienced the highest unemployment rates during the Great Recession of 2007-09. Rural broadband adoption rates are uniformly below corresponding statewide urban rates. This map is found in the ERS report, Rural Broadband At A Glance, 2013 Edition, June 2013.
Friday, June 7, 2013
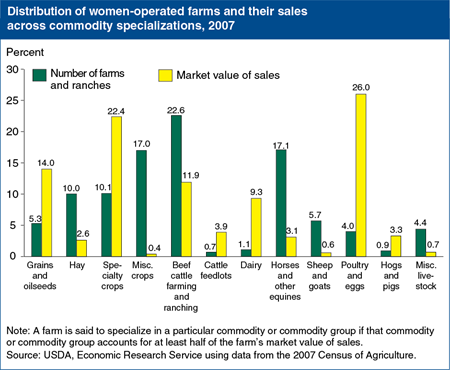
According to the most recent Census of Agriculture, women-operated farms—farms where a woman was the principal operator—numbered 306,200 in 2007 (13.9 percent of all U.S. farms). Most women-operated farms (about 62 percent in 2007) specialized in grazing livestock or miscellaneous crops, but these are mostly small operations that contributed relatively little (16 percent) to the total sales of women-operated farms. A large majority of women-operated grazing livestock farms and ranches had less than $10,000 in annual sales, and 98 percent of miscellaneous crop farms had no sales in 2007. Most sales by women-operated farms (nearly 72 percent in 2007) came from farms specializing in poultry and eggs, specialty crops, grains and oilseeds, and dairy. While accounting for only about 20 percent of women-operated farms, average annual sales exceeded $130,000 for farms with these specializations. This chart is found in the May 2013 Amber Waves.
Tuesday, May 28, 2013
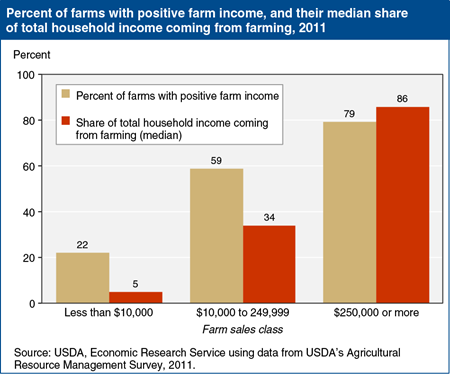
Over the last 20 years, U.S. farm income has represented as little as 4.6 percent of total annual farm household income and never more than 17.5 percent. However, this indicator of farm income’s importance to farm household finances can be misleading since the broad definition of a farm results in a population that includes many households with little or no agricultural production. The role of farm income is better understood by looking at the percent of households with positive income from farming and, for them, the median share of total household income coming from farming. When disaggregated by farm sales class, it becomes clear that farm income contributes little to the annual income of farm households operating smaller farms, is a secondary source of income for those operating farms with sales of $10,000-$249,999, and is a primary source of income for those operating farms with $250,000 or more in sales. This chart is found in the April 2013 issue of Amber Waves.
Friday, April 26, 2013
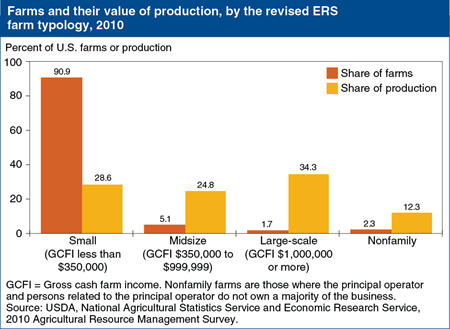
Nearly 15 years have passed since ERS first released its farm typology to classify farms into relatively homogeneous groups based on their gross farm sales, the primary occupation of their operators, and family farm status. A recent update to the ERS farm typology reflects commodity price inflation and structural changes in production that have occurred over time. In response to these changes, ERS recalibrated the size thresholds used in its farm typology, reduced aggregation among large farms, and changed its sales measure to reflect the growth in production contracts. To better reflect income earned by farm operators, we now measure farm size by gross cash farm income (GCFI)—the total revenue received by a farm business in a given year; after adjusting inflation, the new size thresholds for small, midsize, and large farms are as specified in the graph. Using the updated typology, 91 percent of U.S. farms were classified as small in 2010, and accounted for about 29 percent of the value of U.S. farm production. Large-scale family farms under the new typology—less than 2 percent of all farms—accounted for a disproportionately large 34-percent share of the value of production. This chart is based on table 9 in the ERS report, Updating the ERS Farm Typology, EIB-110, April 2013.
Monday, April 15, 2013
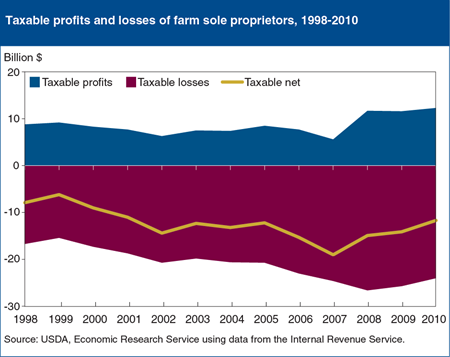
U.S. farm households generally receive income from both farm and off-farm activities, and for many, off-farm income largely determines the household’s income tax liability. Since 1980, farm sole proprietors, in the aggregate, have reported negative net farm income for tax purposes, and over the last decade, both the share of farmers reporting losses and the amount of losses reported generally have increased even as farm sector income hits historic highs. In 2010, the latest year for which complete data are available, U.S. Internal Revenue Service data showed that nearly three out of four farm sole proprietors reported a farm loss, for almost $24 billion in losses. The remaining farms reported profits totaling $12.3 billion. Since only about 60 percent of those reporting a farm profit owed any Federal income taxes, only about 19 percent of farm sole proprietors paid any Federal income tax on their farm income in 2010. This chart is found in the February 2013 Amber Waves feature, Federal Income Tax Reform and the Potential Effects on Farm Households.
Wednesday, March 20, 2013
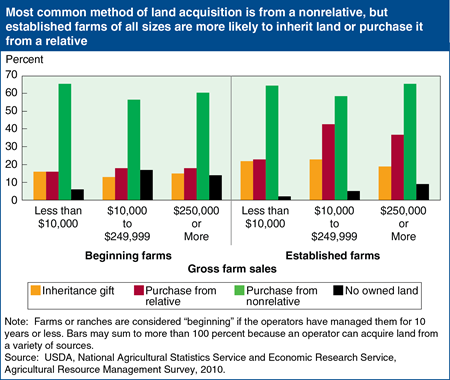
Beginning farms (those with an operator with 10 or fewer years of experience) made up 21 percent of all family farms in 2010, and since they are smaller, on average, than established farms, they accounted for 10 percent of the value of production on family farms. Beginning farmers often report that their biggest challenge getting started in farming is access to enough capital and farmland to operate at a size capable of earning a sufficient profit. Not surprisingly, beginning farm operator’s households have lower farm and nonfarm net worth than established farm households. While most beginning farms include some operator-owned land, they are more likely than established farms to have only rented land. For U.S. farmers, in general, the most common way to have acquired “owned land” for their operation is to have purchased it from a nonrelative. But established farms of all size classes are more likely than beginning farms to have inherited or purchased their owned land from relatives. This chart is drawn from Beginning Farmers and Ranchers at a Glance.
Thursday, February 21, 2013
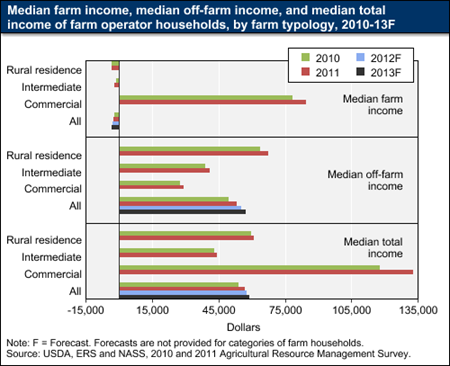
Median total farm household income is forecast to increase by 1.2 percent in 2012, to $57,723, and by an additional 1.9 percent in 2013, to $58,845. Given the broad USDA definition of a farm, many farms are not profitable even in the best farm income years. Despite high prices for many crops, 2012 was no exception, with median income from farming projected to be -$2,799. On the other hand, commercial farms (those with $250,000 or more in gross sales) derive the majority of their income from farming. Their median income from farming increased by 7.9 percent in 2011, as did their total household income. (Income forecasts by farm typology are not available for 2012 and 2013.) Gains in income for households associated with smaller farms—whether farming is considered the operator’s primary occupation (referred to as intermediate farms) or not (residential farms)—came from higher off-farm income in 2011. This chart is found in the Farm Household Well-being topic page on the ERS website, updated February 11, 2013.
Wednesday, February 13, 2013
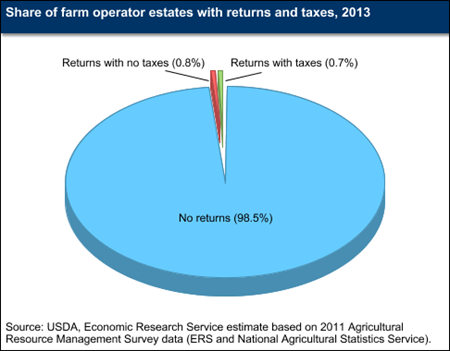
As a result of the American Taxpayer Relief Act of 2012, the current amount that can be transferred to the next generation free of Federal estate tax is $5.25 million ($10.50 million for a married couple). Based on simulations using farm-level survey data from the 2011 Agricultural Resource Management Survey (ARMS), only about 1.5 percent of farm estates would be required to file an estate tax return, and only about half of these estates or 0.7 percent would owe any Federal estate tax. This chart updates information found in the Federal Tax Issues topic page on the ERS website.
Friday, December 28, 2012
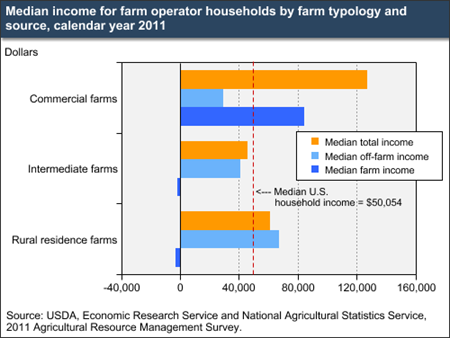
Because of the USDA’s broad definition of a farm, the population of farm households is economically diverse. In 2011, households of the principal operators of commercial farms—farms with annual gross sales of $250,000 or more—had a median total income of $127,009 and a median income from farming activities of $84,649. In contrast, households associated with intermediate farms—those with less than $250,000 in sales whose principal operators considered farming their primary occupation—typically have a loss from farming. The same is true for households of rural residence farms, defined as having less than $250,000 in sales but whose principal operator’s primary occupation is not farming. The typical intermediate and rural residence farm household experienced similar losses from farming, but rural residence farm households had higher median total income ($61,260 compared with $45,889) because of greater off-farm income. Of the three types of farm households, only intermediate farm households had a lower median total income than U.S. households overall ($45,889 compared with $50,054). This chart is based on data found in the Farm Household Well-being topic page on the ERS website, updated November 2012.
Friday, December 7, 2012
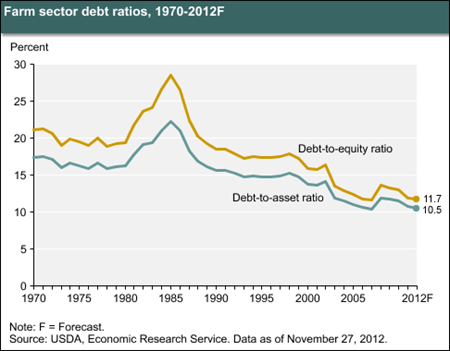
The debt-to-equity ratio and the debt-to-asset ratio are major indicators of the financial well-being of the farm sector. The debt-to-equity ratio measures the relative proportion of funds invested by creditors (debt) and owners (equity). The debt-to-asset ratio measures the proportion of farm-business assets that are financed through debt. Lower ratios signify that farmers are relying less on borrowed funds to finance their asset holdings. The farm sector’s debt-to-asset ratio is expected to decline from 10.7 percent in 2011 to 10.5 percent in 2012. The debt-to-equity ratio is also forecast to decline, from 11.9 percent in 2011 to 11.7 percent in 2012. The steady decline in both ratios since the mid-1980s is due to relatively large growth in the value of farm assets (driven principally by increases in farm real estate values), while farm-debt levels increased at a much slower pace. This chart is from the Farm Sector Income & Finances topic page on the ERS website, updated November 27, 2012.
Friday, November 23, 2012
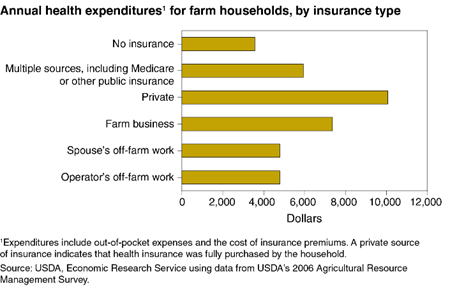
Health insurance options in the United States tend to be employer-sponsored. While the share of farm operator household members without health insurance is about the same as the overall U.S. population, such a system can present challenges to self-employed individuals. A farm business does not generally offer employment-based health insurance, but farm operator households are frequently covered by health insurance from the off-farm employment of the operator or spouse. Farm operator households are more likely to be headed by an individual over age 65 and have average incomes higher than the general population, which can contribute to higher health expenditures (which include both out-of-pocket costs and insurance premiums). With respect to the source of insurance, farm households purchasing individual health insurance directly from private vendors are likely to spend more on health care than those with other sources of health insurance, while households without any insurance coverage have the lowest health care expenditures. This chart appears in "Health Care Expenditures of Self-Employed Farm Households" in the September 2012 issue of ERS's Amber Waves magazine.
Monday, November 19, 2012
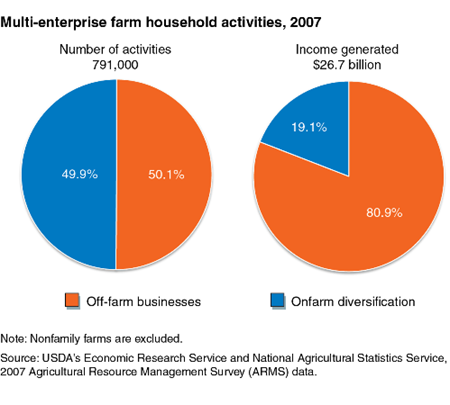
Historically, many U.S. farm households have engaged in other income-generating activities independent of commodity production to support their lifestyles and to help maintain the economic viability of their farm operations. These business ventures can be classified into two broad categories distinguished by the degree to which farm resources are employed or leveraged. Onfarm diversification uses amenities and other attributes of farmland resources and lifestyles to create additional businesses, while other farms operate off-farm businesses in other sectors of their local economy. In 2007, farm households engaged in 791,000 distinct alternative entrepreneurial ventures that generated $26.7 billion in household income. Onfarm diversification and off-farm business ventures each accounted for about half of these activities, but off-farm business ventures generated more than 80 percent of noncommodity business income accruing to farm households. This chart is found in the ERS report, Multi-Enterprising Farm Households: The Importance of Their Alternative Business Ventures in the Rural Economy, EIB-101, October 2012.
Tuesday, October 30, 2012
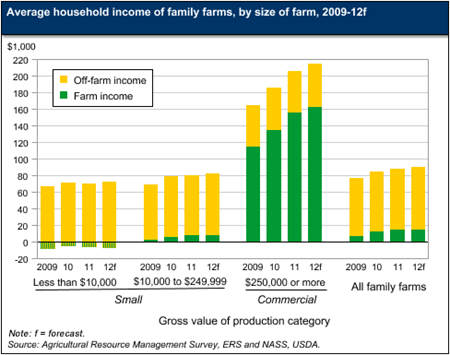
The roughly 2.1 million family farms in the United States vary significantly in the level and sources of household income of their principal operators. In 2011, 60 percent of family farms had gross sales of less than $10,000 and negative average farm incomes, typically receiving all of their household income from off-farm sources. Family farms with gross sales of $10,000 to $249,999 represented 30 percent of family farms in 2011, and the households operating these farms earned, on average, positive returns from their operations. Ten percent of family farms in 2011 were considered to be commercial farms, grossing $250,000 or more. While receiving less in off-farm income than those operating small farms, commercial family farm households earned significantly more on the farms they operated. As a result, they had average household incomes more than twice the level of smaller farm households. This chart is from the Farm Household Well-being topic page on the ERS website.


