
Less production and debt concentrated in highly-leveraged farm businesses than 20 years ago
- by Kevin Patrick and Jennifer Ifft
- 4/25/2014
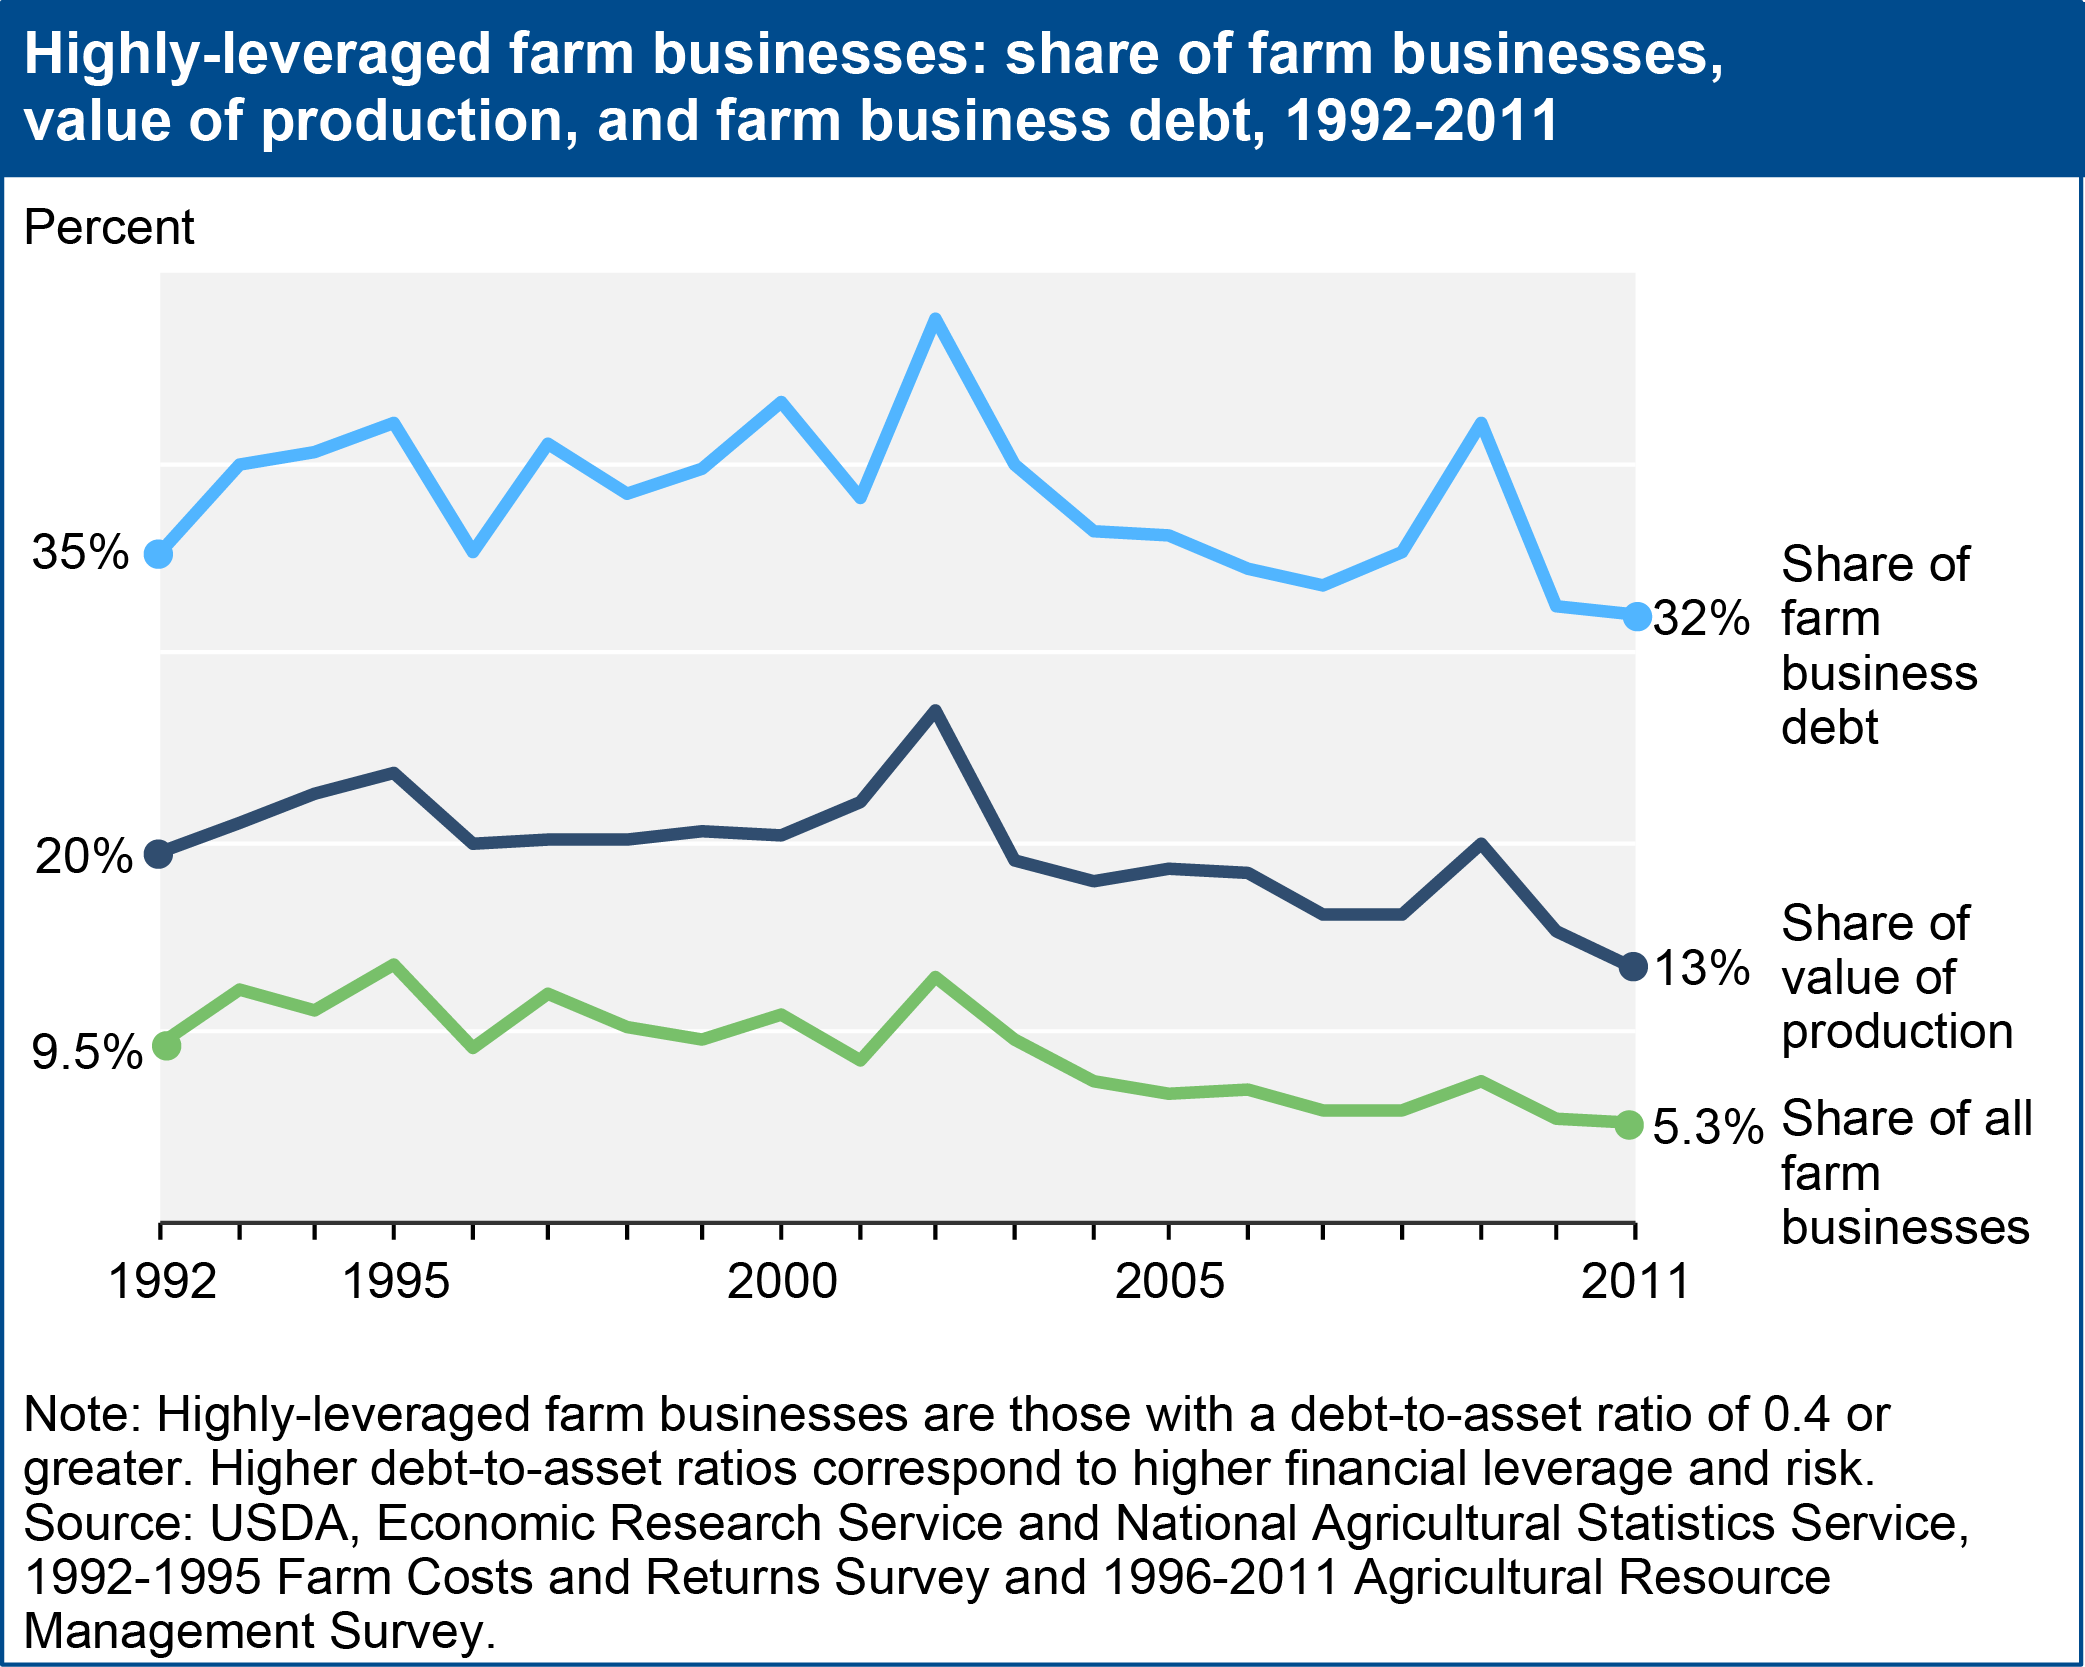
While the average leverage of farm businesses—as measured by debt-to-asset (D/A) ratios—has decreased over time, some farms remain highly leveraged. The D/A ratio that implies financial vulnerability varies with individual farm business characteristics, but a commonly used threshold to indicate high leverage is a D/A ratio greater than 0.4. Using this definition, highly-leveraged farms consistently accounted for a disproportionate but declining share of the total value of production by all farm businesses between 1992 and 2011. In 2011, 5.3 percent of farm businesses were highly leveraged and contributed 13.4 percent of farm businesses’ total value of production; by comparison, in 1992, 9.5 percent of farm businesses, responsible for 19.6 percent of production, were highly leveraged. The declining role of highly-leveraged farms suggests the sector’s financial resiliency has increased over time because financial shocks—such as an unexpected drop in income or a sudden jump in interest rates—would likely affect fewer farm businesses, producing a smaller share of the value of production. This chart appears “Farm Businesses Well-Positioned Financially, Despite Rising Debt” in the April 2014 Amber Waves online magazine.