
ERS revises its farm typology
- by Economic Research Service
- 4/26/2013
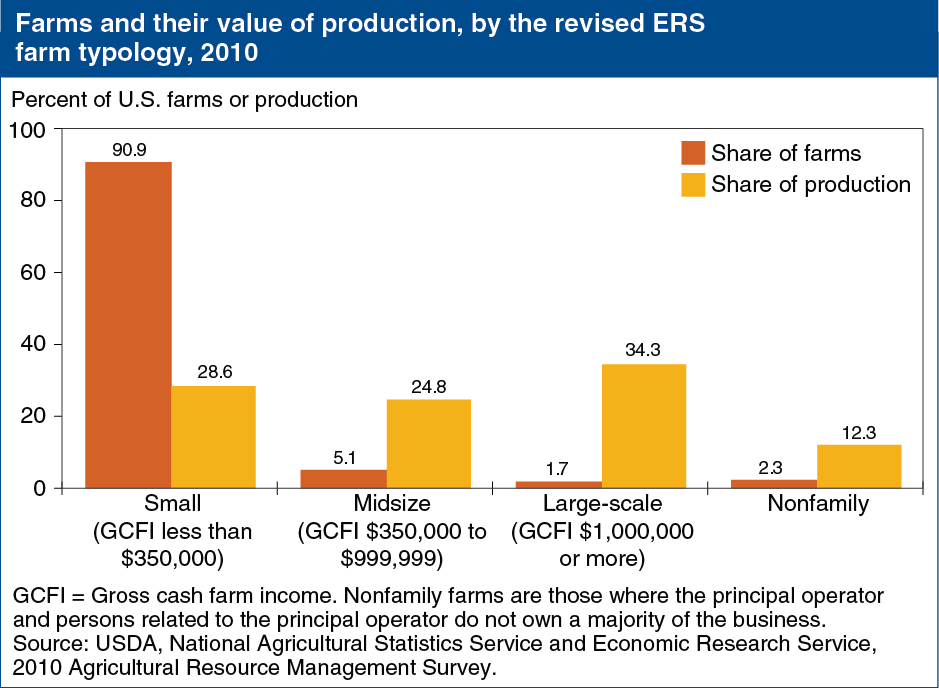
Nearly 15 years have passed since ERS first released its farm typology to classify farms into relatively homogeneous groups based on their gross farm sales, the primary occupation of their operators, and family farm status. A recent update to the ERS farm typology reflects commodity price inflation and structural changes in production that have occurred over time. In response to these changes, ERS recalibrated the size thresholds used in its farm typology, reduced aggregation among large farms, and changed its sales measure to reflect the growth in production contracts. To better reflect income earned by farm operators, we now measure farm size by gross cash farm income (GCFI)—the total revenue received by a farm business in a given year; after adjusting inflation, the new size thresholds for small, midsize, and large farms are as specified in the graph. Using the updated typology, 91 percent of U.S. farms were classified as small in 2010, and accounted for about 29 percent of the value of U.S. farm production. Large-scale family farms under the new typology—less than 2 percent of all farms—accounted for a disproportionately large 34-percent share of the value of production. This chart is based on table 9 in the ERS report, Updating the ERS Farm Typology, EIB-110, April 2013.