ERS Charts of Note
Subscribe to get highlights from our current and past research, Monday through Friday, or see our privacy policy.
Get the latest charts via email, or on our mobile app for  and
and 
Tuesday, February 23, 2016
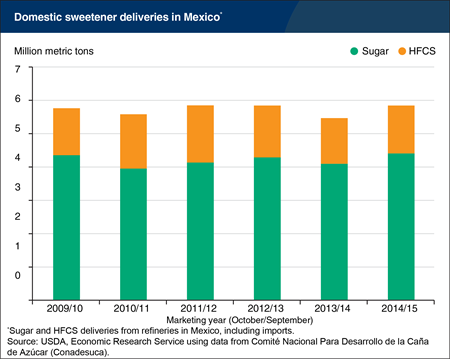
Domestic deliveries of sugar and high-fructose corn syrup in Mexico—a useful indicator of human consumption—rebounded in the most recent marketing year (October/September) after declining about 6.5 percent the previous year. In January 2014, Mexico imposed a tax of one peso per liter on soft drinks in an effort to curb obesity by reducing consumption, and this is believed to be at least partially behind the reduction in sweetener deliveries observed during the 2013/14 marketing year. From October 2014 through September 2015, sweetener use by Mexican food processors returned to levels equivalent to just before the tax was imposed. Food consumption patterns change slowly and reflect many factors, so time and additional research is needed to fully understand the effect of Mexico’s soft-drink tax. This chart is based on the February 2016 Sugar and Sweeteners Outlook.
Monday, February 1, 2016
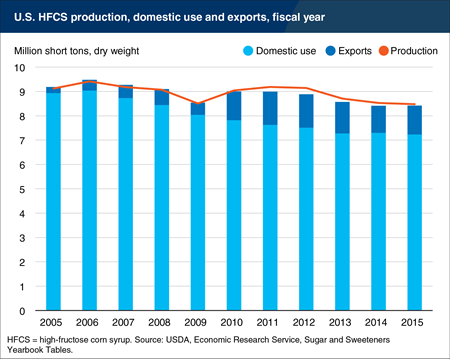
Domestic use of high-fructose corn syrup (HFCS) declined 0.8 percent in the 2014/15 fiscal year (October 1-September 30) to 7.2 million short tons, continuing a decade-long decline. Since 2004/05, domestic use has fallen by 19.1 percent, and it is down 21.8 percent since its peak in 2001/01. Production is trending lower as well, but by a smaller magnitude: 2014/15 production was 7.1 percent below 2004/05 levels and down 10.6 percent from its peak in 1999/2000. Several factors have contributed to this decline, including high corn prices, price competition with refined sugar and other caloric sweeteners, and changing preferences of consumers and food manufacturers. As domestic deliveries have fallen, HFCS exports have become an increasingly important segment of the market. In particular, exports to Mexico increased substantially beginning in 2009/10, shortly after the integration of U.S. and Mexican sweetener markets under NAFTA. This chart is based on the January 2016 Sugar and Sweeteners Outlook.
Wednesday, December 30, 2015
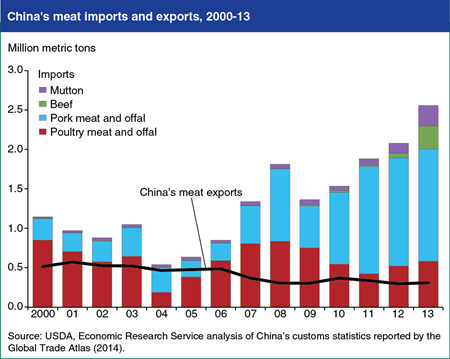
As China enters a new phase of its economic development, its demand for higher-valued products like meat and dairy products is growing rapidly. China’s imports of meats during 2013-14 were more than double the volume imported during the early 2000s. Growing demand and higher prices of domestic meat products have driven the growth in China’s meat imports over the past few years. China’s meat imports have shifted from items like chicken feet and animal offal to muscle meat, as living standards rose and China opened its market to more beef and mutton imports. The U.S. is currently the top supplier of China’s poultry and pork imports. U.S. exports of meat, dairy products, and other consumer-oriented products, such as fruits, nuts, and wine to China rose from $234 million in 2000 to $3 billion in 2013, comprising nearly 12 percent of the value of total U.S. agricultural exports to China that year. The growth in China’s meat imports could mean new opportunities for U.S. exporters. This chart is based on the ERS report, China’s Growing Demand for Agricultural Imports.
Friday, November 20, 2015
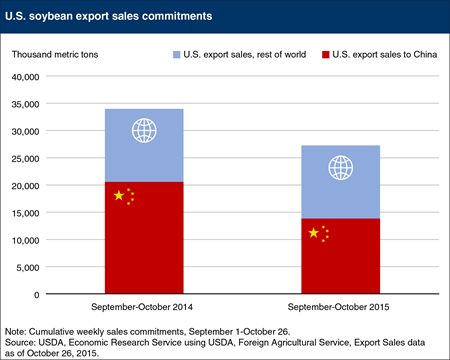
Despite abundant supplies, U.S. soybean exports for the current marketing year (September/August) are forecast down from last year, due largely to greater competition from Brazil. Soybean production in Brazil is forecast to reach a record 100 million metric tons this year. Historically, U.S. soybean exports peak between September and December, while Brazil’s export season peaks between March and June. Brazil’s record production in 2015 is extending exports later into the calendar year, putting them into direct competition with U.S. exports. The result has been a decline in U.S. soybean export sales commitments for the current marketing year, which were down nearly 20 percent through October 2015, compared to the previous year. U.S. export sales commitments to China, the world’s largest soybean importer, were down 33 percent over the same period, while sales commitments to the rest of the world are nearly unchanged from last year. Export sales commitments are sales transactions reported by U.S. exporters, including transactions for future shipments, whereas export data only reports shipments that have already occurred. Hence, sales commitments are useful for forecasting U.S. export volumes. With a large domestic crop and decreased export sales, U.S. ending stocks are expected to grow. This chart is based on the November 2015 Oil Crops Outlook.
Monday, November 9, 2015
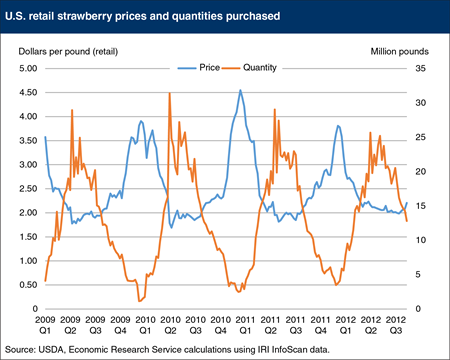
The U.S. retail supply of fresh produce differs from that of manufactured foods, which are available year-round with stable prices. For many produce items, the seasonality of domestic production limits the quantity available in winter to a small fraction of that available during spring or summer, leading to higher retail prices in the off-season. For example, retail strawberry prices in late December can often be more than twice as high as prices in May. Until the early 2000s, berries were not available to most consumers outside the short domestic production seasons. Advances in trade and technology have changed that, and imports—particularly during the fall and winter months, when the supply of domestic berries is at its lowest—are leading to more consistent year-round availability and lower off-season prices. Consumers benefit through the potential for lower food expenditures and greater variety in their diets. This chart is from the ERS report, Measuring the Impacts of Off-Season Berry Imports.
Friday, February 20, 2015
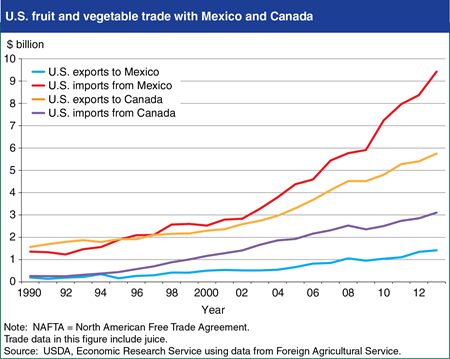
U.S. fruit and vegetable trade with Canada and Mexico has increased more than 380 percent since the implementation of the North American Free Trade Agreement (NAFTA). Canada and Mexico now account for over half of all U.S. trade in fruits and vegetables, up from 37 percent in 1994. Over the same period, the share of U.S. fruit and vegetable trade with South America and Central America has remained relatively steady, while the share accounted for by Asia and the EU declined considerably. Mexico’s annual exports of fruit and vegetables to the United States (including juice) have more than tripled during the NAFTA period, approaching $9.4 billion in 2013. These exports have their roots in the development and growth over the past half century of a Mexican fruit and vegetable sector that is oriented toward the U.S. market. Annual U.S. fruit and vegetable exports to Mexico have more than tripled under NAFTA, reaching about $1.4 billion in 2013 and benefitting from the rapid expansion of Mexico’s supermarket sector, including several U.S. supermarket chains that operate there. At the same time, trade liberalization and broader use of greenhouse technology in Canada has allowed U.S. imports of fruit and vegetables from Canada to grow from $213 million in 1988 to $3.1 billion in 2013. Canada has long been a large market for the U.S. fruit and vegetable industry. During the NAFTA period, U.S. fruit and vegetable exports to Canada have grown from less than $2 billion in 1993 to $5.8 billion in 2013. The chart is from the report, NAFTA at 20: North America’s Free Trade Area and its Impact on Agriculture.
Thursday, February 19, 2015
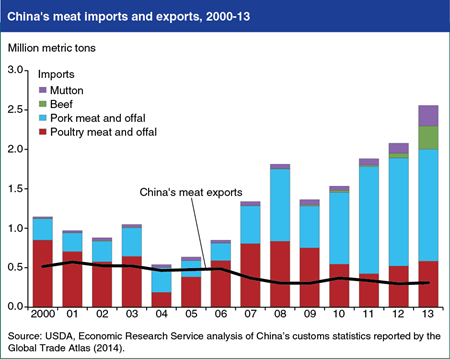
As China enters a new phase of its economic development, its demand for higher-valued products like meat and dairy products is growing rapidly. China’s imports of meats during 2013-14 were more than double the volume imported during the early 2000s. Growing demand and higher prices of domestic meat products have driven the growth in China’s meat imports over the past few years. China’s meat imports have shifted from items like chicken feet and animal offal to muscle meat, as living standards rose and China opened its market to more beef and mutton imports. The U.S. is currently the top supplier of China’s poultry and pork imports. U.S. exports of meat, dairy products, and other consumer-oriented products, such as fruits, nuts, and wine to China rose from $234 million in 2000 to $3 billion in 2013, comprising nearly 12 percent of the value of total U.S. agricultural exports to China that year. The growth in China’s meat imports could mean new opportunities for U.S. exporters. This chart is based on the ERS report, China’s Growing Demand for Agricultural Imports.
Tuesday, February 4, 2014
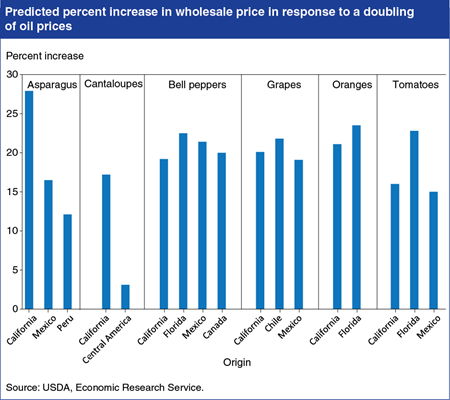
Fresh fruit and vegetable prices are among the most volatile U.S. retail food prices. One potential source of this volatility is the price of oil, as fresh fruits and vegetables often travel long distances from field to consumer. ERS researchers found that the impact of oil price increases on wholesale produce prices depends on both the commodity shipped and the route traveled. A hypothetical doubling of oil prices would be expected to increase wholesale prices of the 6 commodities studied—asparagus, cantaloupes, bell peppers, grapes, oranges, and tomatoes—by 3 to 27 percent depending on the origin of the commodity. Generally, wholesale prices of produce grown in the United States, Canada, and Mexico are more sensitive to changes in oil prices since produce grown in North America is shipped primarily by truck, which has relatively high fuel costs per pound of produce. Fresh fruit and vegetables from South and Central America are more likely to be shipped by plane or boat, which are less fuel-intensive modes of transportation. This chart appears in “Impact of Oil Prices on Produce Prices Depends on Route and Mode of Transportation” in ERS’s Amber Waves magazine, released February 3, 2014.
Tuesday, May 21, 2013
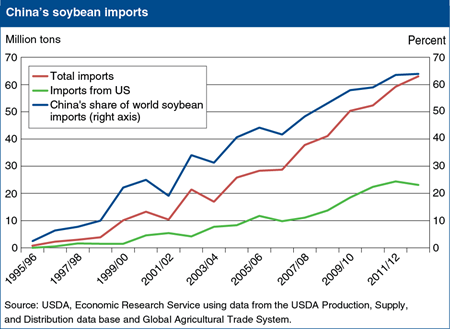
Rising incomes in China have led to a major shift in Chinese diets to include more livestock products. This dietary change, along with policy measures to spur growth in the industrialized feed industry and modern livestock production, has supported remarkable growth of soybean imports used to feed Chinese livestock while Chinese soybean production has been declining in favor of corn and rice production. The elimination of raw soybean import quotas and a surge in foreign investment in the Chinese soybean processing sector following China’s accession to the World Trade Organization (WTO) in 2001 facilitated soybean imports from the United States and other world suppliers. The bulk of soybeans produced in China are for human consumption, while soybeans from the United States and South America, China’s two primary import sources, are crushed for feed and commercial oil uses. China has more than a 60-percent share of global soybean imports. This chart is found in the June Amber Waves article, “Crop Outlook Reflects Near-Term Prices and Longer Term Market Trends.”
Thursday, January 31, 2013
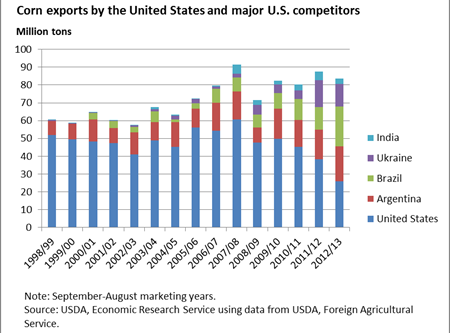
Although the United States remains the world’s largest corn exporter, exports by major U.S. competitors have gained increasing shares of the world market since the mid-2000s. The decline in U.S. corn market share has corresponded with the increased use of corn to produce ethanol in the United States, while sustained, relatively strong corn prices have sparked more production in competitor countries. In 2012/13, U.S. exports are forecast to slip to 26.0 million tons, the lowest since 1971/72, because of drought damage to the U.S. corn harvest. In 2012/13, production prospects have improved in Brazil and Argentina, the largest U.S. competitors. Brazil has been exporting corn at a record pace because tight soybean supplies have allowed a shift of port capacity to corn. Argentina’s corn exports are expected to increase following the March 2013 corn harvest, and are now forecast at a record 19.5 million tons. Ukraine’s corn export prospects remain strong for 2012/13, following the sharp increase in exports in 2011/12. India’s exports, fueled largely by increased adoption of hybrid corn, are also forecast to remain strong in the current price environment. This chart is adapted from the Feed Grain Chart Gallery published with Feed Outlook: January 2013, FDS-13a.
Wednesday, December 19, 2012
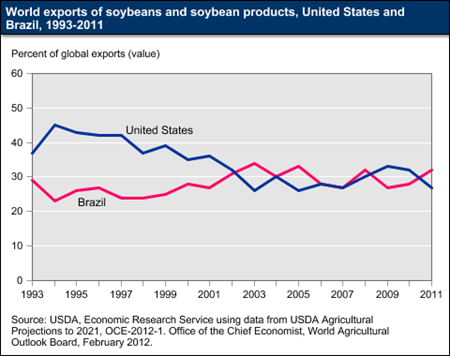
In recent years, Brazil’s production of soybeans and soybean products have risen sharply as most areas of Brazil have seen rapid increases in area planted to soybeans and rising yields. Relatively high profits for soybean producers are expected to lead to an average increase in planted area of about 2 percent per year over the next decade, with increasing soybean plantings in the Cerrado region and expansion extending into the Legal Amazon region of Brazil. Brazil’s soybeans and soybean product exports have also increased significantly and are projected to continue doing so during the next ten years, making the country the world’s leading exporter of soybeans and soybean products, ahead of the United States and Argentina. In 2011, Brazil accounted for slightly more than 32 percent of world trade in soybeans and soybean products, as income and population growth in China, other Southeast Asia, Latin America, North Africa, and Middle Eastern countries contributed to rising demand for soybean and soybean product imports. This chart is an update of one found in the Brazil topic on the ERS website.
Thursday, December 6, 2012
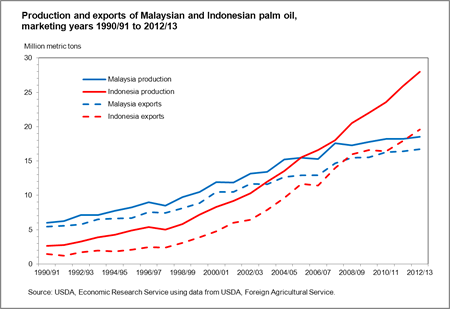
The expansion of palm oil supplies has been a key factor in meeting the rising global demand for vegetable oils, particularly by developing countries like China and India. World prices for other vegetable oils have declined in 2012 along with palm oil, but not as fast. Indonesia and Malaysia are the world’s dominant palm oil producers and exporters, with Indonesia emerging as the largest producer since about 2005, and as the largest exporter in 2011. Growth in Indonesian supplies has been fueled by the expansion of both oil palm growing area and yields. In Malaysia, production growth is constrained by an inability to further expand oil palm growing area and shortages of labor to harvest the crop. Surpluses of palm oil in both Indonesia and Malaysia have placed downward pressure on palm oil prices and generally making it the lowest cost vegetable oil on the world market. This chart appears in ERS’s November 2012 Oil Crops Outlook report.
Monday, December 3, 2012
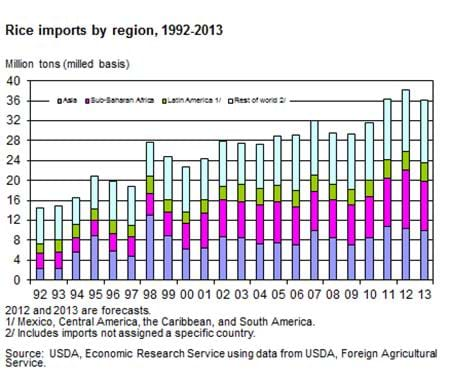
Global rice trade has expanded strongly since 2009 and is estimated at a record 38.2 million tons in 2012, up 6 percent from 2011 and 30 percent from 2009. On the 2012 demand side, growth in rice trade has been broad-based, with higher imports by China and the Philippines, Sub-Saharan Africa (Cote d'Ivoire, Nigeria, Senegal) and South America (Brazil, Colombia). On the 2012 supply side, increased exports by India and Vietnam have more than offset a major drop in shipments from Thailand, typically the largest exporter. India's exports surged to a record 10.0 million tons and Vietnam's exports rose to a record 7.2 million tons in 2012. Higher support prices and a record 2011/12 crop contributed to large government stocks in India that have been sold in the global market at competitive prices, a factor behind the record buying. For 2013, global trade is forecast to slip back to 36.1 million tons as India's stocks decline to a more normal level and the major 2012 importers rely more on accumulated supplies of rice. This chart appears in ERS's November 2012 Rice Outlook report.
Friday, November 9, 2012
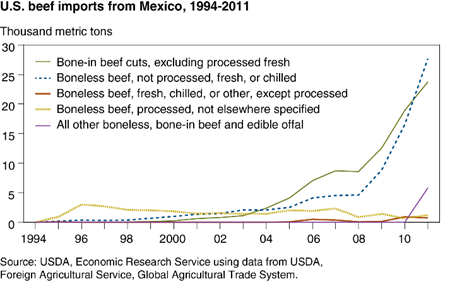
Mexico has historically been a top export market for U.S. beef, but in 2003, it emerged as an important source of beef imports for the United States. In 2011, Mexico exported 59,000 metric tons of beef to the U.S., making it the fourth largest source of U.S. beef imports. The volume of boneless, fresh, or frozen meat cuts exported from Mexico to the U.S. increased by nearly 68 percent from 2010 to 2011, while the volume of exports of Mexican bone-in beef cuts increased by nearly 59 percent. The increase in exports of Mexican beef to the U.S. is partly due to an increase in the number of TIF (Tipo Inspeccion Federal) plants inspected by Mexico's Federal Government. Such plants must meet standards similar to those in the U.S. and must inspect meat that is moved across State borders in Mexico or exported to the U.S. In the last 60 years, the number of operational TIF establishments increased from 15 to 365 across 27 States in Mexico and has grown rapidly in the last few years. This chart appears in "Mexico Emerges as an Exporter of Beef to the United States" in the September 2012 issue of ERS's Amber Waves magazine.
Thursday, October 25, 2012
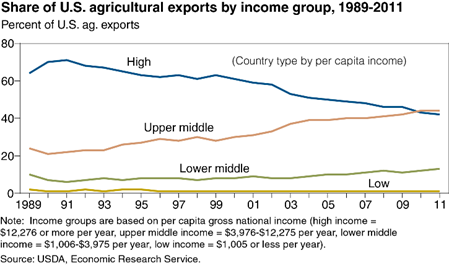
Middle-income countries, including Mexico and China, continue to grow as key partners in U.S. agricultural trade. In 2011, the United States shipped nearly half of its total agricultural exports to upper middle-income countries. Steadily rising income levels, expanding populations, and increased urbanization in developing countries have helped position them as important and fast growing export destinations for U.S. agricultural products, while high-income countries, such as Japan and member states of the European Union, account for declining shares U.S. exports. This chart appears in "Middle-Income Countries Drive U.S. Agricultural Trade" in the September 2012 issue of ERS's Amber Waves magazine.
Friday, August 31, 2012
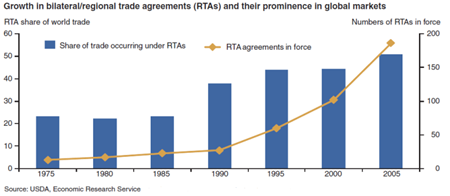
Countries use bilateral and regional trade agreements to increase market access and expand trade in foreign markets. These agreements are called reciprocal trade agreements (RTAs) because members grant special advantages to each other. RTAs include many types of agreements, such as preferential arrangements, free trade agreements, customs unions, and common markets, in which members agree to open their markets to each other's exports by lowering trade barriers. RTAs have become an increasingly prominent feature of the multilateral trading system in recent years. According to the World Trade Organization, there were 186 such agreements in force in 2005, up from 50 just prior to the Uruguay Round in 1994, less than 25 in 1985, and just 13 agreements in 1975. As the number of agreements expanded, the RTA share of world trade rose from 22 percent in 1975 to over 50 percent in 2005. This chart comes from Reciprocal Trade Agreements: Impacts on Bilateral Trade Expansion and Contraction in the World Agricultural Marketplace, ERR-113, April 2011.
Friday, July 20, 2012
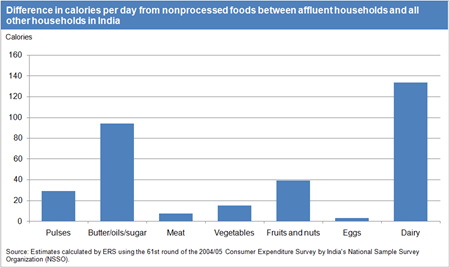
Policymakers and researchers are increasingly concerned with assessing the worldwide food-insecure population and the ways it may be changing. A common denominator in different approaches to assessing food insecurity is the measurement of calories consumed. A recent ERS analysis focuses on India, the country with the largest food-insecure population in the world. Despite India's rapid income growth over the past two decades, current estimates of the number of food-insecure people derived from aggregate production, trade, and income distribution data suggest that the country accounts for nearly 40 percent of the world's food-insecure population. For nonprocessed foods, India's affluent households (with income in the top 10th percentile) purchase an average of 315 more calories than all other households and also purchase significantly more expensive calories. Regardless of income level, the majority of nonprocessed calories purchased are derived from grain products and the amount of calories from grains is nearly identical. However, more affluent households purchased significantly more calories in every other food category. The data for this chart come from Estimating the Range of Food-Insecure Households in India, ERR-133, May 2012.
Friday, July 6, 2012
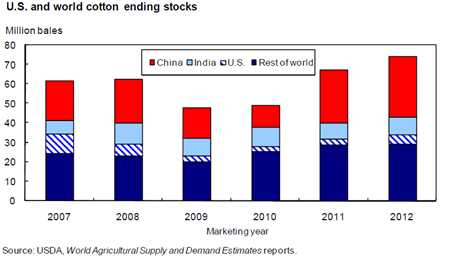
The latest USDA projections for 2012/13 indicate that world cotton stocks are expected to rise for the third consecutive season, reaching a record 74.5 million bales for 2012/13, nearly 11 percent or 7.2 million bales above 2011/12. World cotton stocks have grown as a result of recent record cotton prices that encouraged area increases in 2010 and 2011 that subsequently led to large crops. Meanwhile, higher prices promoted substitution away from cotton by mills, and the slowdown in the global economy reduced demand further, exacerbating the rise in stocks. In China, stocks are projected to expand nearly 20 million bales over a 2-year period because of extensive purchases for its national reserve program, with these stocks likely to be used by Chinese mills as demand rebounds. This chart is found in the Cotton and Wool Outlook, CWS-12d, June 2012.
Tuesday, June 5, 2012
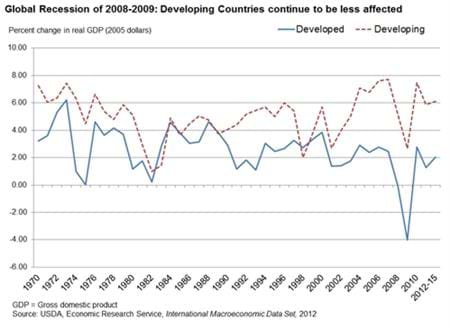
The 2008-09 recession was the deepest and longest witnessed by the global economy since the 1930s, but the continued relatively strong performance of developing countries has buoyed U.S. agricultural trade. Contrary to previous global economic crises, the causes and consequences were seen mostly in developed countries. While both developed and developing countries showed declines in 2008 and 2009, developing country growth remained positive, averaging about 4 percent above developed countries. U.S. agricultural export growth is increasingly dependent on developing countries and has benefited from the relatively strong economic performance of developing countries, as well as the depreciation of the U.S. trade-weighted dollar between 2002 and 2012. This chart is found in The 2008-09 Recession and Recovery Implications for the Growth and Financial Health of U.S. Agriculture, WRS-1201, May 2012.
Friday, May 4, 2012
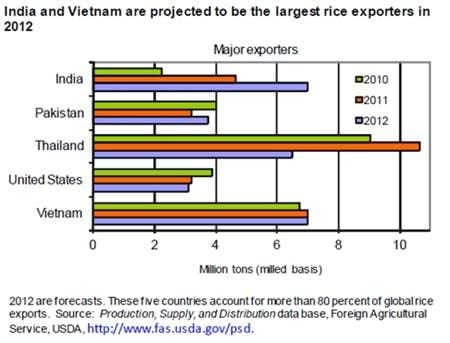
Global rice trade in 2012 is expected to be the second highest on record, with the calendar year 2012 trade forecast of 34 million tons 6 percent below the 2011 record of 36 million tons. The decline in global trade this year is largely due to weaker demand for imports from several top buyers, particularly Bangladesh, Indonesia, and Nigeria. India and Vietnam will be the largest rice exporting countries in 2012, making 2012 the first year since 1981-when the United States was the largest exporter-that Thailand has not been the largest rice exporting country. This chart is found in the April 2012 Rice Outlook, RCS-12d.


