ERS Charts of Note
Subscribe to get highlights from our current and past research, Monday through Friday, or see our privacy policy.
Get the latest charts via email, or on our mobile app for  and
and 
Wednesday, August 13, 2014
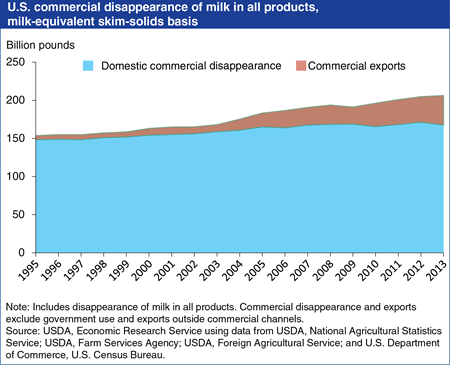
U.S. commercial exports of dairy products have grown since 1995, accounting for an increasing share of the total commercial disappearance of U.S milk production. On a milk-equivalent skim-solids basis (a method of adding up quantities of diverse milk products based on their skim-solids content), U.S. commercial exports grew on average 11.8 percent per year between 1995 and 2013, with their share of total commercial disappearance rising from 3.4 percent in 1995 to 18.7 percent in 2013. Commercial exports of nonfat dry milk (NDM) and skim milk powder (SMP) played a major role in this increase. In recent years, major U.S. markets for NDM and SMP have been Mexico, China, Philippines, and Indonesia. Domestic commercial disappearance serves as a proxy for U.S. consumption, calculated as a residual after accounting for production, on-farm use, imports, exports, and changes in stocks. The commercial data also exclude USDA net removals (price support purchases plus subsidized exports minus sales to the commercial market) which were significant in earlier years but a minor factor since 2004. Find these data in the new commercial disappearance dairy product tables provided in Dairy Data.
Friday, May 16, 2014
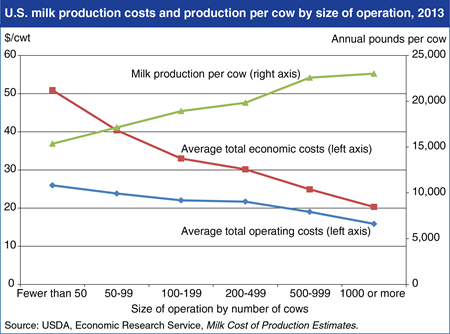
Costs of production for U.S. milk decline as the size of the dairy operation (measured by the number of cows) increases. Based on 2013 data, average total economic costs of milk production—a measure that includes the opportunity costs of land, labor, and other owned resources—fell by nearly 60 percent, from an average of about $50 per hundredweight (cwt) for producers with fewer than 50 cows to about $20 per cwt for those with 1,000 cows or more. Average costs are lower on larger farms because fixed cost items, such as management, land, and other resource costs, are spread across a larger number of cows, and because average output per cow increases along with farm size. Mean output per cow was just over 15,000 pounds among operations with less than 50 cows, while operations with 1,000 or more head averaged more than 23,000 pounds per cow. Higher milk yields on larger farms stem from factors such as better breeding, nutrition, and health management, as well as the ability to access competitively priced supplies of high quality feed inputs. This chart is based on data found in Milk Cost of Production Estimates.
Thursday, May 8, 2014
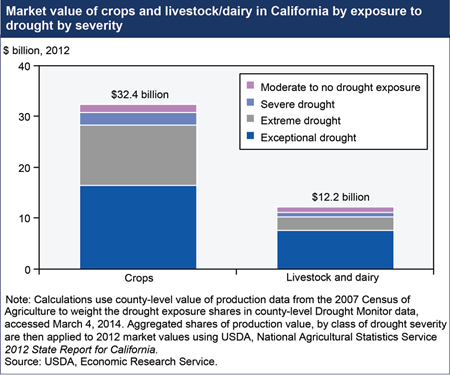
The driest year on record for California, following several prior years of drought, is likely to have an impact on the State’s agricultural production in 2014. On January 17, 2014, the Governor of California declared a drought emergency and as of March 4, over 94 percent of California’s nearly $45 billion agricultural sector was experiencing severe, extreme, or exceptional drought. The livestock sector is more directly exposed to exceptional drought (about 62 percent) than the crop sector (just over 50 percent). Given that much of California’s agricultural production takes place on irrigated land, effects of the drought depend on the cost and availability of water from irrigation in addition to local rainfall. Shortages of irrigation water sourced from snowfall are already evident, and the extent to which growers will be able to offset these reduced surface water supplies by pumping groundwater is uncertain. Find the table underlying this chart and additional analysis in California Drought 2014: Farm and Food Impacts.
Thursday, April 24, 2014
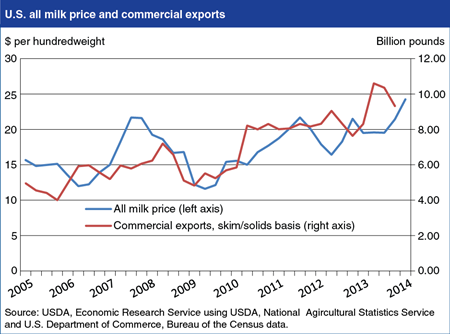
U.S. milk and dairy product prices have reached record levels in nominal terms and are expected to remain high for the remainder of 2014 because of strong foreign and domestic demand. While U.S. domestic demand has strengthened along with the economic recovery, expanding export demand for U.S. milk powder, cheese, and butter is having an increasing influence on the U.S market. The U.S. domestic price for fluid milk—represented by the “All milk” price—is closely linked to dairy product prices, and dairy product exports have risen from 10.9 percent of total U.S. milk production in 2005 (on a skims-solid basis) to 19.2 percent in 2013. Export impacts on U.S. prices vary with the composition of exports, reflected in differences between exports evaluated on a “skims/solids” or “fats” basis. In 2012 and 2013, relatively small “fats basis” exports reduced the impacts on U.S. all-milk prices in some quarters. For January and February of 2014, cheese exports are up 39 percent year-over-year, while milk powder exports are up 12 percent and butter/butterfat exports are up 91 percent. Major export destinations for U.S. dairy products are Mexico and South Korea for cheese and North Africa and the Middle East for butter/butterfat. Despite a year-on-year decline so far in 2014, Mexico remains the largest destination for U.S. milk powder exports; Southeast Asia and China are also major export markets. This chart is based on data found in Dairy Data, with analysis in the Livestock, Dairy, and Poultry Outlook: April 2014.
Wednesday, March 5, 2014
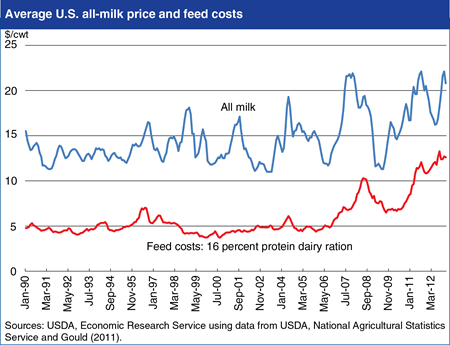
Over the last 20 years, U.S. dairy producers have faced rapidly changing milk prices and input prices, primarily for feeds. The monthly average U.S. all-milk price has been highly volatile since 1990, particularly in more recent years. Factors that account for the increasing variability in milk prices include increased U.S. involvement in (and dependence on) export markets, and weather events in both the United States and other exporters that affected production and dairy stock levels. More recently, dairy producers also faced higher feed costs. Dairy producers generally have low adoption rates of traditional price risk management tools, such as forward contracting, and the use of futures and options markets and trading. The Livestock Gross Margin for Dairy (LGM-Dairy) insurance program is a relatively small and new public risk management program overseen by USDA’s Risk Management Agency (RMA) designed to protect margins between milk prices and input (feed) costs, rather than simply supporting prices. Analysis of the LGM-Dairy program shows that it can be effective in reducing risks, but is unlikely to substantially change farmer’s production level decisions. Find this chart and more analysis in Livestock Gross Margin-Dairy Insurance: An Assessment of Risk Management and Potential Supply Impacts.
Monday, September 9, 2013
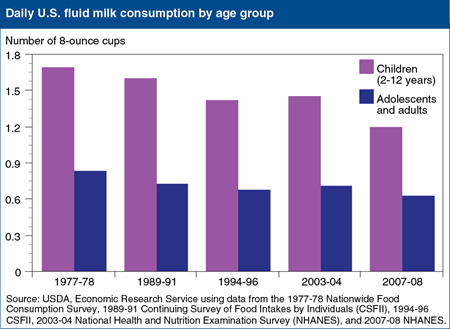
Federal dietary guidance recommends 2 cup-equivalents of dairy products per day for children ages 2-3 years, 2.5 for those ages 4-8, and 3 for Americans older than 8. However, per capita dairy consumption has been steady at about 1.5 cup-equivalents since the 1970s, despite a near tripling of cheese consumption. This static per capita dairy consumption is due to Americans drinking progressively less fluid milk—children as well as adults. USDA food intake surveys show a 25-percent decline in milk consumption by American teenagers and adults, from 0.8 cups per day in 1977-78 to 0.6 cups in 2007-08, and a 30-percent drop for children ages 2-12. In 2007-08, preadolescent children drank an average of 1.2 cups of milk per day versus 1.7 cups in 1977-78. This chart appears in “Americans Not Drinking Milk as Often as Their Parents Did” in ERS’s Amber Waves magazine, September 2013.
Wednesday, July 10, 2013
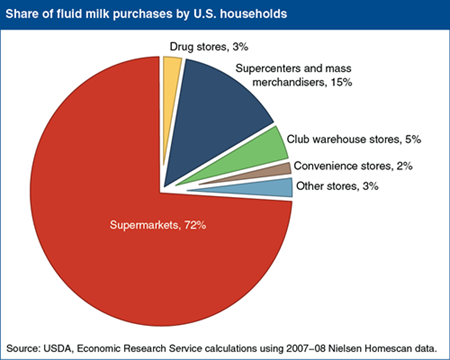
When purchasing food, households make many choices, including what to buy and where to shop. ERS researchers looked at how changes in income affect U.S. consumers’ milk purchasing decisions, including the type of store to patronize. They found that 72 percent of milk purchases took place in supermarkets, followed by 15 percent in supercenters and mass merchandisers. Club warehouse stores and drug stores accounted for 5 and 3 percent of milk purchases, even though these two store types had lower average milk prices than supermarkets, supercenters, or mass merchandisers. The analysis revealed that most households are unlikely to change where they buy their milk, even after large changes in income. Interestingly, a household was 6 percent more likely to buy its milk in a convenience store after its annual income dropped from $60,000 to $40,000, despite the higher price of milk in these stores. Other factors, such as the availability of a car and time to drive to a supermarket, can correlate with income and affect purchase decisions. The data for this chart are from “Changes in Income Have Small Effect on Where a Household Shops for Milk” in ERS’s July 2013 Amber Waves magazine.
Wednesday, June 12, 2013
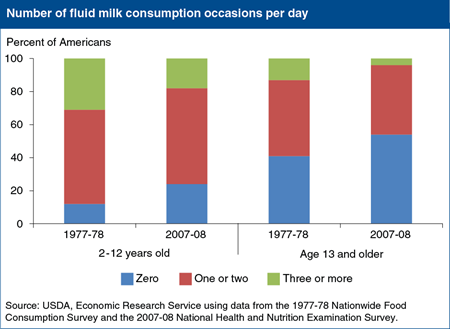
U.S. fluid milk consumption has fallen over the last 40 years from an average of 0.96 cups per person per day in 1970 to 0.61 cups in 2010. A recent ERS study found that changes in the frequency of drinking milk since the 1970s, not in portion sizes, contributed to the trend. Between 1977-78 and 2007-08, the share of children age 2-12 that did not drink fluid milk on a given day rose from 12 percent to 24 percent, while the share that drank milk three or more times per day dropped from 31 to 18 percent. The share of teenagers and adults who did not drink fluid milk on a given day rose from 41 to 54 percent, and the share that drank milk three or more times fell from 13 to 4 percent. This chart appears in the ERS report, Why Are Americans Consuming Less Fluid Milk? A Look at Generational Differences in Intake Frequency, ERR-149, released May 29, 2013.
Wednesday, May 8, 2013
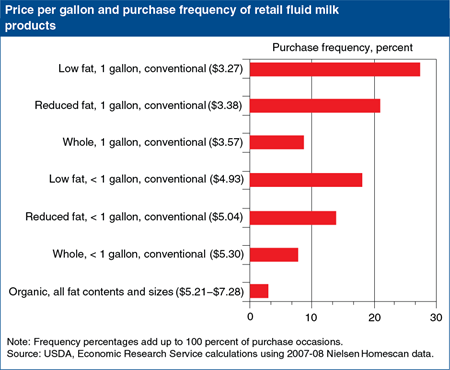
Consumers can buy fluid milk in a variety of forms and at a variety of prices. A recent ERS report looked at purchases of milk products that contained three different fat contents, came in two container sizes, and were produced by either conventional or organic methods. In 2007-08, conventionally produced, low-fat milk in a gallon container was the most frequently bought fluid milk product (28 percent of all milk purchases), while organic milk in all fat contents and container sizes accounted for 3 percent of milk purchases. The researchers analyzed how changes in milk prices and household income affect purchase frequency among fluid milk products. They found that an increase in income or overall milk prices raises the probability that the household will purchase low fat milk. An increase in household income also raises the probability of purchasing organic milk. In general, the demand for organic milk is more sensitive to swings in income and price than is the demand for conventional milk. This chart is based on data in the ERS report, Households’ Choices Among Fluid Milk Products: What Happens When Income and Prices Change?, released April 16, 2013.
Tuesday, February 19, 2013
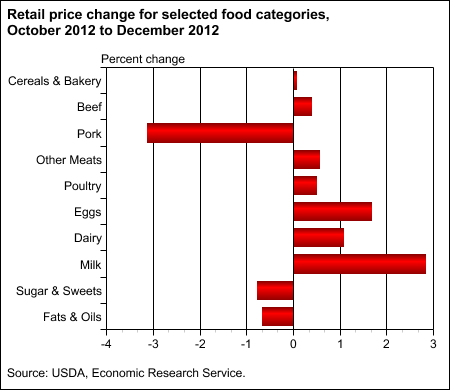
In the final three months of 2012, higher field corn prices resulting from the Midwest drought began to show up on supermarket shelves. From October to December, while the all-items CPI fell 0.8 percent and overall food-at-home prices increased only 0.2 percent, prices rose for most foods that rely heavily on corn-based animal feed—beef, pork, poultry, other meats, eggs, and dairy products. Milk prices rose nearly 3 percent while egg prices increased 1.7 percent. Prices for beef, poultry, and other meats all rose by about 0.5 percent. The only animal-based category defying this trend is pork, where rising inventories and falling exports have caused retail prices to drop from historically high levels in early 2012. ERS forecasts prices for all meat and animal-based products to increase steadily through the first half of 2013. More information on food price changes and forecasts can be found in the Food Price Outlook data product, updated January 2013.
Thursday, December 13, 2012
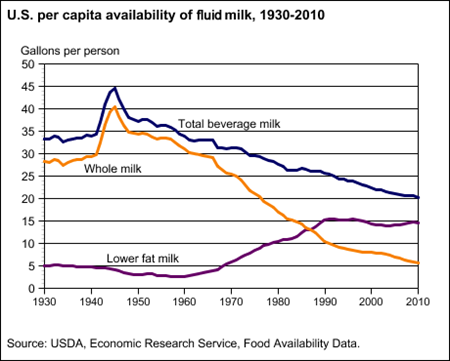
Americans seem to be heeding the advice of nutritionists to seek out lower fat foods—at least when it comes to fluid milk. In 2010, the per capita supply of whole milk available for consumption fell to 5.6 gallons from 6 gallons in 2009, according to ERS’s food availability data, continuing its long-term decline from a peak at 40.5 gallons per capita in 1943. Per capita availability of lower fat milk, which includes milks with milk fat levels ranging from 2 percent to skim milk and buttermilk, began rising in 1967, and in 1987, at 13.1 gallons per capita overtook whole milk. Per capita supplies of lower fat milk have remained fairly stable since leveling off in 1989 at around 14 to 15 gallons. Total beverage milk consumption continues to drop as other beverages compete to quench America’s thirst. The data for this chart come from ERS's Food Availability (Per Capita) Data System.
Tuesday, December 4, 2012
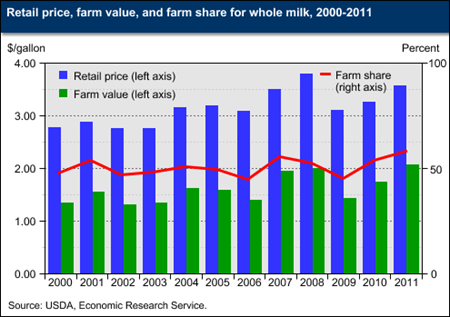
Transforming milk supplied by farmers into the dairy products consumers buy at retail food stores requires processing, packaging, and transportation. Costs for these and other value-adding services also account for a substantial portion of a food's retail price. ERS compares prices paid by consumers for selected dairy products with those received by farmers for milk to calculate the farm share of the retail price. Since 2000, the farm share of a gallon of whole milk has fluctuated between 45 percent and 58 percent, with the highest shares seen in 2007 and 2011. A sharp decrease in farm prices pushed down the farm value of a gallon of whole milk to $1.43 in 2009. As farm prices recovered over the next few years, the farm value rose to $1.75 in 2010 and $2.07 in 2011. The farm share of the retail price simultaneously rose from 46 percent in 2009 to 54 percent in 2010 and 58 percent in 2011. More information on ERS's farm share data can be found in the Price Spreads from Farm to Consumer data product, updated November 14, 2012.
Wednesday, October 3, 2012
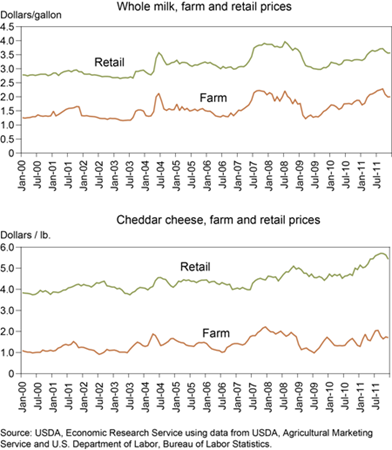
Changes in the farm value and retail price of whole milk tend to track relatively closely over time. Milk moves from farms to retail outlets, via fluid milk processors, in a matter of days. Prices paid at each end of the supply chain are thus close together in time, and changes may be transmitted quickly from level to level. The relationship between the farm value and retail price is weaker for Cheddar cheese. Cheese manufacturing is a lengthier process than fluid milk processing, and cheese may pass through several intermediaries before reaching retail outlets. Prices at each end of the supply chain are thus farther apart in time, and changes at one level are not reflected as quickly at the other. This chart appears in "Retail Dairy Prices Respond Differently to Farm Milk Price Shocks" in the September 2012 issue of ERS's Amber Waves magazine.
Tuesday, August 21, 2012
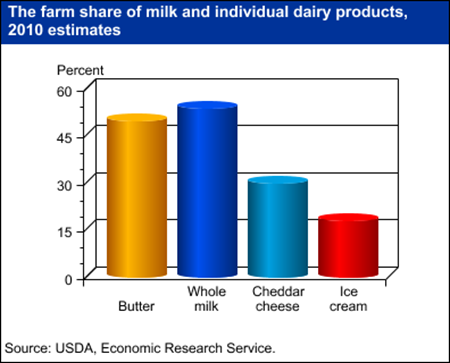
The farm share--the portion of a food's retail price that represents what farmers earn for the agricultural commodities used to produce the food--varies depending, in part, on the degree of processing. Farm shares for highly-processed foods are generally smaller than less processed foods. Dairy products are a case in point. Minimally-processed products like milk and butter have higher farm shares than cheese or ice cream. In 2010, the farm share for fresh whole milk was 54 percent, while the farm shares for Cheddar cheese and ice cream were 30 percent and 18 percent, respectively. Cheddar cheese's lower farm share reflects the costs to process milk into cheese, along with aging, cutting, shredding, packaging, and/or advertising costs. Ice cream makers have greater costs for non-milk inputs like packaging, advertising, and ingredients such as nuts and cookie bits. The data for this chart come from ERS's Price Spreads from Farm to Consumer data set.
Thursday, July 7, 2011
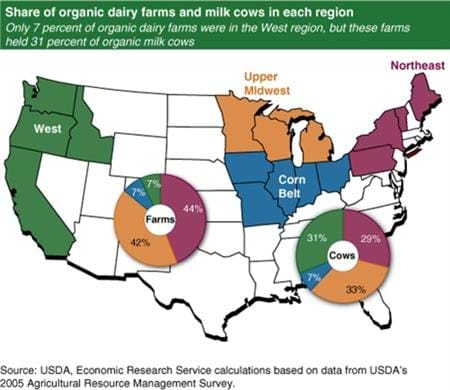
More than 80 percent of U.S. organic dairies were located in the Northeast and Upper Midwest, but these operations were smaller and less productive than those in the West. Only 7 percent of organic dairies were in the West, but these operations accounted for 31 percent of organic milk cows. Organic dairy operations in the Northeast averaged 53 cows; the Upper Midwest, 64 cows; and the West, 381 cows. Organic dairy cows in the West averaged nearly 16,000 pounds of annual milk production per cow, 2,700 pounds more than in the Upper Midwest and 4,000 pounds more than in the Northeast. This map appeared in the June 2010 issue of Amber Waves magazine.
Monday, June 13, 2011
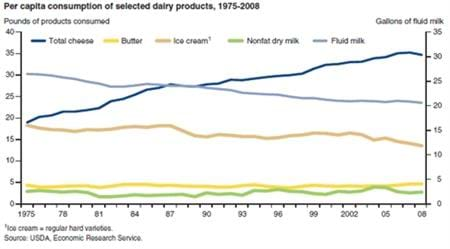
Cheese sales are a key economic component of the U.S. dairy industry. As consumer demand for cheese products has risen over time, more of the milk produced on American dairy operations has been allocated to making a variety of cheeses. About 188.9 billion pounds of milk were marketed in the United States in 2008, and 127 billion pounds were used in the manufacture of dairy products. Cheese production (not including cottage cheese) took about 65 percent (82 billion pounds) of the milk used for manufactured products. Continued growth in cheese consumption is a key factor in determining a positive market outlook for the U.S. dairy industry. This chart was originally published in Long-Term Growth in U.S. Cheese Consumption May Slow, LDP-M-193-01, August 2010.
Wednesday, May 18, 2011
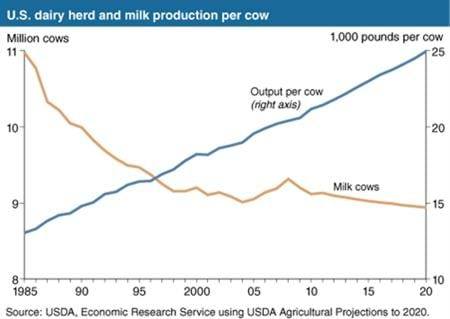
After a 4-year increase during 2005-08, milk cow numbers fell in 2009 and 2010 and are projected to continue year-to-year declines in 2012-20. Milk production is projected to continue rising in 2012-20, as continued technological and biological developments increase milk output per cow. Cow numbers decline at lower rates toward the end of the 2012-20 projection period as the transition in most regions from smaller, diversified farms to larger, specialized dairy operations matures. This chart appeared in the June 2011 issue of Amber Waves magazine.
Monday, March 21, 2011
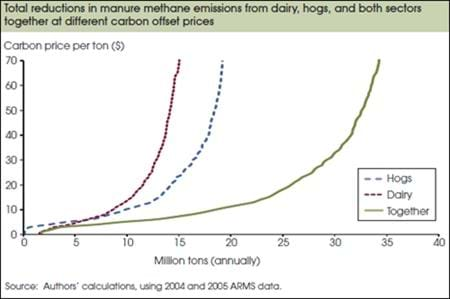
Methane digester systems capture methane from lagoon or pit manure storage facilities and use it as a fuel to generate electricity or heat. In addition to providing a renewable source of energy, digesters can reduce greenhouse gas emissions and provide other environmental benefits. Methane digesters have not been widely adopted in the United States mainly because the costs of constructing and maintaining these systems have exceeded the value of the benefits provided to the operator. But policies to reduce greenhouse gas emissions could make such biogas recovery facilities profitable for many livestock producers. Without a carbon market (when the price is zero), no hog and few dairy operations find it profitable to adopt a digester. As the carbon price increases, more operations adopt digesters, lowering emissions. At a carbon price of $13, greenhouse gas emissions could be reduced by 9.8 and 12.4 million tons (carbon dioxide equivalent) for the dairy and hog sectors, respectively. This amounts to reductions of 61-62 percent of manure-generated methane in these sectors. A doubling of the carbon price to $26 could cause manure-based methane emissions from dairy and hogs together to be reduced by 78 percent. This chart was originally published in Carbon Prices and the Adoption of Methane Digesters on Dairy and Hog Farms, EB-16, February 2011.


