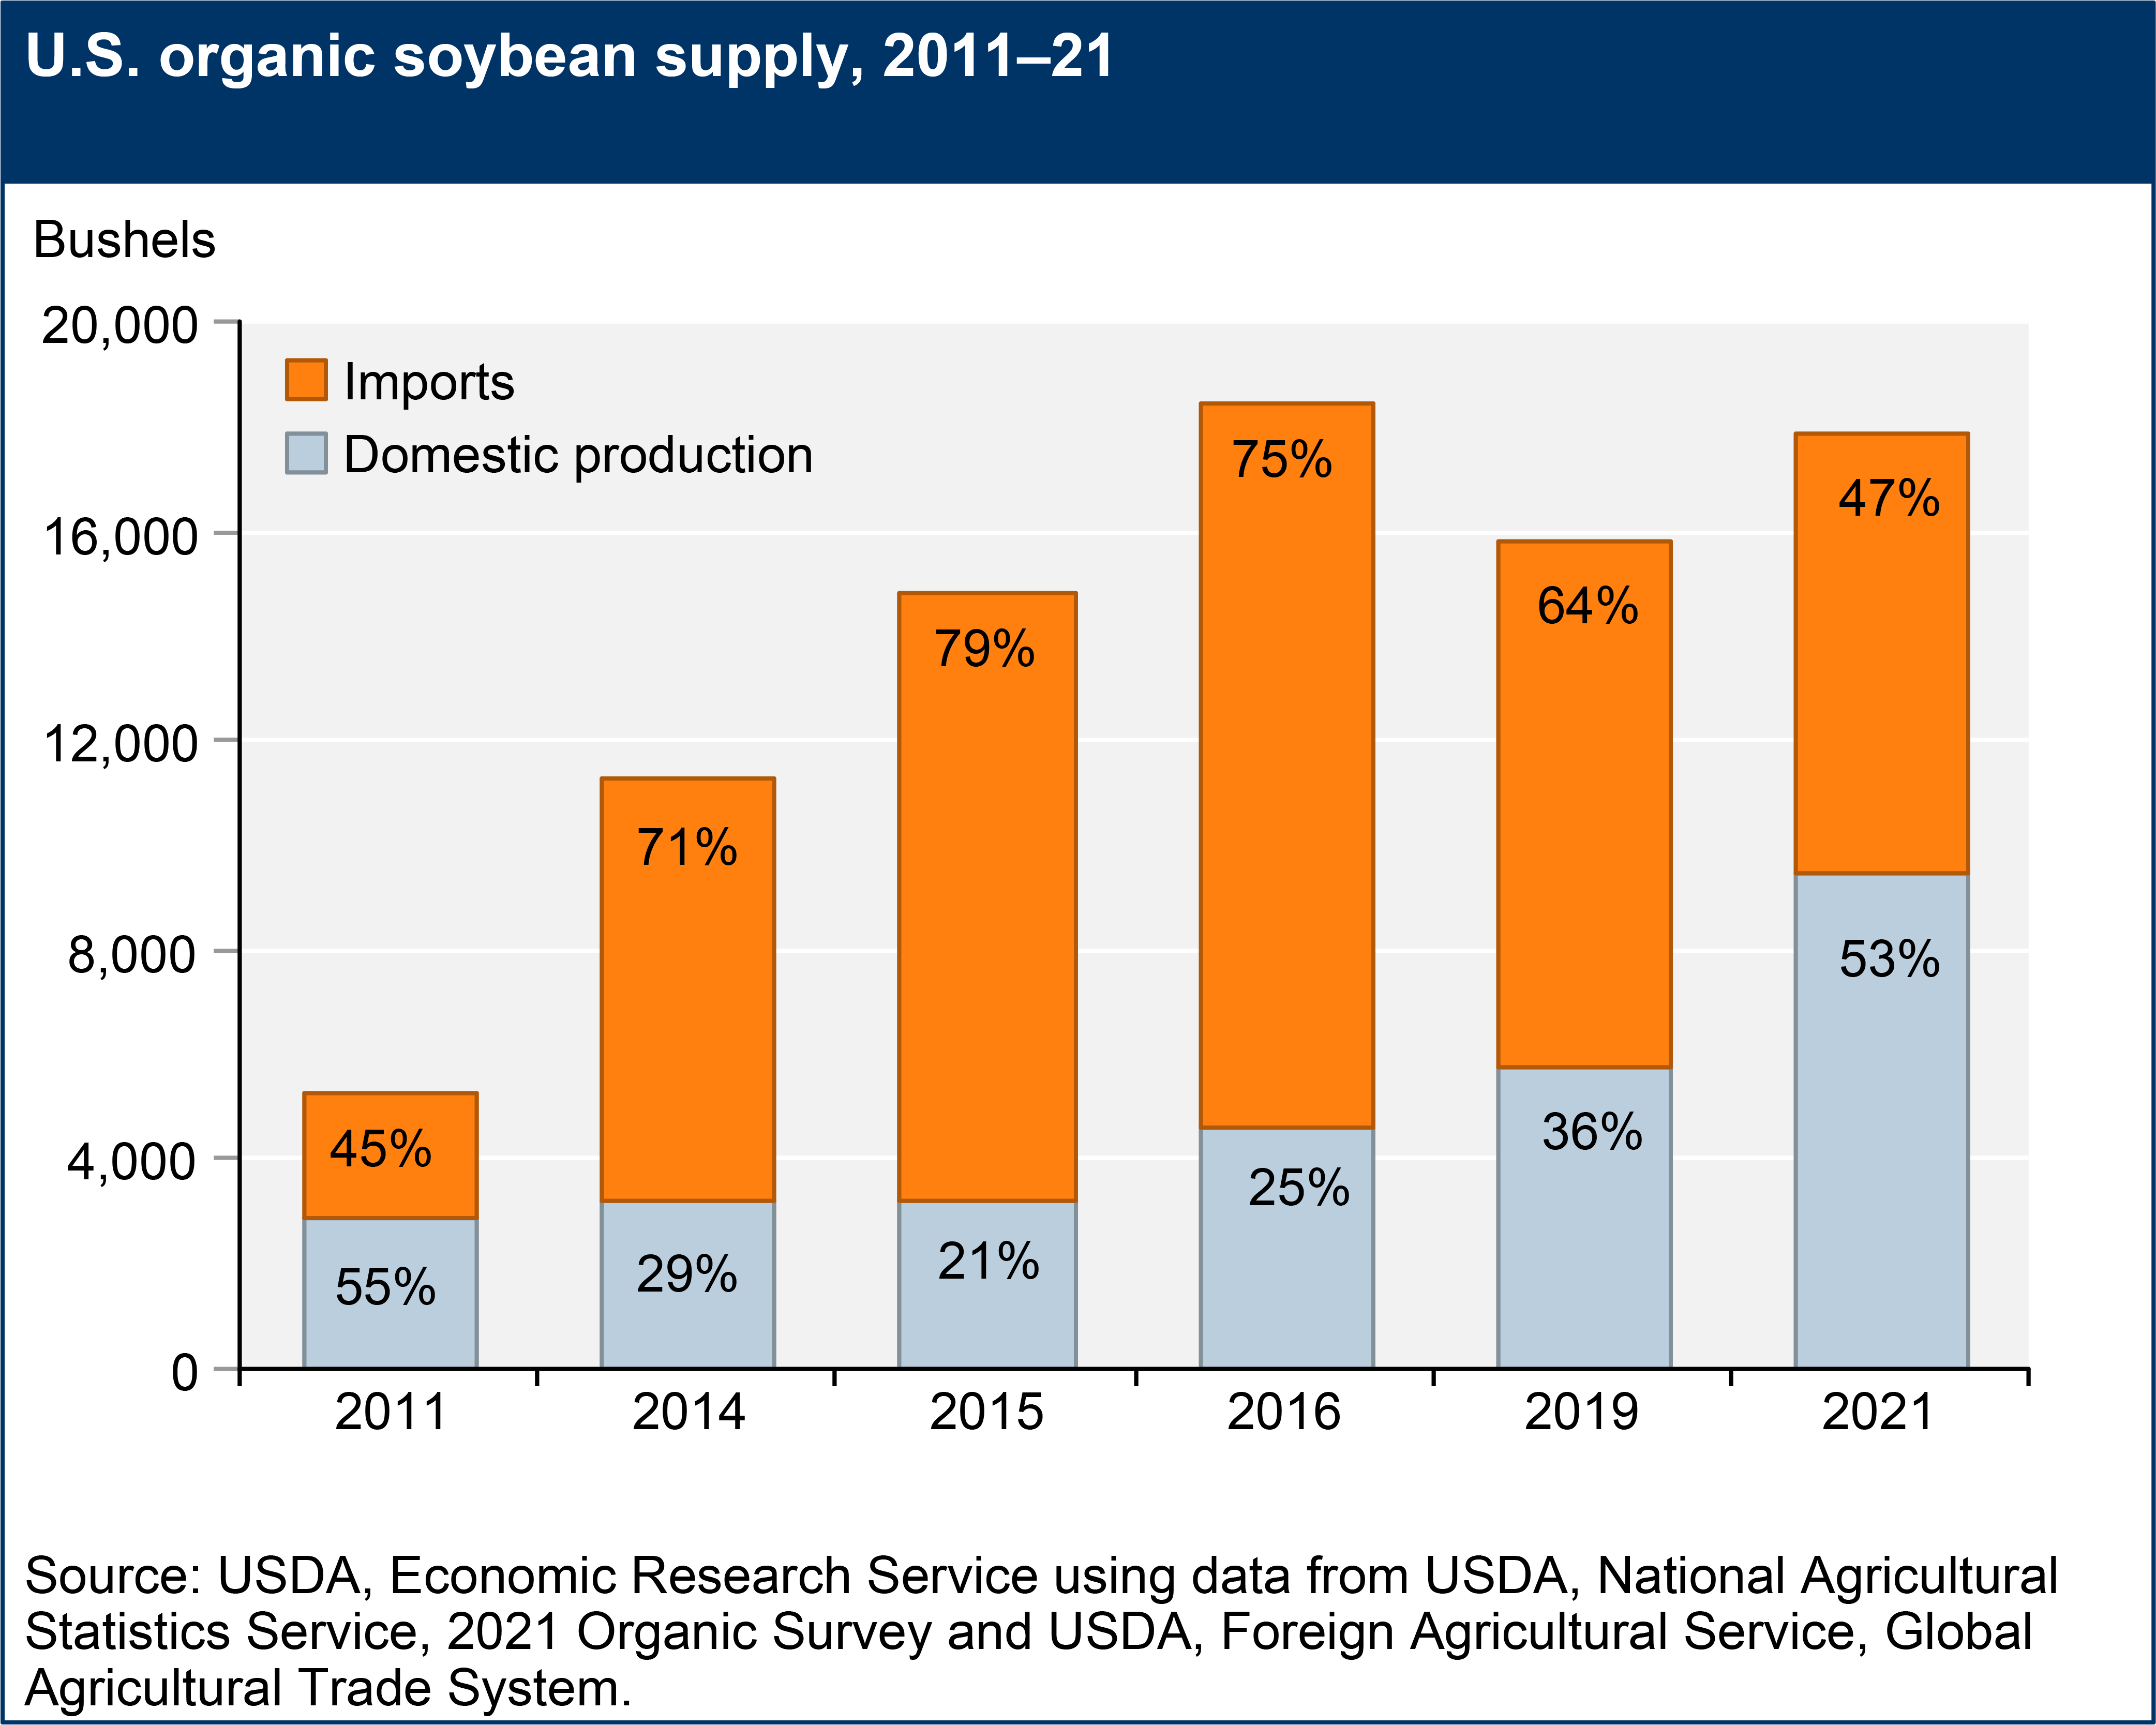
Errata: On January 23, 2025, ERS corrected the y-axis label of the U.S. organic soybean supply, 2011–21 figure to include the word 'thousands.' No other text on the topic page was affected.
Consumer demand for organically produced goods has shown strong growth since the 1990s, providing market incentives for U.S. farmers across a broad range of products.
- According to USDA, National Agricultural Statistics Service surveys (2011 and 2021): Certified organic cropland acres increased by 79 percent (to 3.6 million acres), pastureland/rangeland decreased by 22 percent (to 1.3 million acres), and certified operations increased by more than 90 percent (to 17,445 farms) over the 2011–21 period.
- Conventional grocery retailers are the primary outlets for organic food sales, surpassing natural food stores in the mid-2000s. By 2020, traditional grocery stores, club stores, and supercenters accounted for 56 percent of the share of organic food sold to consumers (Organic Trade Association, 2021).
- A typical organic food consumer is difficult to pinpoint, with organic consumers coming from all types of consumer demographics.
- Organic price premiums remain high in many markets as the demand for organic products increases.
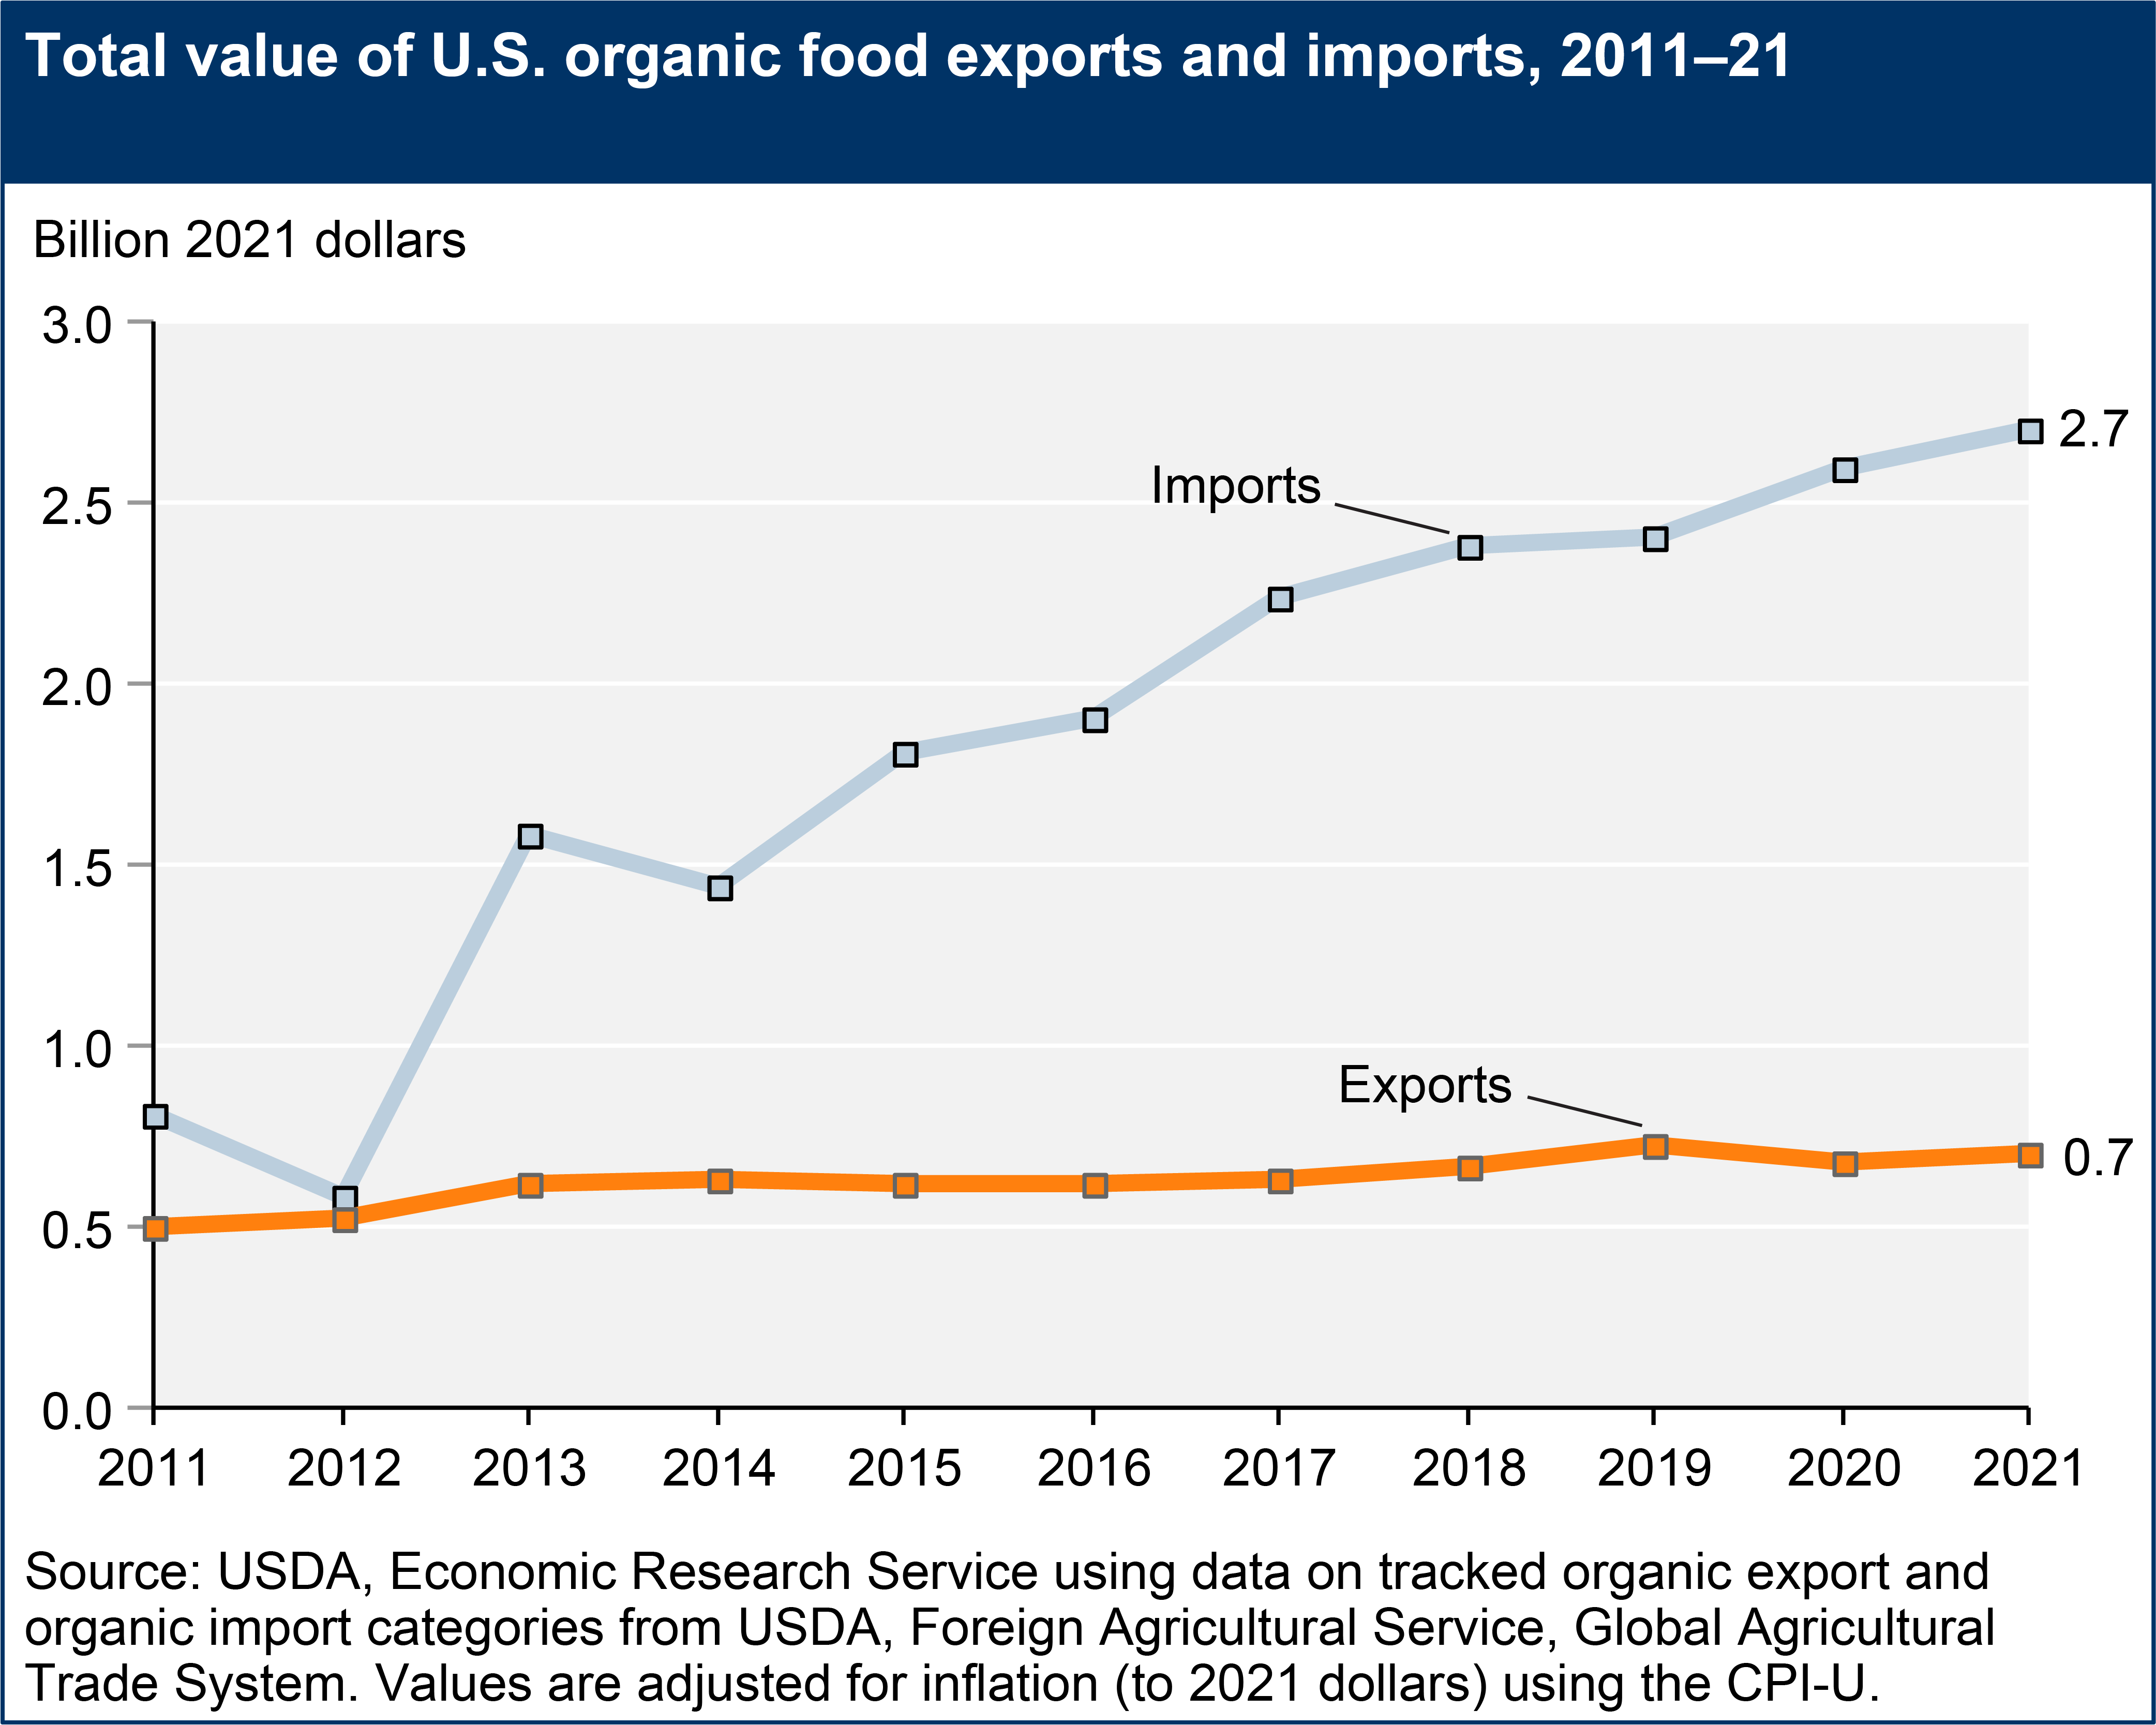
- The U.S. Department of Commerce began tracking selected organic products in 2011, with the tracked values of organic imports steadily increasing.
Farm to Plate: U.S. Organic Markets in 2021
This Amber Waves infographic shows how consumer demand for organically-produced foods has driven an expansion in U.S. organic production. In the past decade, U.S. organic retails sales increased by an average of 8 percent per year. In 2021, organic retail sales were estimated to be more than $52 billion, about 5.5 percent of all retail food sales. U.S. farms and ranches sold nearly $11 billion in organic products in 2021. Imports also are helping to meet consumer demand. Organic milk, lettuce, and blueberries are just part of the story. See Farm to Plate: U.S. Organic Markets in 2021 (Amber Waves infographic, December 2023).
Sales Increase in All Organic Food Categories
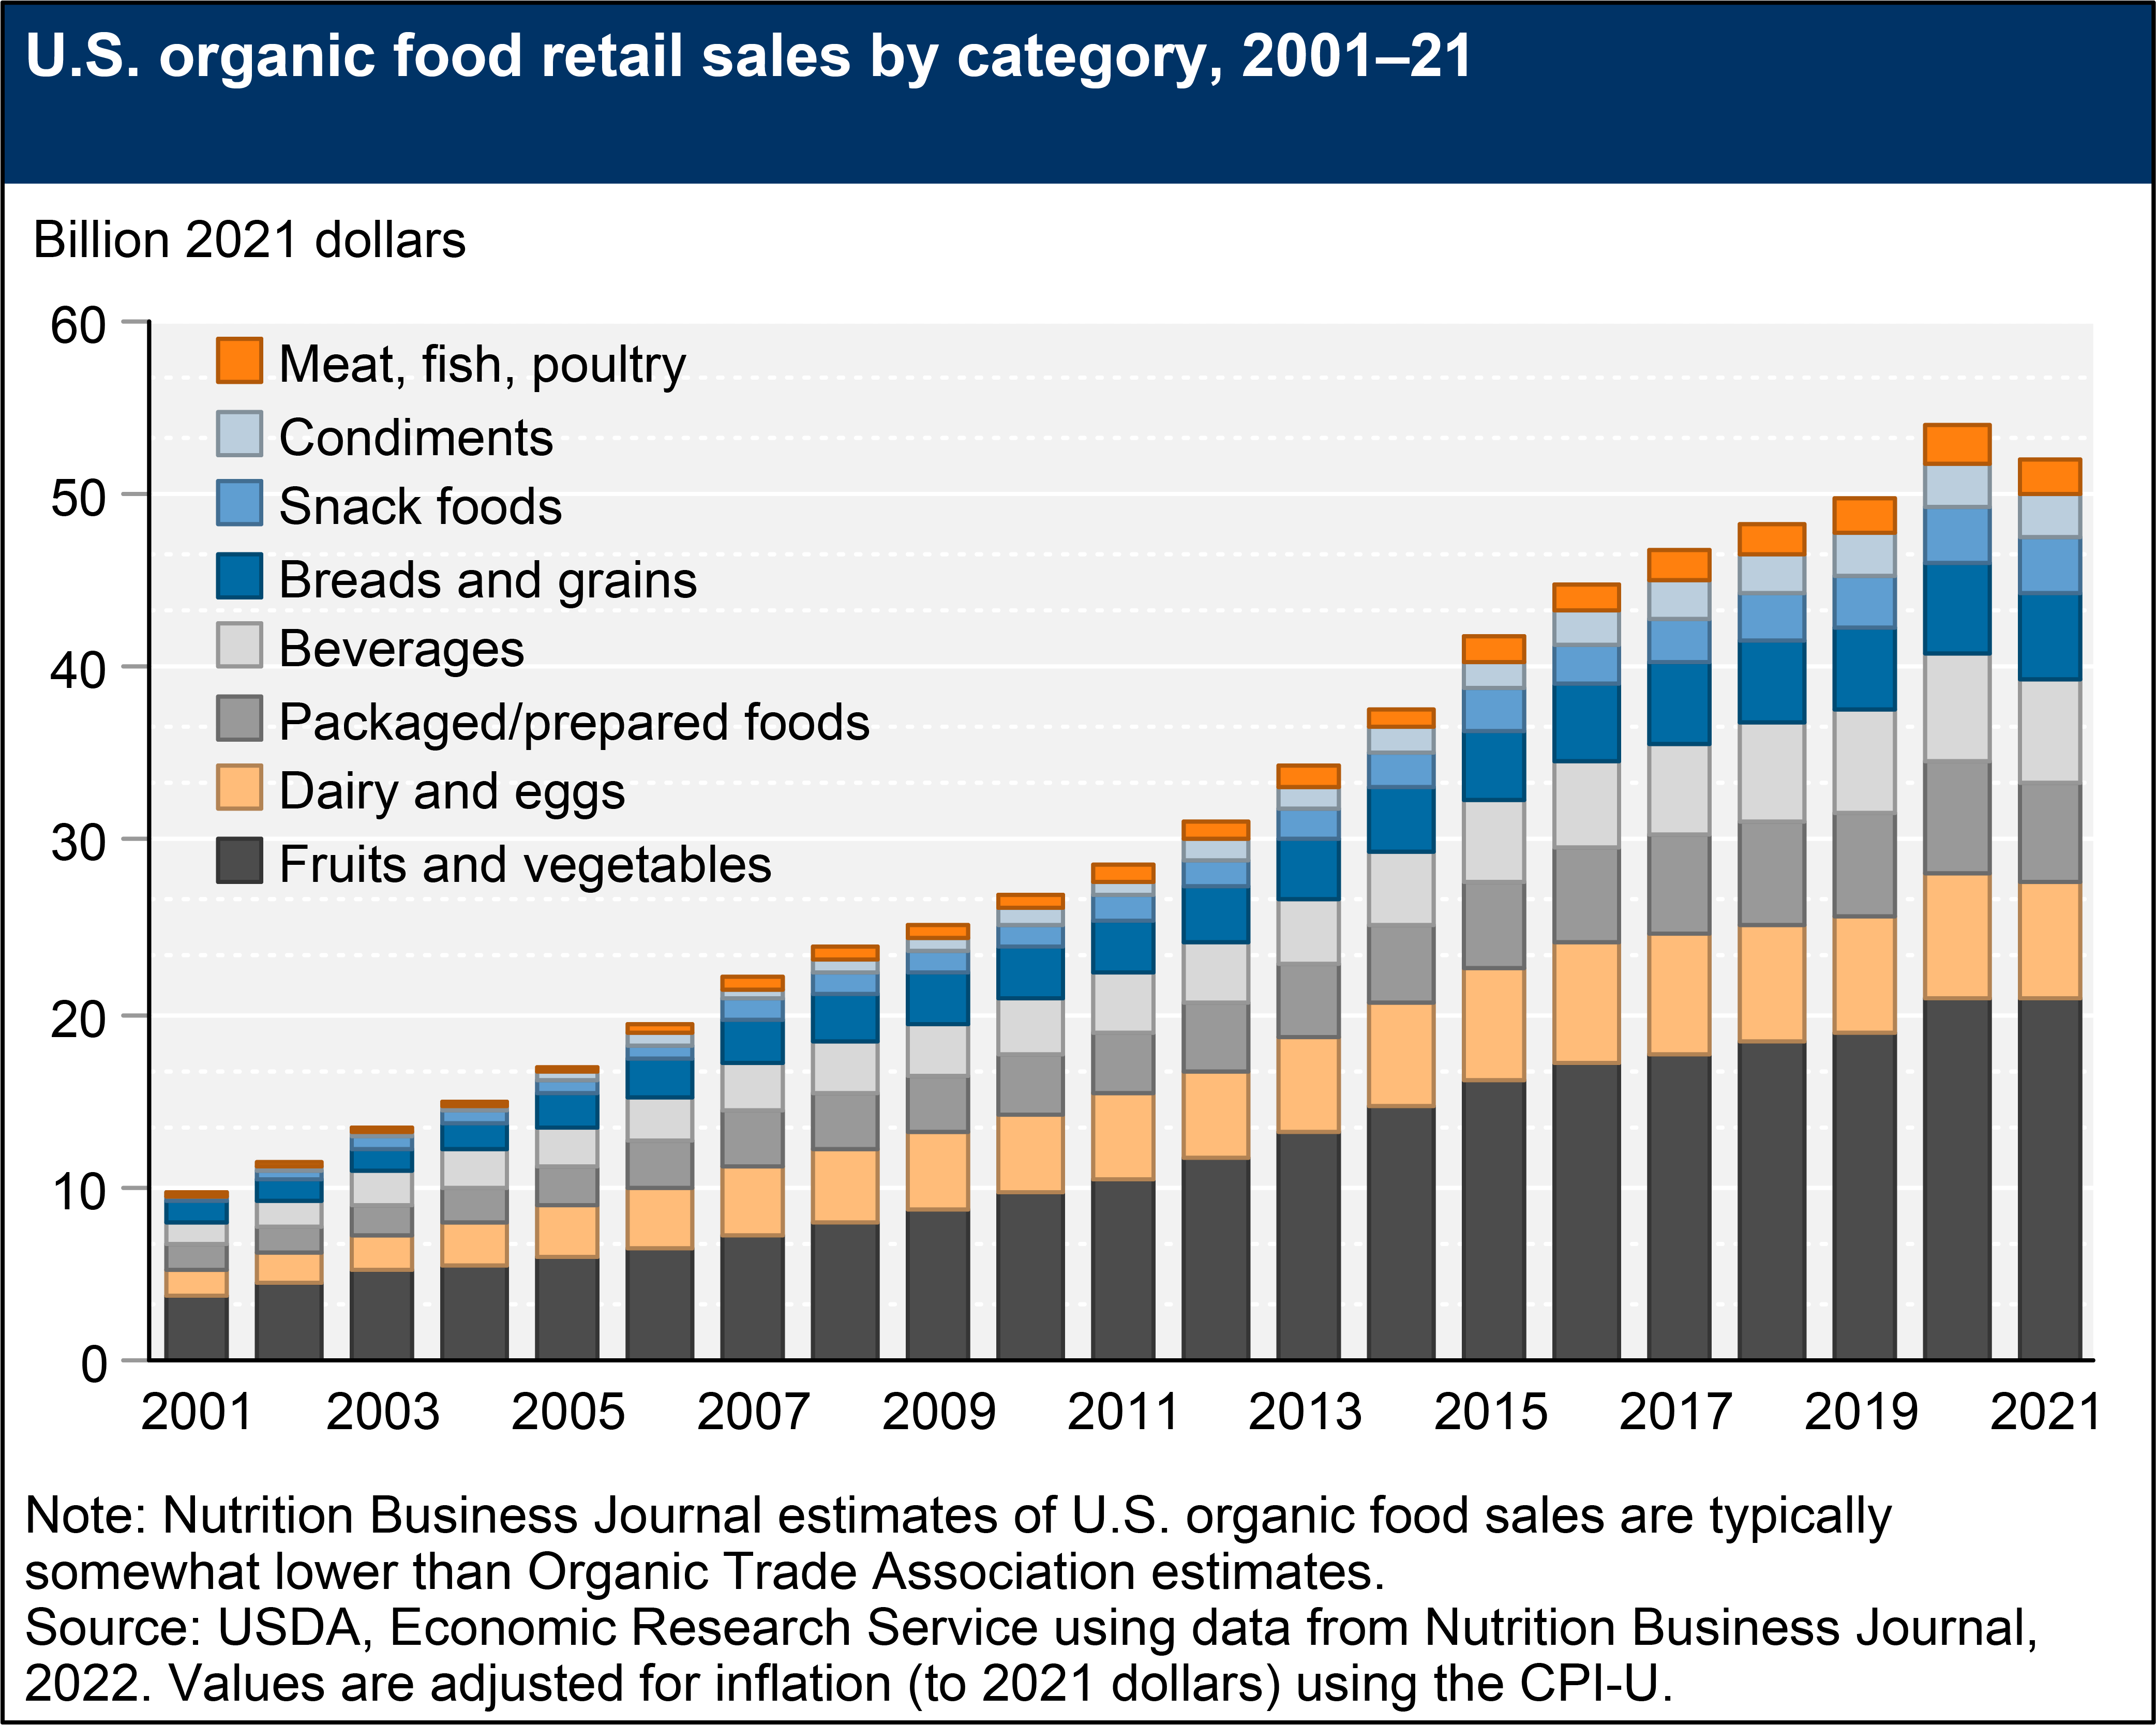
USDA does not have official statistics on U.S. organic retail sales, but information is available from industry sources. U.S. sales of organic food products were an estimated $26.9 billion in 2010 (inflation adjusted to 2021 dollars) and reached $52.0 billion in 2021, according to the Nutrition Business Journal (NBJ, 2022).
Sales of fresh fruits and vegetables have been the top category of organically-grown food since the organic food industry started retailing products. Retail sales of organic fresh fruits and vegetables were an estimated $19.2 billion in 2021 and have steadily trended upward for the past two decades (NBJ, 2022). According to the Nutrition Business Journal, produce accounted for 40 percent of U.S. organic food sales in 2021—followed by dairy and eggs (13 percent), beverages (12 percent), packaged/prepared foods (11 percent), bread/grains (9 percent), snack foods (6 percent), condiments (5 percent), and meat/fish/poultry (4 percent).
Download chart image | Chart data
According to USDA, National Agricultural Statistics Service (NASS) surveys, organic milk production increased by 1 percent from 2019 to 2021 (to 5.2 billion pounds), with the market share of organic fluid milk declining since 2016 (Information Research, Inc., 2021). Organic soymilk is the most-sold organic plant-based milk, followed by organic almond milk (Information Research, Inc., 2021). While almond milk rose in popularity in the early 2010s, organic almond milk entered the market in 2014, as almond producers transitioned into an organic production system.
According to the Organic Trade Association, 88 percent of organic sales occur through conventional and natural food supermarkets and chains. The remainder of sales occur through farmers markets, Community Supported Agriculture (CSAs), other direct-to-consumer sales, and internet sales. The share of organic food sold to consumers via the internet has grown from 2 percent in 2012 to 6 percent in 2020 (Organic Trade Association, 2021).
Compared to conventional growers, organic growers are more likely to sell their products through direct markets—such as farmers markets, CSAs, or mail orders. According to the 2017 U.S. Census of Agriculture, direct-to-consumers sales made up less than 1 percent of the total value of food sold. In contrast, more than 6 percent of the value of organic food sales came from direct-to-consumer systems, with 18 percent of certified organic farms selling at least a portion of their products directly to consumers.
Prices of Organic Products Remain Higher Than Conventional Counterparts
Over the last decade, USDA's Agricultural Marketing Service (AMS) has expanded wholesale and shipping point price reporting for organic fruits and vegetables and added new price reports on organic grains, poultry and eggs, and sales volume for milk. Prices for organic products continue to be higher than for their conventional counterparts.
- AMS Market News publishes Terminal Market and Shipping Point . Terminal (wholesale) market prices represent Free on Board prices received by wholesalers. Shipping point data cover major fruit and vegetable growing areas, provide movement data via rail and truck shipment domestically and from Mexico, and represent open market sales by first handlers.
- AMS began publishing the Annual Organic Cotton Market Report in 2010, which reports organic cotton prices for the marketing year.
- AMS Market News began reporting organic poultry prices in the weekly Organic Poultry and Egg Report in January 2004. The report tracks prices paid to poultry or egg companies by the first receiver (such as a retailer, distributor, or manufacturer).
- In January 2006, AMS began reporting sales of organic fluid milk products (in volume) in the Monthly Milk Marketing Order Report.
- In January 2007, AMS began biweekly regional price reporting on organic grains and now publishes a single national grain and feedstuffs report available through the National Organic Grain and Feedstuffs Report.
At the retail level, organic products typically receive a price premium over non-organic products. An ERS study analyzed organic retail price premiums for 18 products from 2004 to 2010 and found the premium to be more than 20 percent for 17 products. The study found that premiums fluctuated year to year without a clear trend—except for spinach, canned beans, and coffee—which showed a steady decrease in the premium, and yogurt, which showed a steady increase from 2004 to 2010. Sales for organic products with lower premiums (such as spinach, granola, and carrots) saw larger increases in market share. See the ERS report, Changes in Retail Organic Price Premiums from 2004 to 2010, for more information.
Production Costs are Higher for Organic Relative to Conventional Products
On average, U.S. organic farms have higher production costs than conventional farms, although organic price premiums over conventional products at the farm and retail level may give farmers the opportunity to recover the elevated cost of production of farming organically.
Through analysis of USDA’s Agricultural Resource Management Survey (ARMS) data, ERS compared the costs of production and returns for organic and conventional production in major crop/livestock sectors, and analyzed other economic characteristics of organic agriculture.
See these ERS reports for more information on organic versus conventional production costs and returns:
- U.S. Certified Organic Dairy Production: Three Decades of Growth
- Sources, Trends, and Drivers of U.S. Dairy Productivity and Efficiency
- The Profit Potential of Certified Organic Field Crop Production
- Characteristics of Conventional and Organic Apple Production in the United States
Organic Consumers Are Increasingly Mainstream
There are numerous studies on the buying habits and demographics of consumers of organic foods. Results have varied depending on the type of survey, sample size, and geographic coverage. However, studies show that organic food consumers include all types of consumer demographics. A study from the Organic Trade Association (using data from a large, nationally representative sample of U.S. households) found that more than 80 percent of U.S. households purchased organic food in 2016. A consistent finding across studies is that millennials (born between 1981 and 1986/87) are more likely to purchase organic food than older generations.
Consumers may prefer organically produced food because of their views regarding health, the environment, and animal welfare. Organic consumers show a willingness to pay the higher prices established in the marketplace.
Organic Trade Is an Important Outlet for Organic Agriculture
Trade plays an important role in meeting consumer demands for organic products, domestically and abroad. The U.S. Department of Commerce began adding codes for selected organic products to the U.S. trade code system in 2011. The value of organic imports has increased—in part because more products are being tracked—but also because of increases in some of the highest-value imports, such as fresh cultivated blueberries and squash.
Download chart image | Chart data
Importers of organic products must either be USDA certified or belong to a trading partner with an organic recognition agreement with the United States, which allows foreign Governments to accredit certifying agents to USDA organic standards. The United States has bilateral equivalency arrangements with Canada, the European Union, Japan, Korea, Switzerland, Taiwan, and the United Kingdom. In 2021, USDA announced the termination of its recognition agreement with India, determining India’s organic control system insufficient to protect the integrity of the USDA organic seal.
For some organic agricultural categories, demand in the United States has increased at a faster pace than the domestic supply. For example, the United States relies on imports of organic grains and oilseed crops to meet demand from the organic dairy and livestock sectors. Approximately 75 percent of the supply of organic soybeans were imported in 2016 and 64 percent in 2019. See Feed Outlook: August 2021 for more information. In 2021, imports of organic soybeans decreased by 17 percent and domestic production increased by 65 percent (to 9.5 million bushels) relative to 2019. The shift shows that for the first time since domestic production numbers were available in 2011, the United States produced a larger share of the supply of soybeans for beans than it imported.