ERS Charts of Note
Subscribe to get highlights from our current and past research, Monday through Friday, or see our privacy policy.
Get the latest charts via email, or on our mobile app for  and
and 
Thursday, April 25, 2024
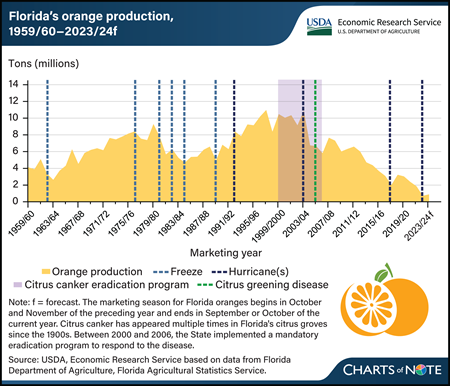
Florida’s citrus industry has long been susceptible to freezes, hurricanes, and disease. A series of devastating freezes in the 1970s and 1980s caused production to shift to more southern regions of the State. Then after near-record output in the 2003/04 season, subsequent events decreased Florida’s orange output at an average rate of 6 percent a year. Between 2004 and 2005, 4 hurricanes reduced the size of the orange crop and further spread citrus canker, a bacterial disease damaging to tree health and fruit quality, to previously unaffected areas. The Florida citrus industry faced an additional challenge in 2005, when citrus greening disease, a bacterial disease deadly to citrus trees, was first detected in its commercial groves. Citrus greening disease leads to premature fruit drop, unripe fruit, and eventual tree death. With no known cure, citrus growers use a variety of management strategies to protect young trees, increase tree immune response, sustain grove health, and improve fruit marketability. While these management strategies can partially offset yield losses, they increase the costs of production. Hurricanes in 2017 and 2022 dealt further damage to Florida’s citrus industry. Since 2003/04, bearing acreage of Florida’s orange trees has declined at an average rate of 3 percent per year. In April 2024, USDA forecast Florida’s orange 2023/24 production at 846,000 tons, 19 percent higher than the previous year but the second-lowest harvest in nearly 90 years. This chart updates information in the USDA, Economic Research Service Fruit and Tree Nuts Outlook, published in March 2023.
Wednesday, April 17, 2024
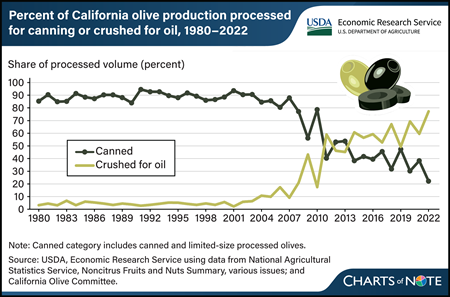
The turn of the century marked a shift in California’s olive industry. Historically, the State’s olive industry—which accounts for about 84 percent of olive acreage in the United States—was synonymous with canned olive production. Between 1980 and 2000, about 90 percent of California’s production was used for canned olives, most of which were of the black-ripe variety. California black-ripe olives are harvested green, before full maturity, and turn black from oxidation during processing. These shiny black-ripe olives are commonly sold as whole pitted or sliced canned products at retail or food service, where they often are used as pizza or salad toppings. Since the mid-2000s, the share of California’s olive production used to make olive oil has grown rapidly, from 10 percent in 2005 to more than 75 percent in 2022. This shift has been driven by increases in labor costs and import competition, as well as technological advancements that have made harvesting new olive oil-type cultivars comparatively quicker and less expensive. California olive oil production rose from 2 million pounds in 2006 to an average of 21 million pounds in 2021–23. Despite this increase in U.S. olive oil production, imports still supply more than 98 percent of the domestic consumption. This chart is based on the USDA, Economic Research Service Fruit and Tree Nuts Outlook Report, released March 2024.
Monday, February 5, 2024
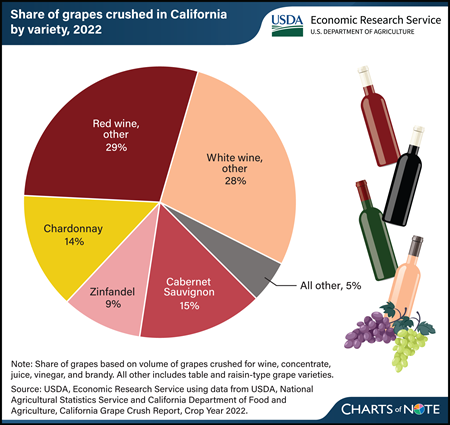
Red or white wine? Red wine varieties accounted for the largest share of grapes crushed in 2022 in California, the top wine grape-producing State. California growers raise more than 100 different varieties of wine grapes, according to the annual California Grape Crush Report. In 2022, Cabernet Sauvignon, a red varietal, accounted for California’s largest share of grapes crushed at 15 percent. White varietal, Chardonnay, came in second among wine grape varieties at 14 percent and was the top white wine variety by volume crushed. Other table grape and raisin-type grape varieties collectively represented 5 percent of the 3.7 million tons of grapes crushed for wine, concentrate, juice, vinegar, and brandy. California producers grow about 94 percent of the total U.S. grape crop, with nearly 70 percent of the State’s grape acreage dedicated to wine-type grapes. In the past few seasons, the value of the wine grape crop, both red and white, in California exceeded $3.6 billion. This chart is based on the USDA, Economic Research Service Fruit and Tree Nuts Outlook Report, released September 2023.
Tuesday, January 9, 2024
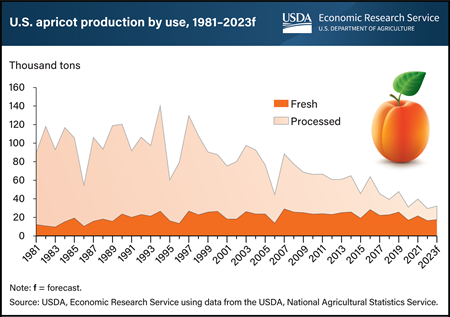
How do you like your apricots? Apricots, a stone fruit like peaches, plums, and nectarines, are typically either processed by canning, freezing, or drying, or sold as fresh, whole apricots. Regardless of how you like apricots, their production has been decreasing since the 1990s in response to falling U.S. consumption, especially for processed apricots. Commercial production is concentrated on the West Coast, with California representing 90 percent of apricot production in 2023. The U.S. apricot industry has experienced a long-term downward trend in bearing acreage, falling 62 percent over the past 20 years. Growing competition from imports of processed apricot products and a general increase in consumption for all fresh fruit have encouraged growers to divert more of their acreage to higher valued commodities, resulting in fewer bearing acres of apricots and shifts in use. The downward trend in production has coincided with a decrease in the share of apricots used in the processing market. During the first three seasons of this decade (2020–22), processed utilization has averaged 45 percent—down from 63 percent during the early 2010s and 89 percent in the early 1980s. This reflected both small gains in fresh market use and a marked downward trend in processing uses (particularly canned and frozen). Until the 2020s, the volume used as fresh apricots had been trending higher each decade—roughly pacing population growth. This chart first appeared in the September 2023 Fruit and Tree Nuts Outlook, published by USDA, Economic Research Service.
Wednesday, November 22, 2023
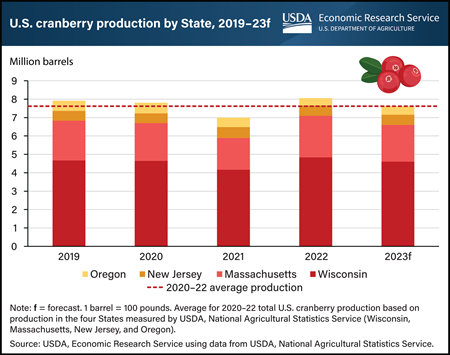
U.S. cranberries are harvested in autumn, just in time for the holiday season. The 2023 U.S. cranberry crop is forecast to be 7.62 million barrels, down 5.4 percent from the previous year, but equal to the 2020–22 average. The top-producing State, Wisconsin, typically harvests around 60 percent of the annual U.S. cranberry crop. In 2023, Wisconsin cranberry production is forecast to be 4.6 million barrels, down 5 percent from 2022. In the most recent growing season, Wisconsin experienced challenging weather, from record snowfall in April to statewide drought in July. Similarly, Massachusetts—the second-largest producing State—experienced weather-related challenges including a cold, frosty spring and excessive precipitation during the summer bloom. Consequently, production for Massachusetts, which typically accounts for around one quarter of the U.S. cranberry crop, is forecast to decline 11.5 percent from last year to 2 million barrels. Similarly, New Jersey’s 2023 cranberry forecast is expected to be about 550,000 barrels, a slight 2-percent decrease from the 2020–22 average on the basis of atypically hot summer temperatures in the State. Unlike the top three States, which are set to experience production declines in 2023, the fourth-largest cranberry producing State, Oregon, is forecast to see production rise by 17.5 percent from 2022 to 470,000 barrels. This chart is based on the USDA, Economic Research Service Fruit and Tree Nuts Outlook Report, released September 2023.
Tuesday, November 14, 2023
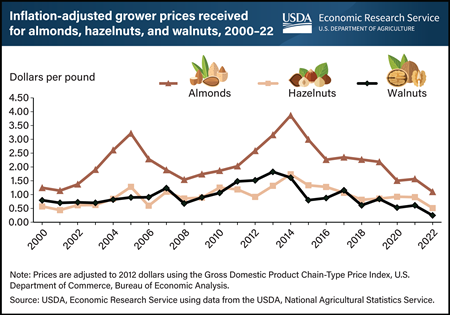
In 2022, tree nut prices fell to their lowest levels in at least two decades. Prices after adjusting for inflation, called real prices, were $1.10 per pound for almonds, $0.51 for hazelnuts, and $0.25 for walnuts. The last time real almond and hazelnut prices were this low was at the turn of the 21st century. Walnut (real) prices are at an all-time low, according to data from the USDA, Economic Research Service. Prior to 2020, the lowest real walnut price recorded was $0.58 per pound in 1999. In 2022, walnut prices were less than half of the previous record low and 14 percent of the high observed in 2013 ($1.82 per pound). Low prices have affected walnut producers’ production decisions. In September 2023, USDA’s National Agricultural Statistics Service forecast that 2023 would be the first year since 1999 that walnut-bearing acreage decreased. Acreage in California, the country’s leading walnut producer, was estimated to have dropped from 400,000 acres in 2022 to 385,000 acres in 2023 and was revised further downward to 375,000 acres in October 2023. Producers have not reduced bearing acreage for almonds or hazelnuts, but prices have decreased since 2014. The decision to reduce acreage stems not only from grower prices but also from a series of conditions growers face that include weather, prices of inputs, and competition from other exporting countries. This chart was drawn from the USDA, Economic Research Service Fruit and Tree Nuts Outlook Report, released September 2023.
Tuesday, October 24, 2023
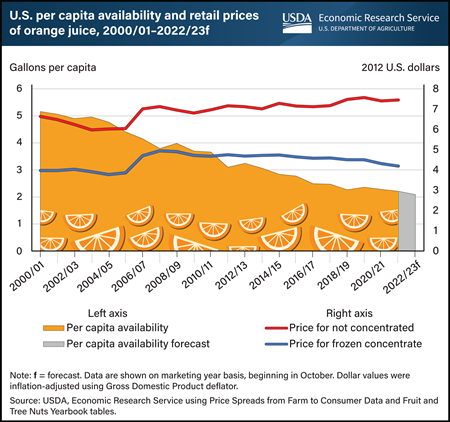
Orange juice, once a staple beverage in many U.S. households, has experienced a steady decline in consumption over the last two decades. While waning consumer demand has played a role, decreased domestic orange production has also negatively impacted per capita availability, a proxy measure for consumption. Orange juice imports from Brazil and Mexico have tempered some of this decline, however, availability of orange juice has fallen from about 5 gallons a person in the 2000/01 marketing year to a forecast of 2 gallons per person in 2022/23. Most oranges grown for the processing/juice market in the United States are harvested in Florida. In recent years, Florida’s citrus crop has suffered from disease and extreme weather events, resulting in smaller orange harvests. Reduced supply has contributed to generally higher orange juice prices. However, adjusted for inflation, prices for frozen concentrated orange juice and not from concentrate (the two main categories) increased at comparatively modest rates between 2000/01 and 2021/22. The price of frozen concentrated orange juice rose by 5 percent over 20 years, while orange juice not from concentrate rose by 12 percent over the same period. The modest increase in the real price highlights the impact of declining demand, somewhat muting the price effect associated with lower supply. This chart is based on the USDA, Economic Research Service (ERS) Fruit and Tree Nuts Outlook Report, released September 2023, and data from the ERS Fruit and Tree Nuts Yearbook and Price Spreads from Farm to Consumer.
Tuesday, September 26, 2023
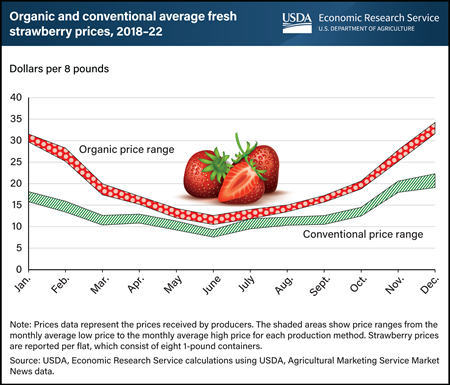
Fresh strawberry prices tend to exhibit strong seasonal trends in part because of their relatively short shelf life. Even being refrigerated immediately after harvest, fresh-picked strawberries last about 1 to 2 weeks, reducing the ability to store the crop and maintain a consistent supply. In the United States, grower prices for fresh organic strawberries move in tandem with conventional strawberry prices throughout the year while also typically running 40 to 50 percent higher than conventional prices—this difference is known as a “price premium.” In late fall and throughout winter, supply wanes even though demand remains robust. During this period, grower (or farm-gate) price premiums for organic strawberries rise above typical levels. From 2018–22, the highest average price premium was in January, when organic strawberry prices were 74 to 88 percent higher than conventional strawberries. Price premiums in July averaged 18 to 24 percent. Organic strawberry production has increased faster than conventional production. Since 2008, domestic organic strawberry acreage has tripled in California, which provides about 75 percent of U.S. organic strawberry production. This chart updates one that appeared in the USDA, Economic Research Service report The Changing Landscape of U.S. Strawberry and Blueberry Markets: Production, Trade, and Challenges from 2000 to 2020, published in September 2023.
Tuesday, August 22, 2023
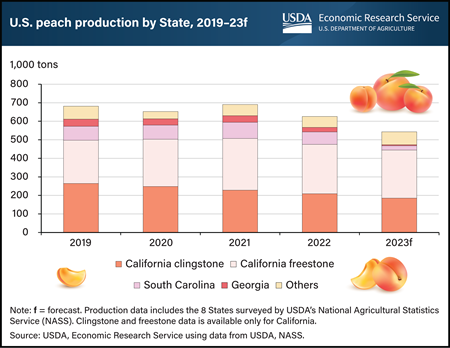
While Georgia is on many consumers’ minds when it comes to fresh, juicy peaches, California is by far the largest peach-producing State in the United States. In 2022, California’s harvest yielded 475,000 tons of fruit, with South Carolina a distant second at 67,400 tons, and Georgia in third place with production at 24,800 tons. California has been the long-time leading producer both for freestone peaches for the fresh market and clingstone peaches for processing. However, the State’s peach production has been trending lower for almost two decades, contributing to an overall drop in U.S. peach production. Total production in the United States in 2022 was estimated at 625,680 tons, 8 percent smaller than the crop in 2019. In 2022, California’s peach harvest was about 5 percent smaller than in 2019 and nearly 27 percent lower than 10 years earlier. Latest reports from USDA’s National Agricultural Statistics Service forecast 2023 peach production to be 13 percent lower than in 2022. Georgia and South Carolina peaches were beset with challenging weather conditions that included unseasonably warm weather in late winter followed by late spring cold snaps. This chart first appeared in the USDA, Economic Research Service Fruit and Tree Nut Outlook, published in September 2022, and has been updated with recent data.
Thursday, August 3, 2023
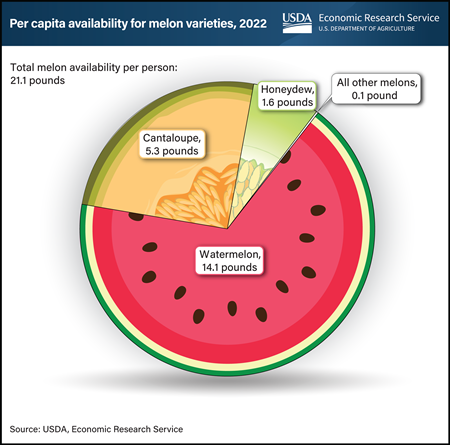
If you are reaching for a slice of melon to cool off from the summer heat, chances are watermelon is your first choice. Since 2000, watermelon has gained a larger share of U.S. melon availability (calculated by adding production and import volumes and then subtracting exports). In 2022, watermelon accounted for more than half of U.S. melon availability, double the share of every other melon variety combined. An estimated 21.1 pounds of melons were available in 2022 for each U.S. consumer to eat, with watermelon accounting for 14.1 pounds, cantaloupe for 5.3 pounds, honeydew for 1.6 pounds, and all other melons making up the remaining slice. Increases in watermelon availability, by both volume and share, correspond with overall growth in melon imports, which first served to bridge supply gaps during nongrowing seasons in the United States. Most of the melons consumed in the United States are grown domestically, but imports are capturing a growing share of the fresh melon market. Since the 1980s, imports have increased from an average share of less than 10 percent to almost 40 percent over the last 5 years. U.S. imports of watermelons now come mostly from Mexico, with increasing volumes from Guatemala and Honduras. Cantaloupe and honeydew imports ship mostly from Guatemala and Honduras, with lower volumes from Mexico. This chart first appeared in the USDA, Economic Research Service’s Fruit and Tree Nuts Outlook, published in March 2023.
Monday, July 31, 2023
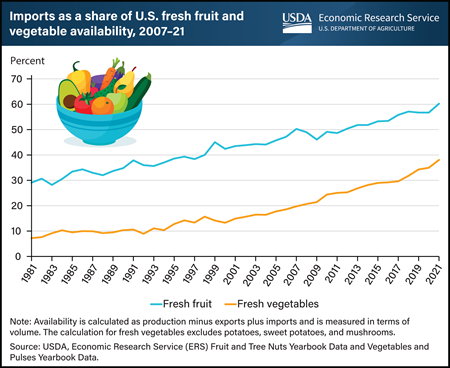
Imports play a vital and increasingly important role in ensuring that fresh fruit and vegetables are available year-round in the United States. Since the 2008 completion of the transition to tariff- and quota-free trade among Mexico, Canada, and the United States under the North American Free Trade Agreement (NAFTA), U.S. fresh fruit and vegetable imports have increased with few interruptions. Between 2007 and 2021, the percent of U.S. fresh fruit and vegetable availability supplied by imports grew from 50 to 60 percent for fresh fruit and from 20 to 38 percent for fresh vegetables (excluding potatoes, sweet potatoes, and mushrooms). The import share increased by more than 20 percentage points during this period for 10 crops: asparagus, avocados, bell peppers, blueberries, broccoli, cauliflower, cucumbers, raspberries, snap beans, and tomatoes. The United States-Mexico-Canada Agreement (USMCA), implemented on July 1, 2020, continues NAFTA’s market access provisions for fruit and vegetables. In 2022, Mexico and Canada supplied 51 percent and 2 percent, respectively, of U.S. fresh fruit imports, and 69 percent and 20 percent, respectively, of U.S. fresh vegetable imports in terms of value. This chart is drawn using data from the USDA, Economic Research Service (ERS) data products Fruit and Tree Nuts Yearbook Data and Vegetables and Pulses Yearbook Data. Also refer to the ERS report, Changes in U.S. Agricultural Imports from Latin America and the Caribbean, published in July 2023, and ERS’s Amber Waves feature, U.S. Fresh Vegetable Imports From Mexico and Canada Continue To Surge, published in November 2021.
Thursday, May 11, 2023
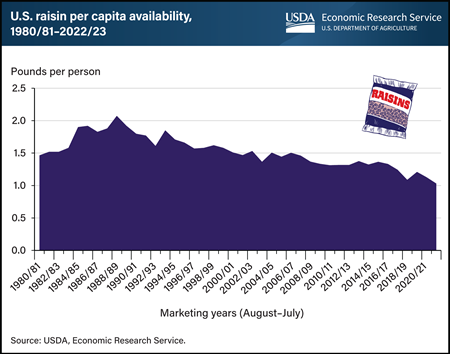
Consumers are eating fewer raisins, based on U.S. per capita availability data. In the past 10 years, acreage planted to raisin-type grapes declined more than 33 percent in California, which produces almost all U.S. raisins. Average per capita availability (a proxy for consumption) of dried raisins fell 15 percent in that time, according to USDA, Economic Research Service (ERS) estimates. This trajectory continues the gradual decline observed since availability peaked at more than 2 pounds per person in the late 1980s to a current low of 1.1 pounds. Some of the reasons behind the decline may include greater year-round availability of fresh fruit and competition from other dried fruit, such as cranberries, cherries, and blueberries. Pressure faced by U.S. raisin growers is not limited to declining per capita availability, however. Higher labor costs and lower priced exports from Turkey have also challenged the U.S. raisin industry in recent years. Along with an overall decrease in acreage and production, the United States has reduced both total export volume and the share of domestic production going to exports. This chart is drawn from ERS’ Fruit and Tree Nuts Outlook, March 2023.
Tuesday, March 14, 2023
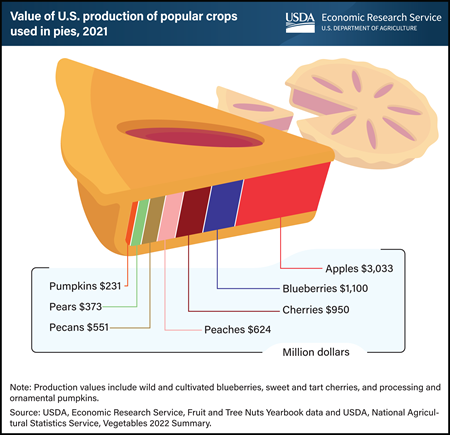
March 14 is known to many as Pi Day. The date resembles the mathematical constant π, roughly equal to 3.14, and for that reason, many celebrate the day by enjoying their favorite type of pie. In 2021, the United States grew $6.9 billion worth of seven popular fruits, vegetables, and tree nuts often used as the main ingredient in pie making. The value of production of these seven commodities in 2021, as measured by U.S. cash receipts, was the highest for apples, which are produced abundantly in the United States both in terms of volume and production value. The U.S. apple crop exceeded $3.03 billion in 2021, whereas production of blueberries reached $1.1 billion. Cash receipts for other fruit pie ingredients, cherries and peaches, were valued at $950 million and $624 million, respectively. Pecans, a tree nut, were valued at $551 million in terms of U.S. cash receipts. The pear crop of 2021 was valued at $373 million, while production of pumpkins, the fall icon and mainstay of the holiday table, was valued at $231 million. This chart is drawn from USDA, Economic Research Service’s Fruit and Tree Nuts and Vegetables and Pulses Yearbook Tables.
Wednesday, December 7, 2022
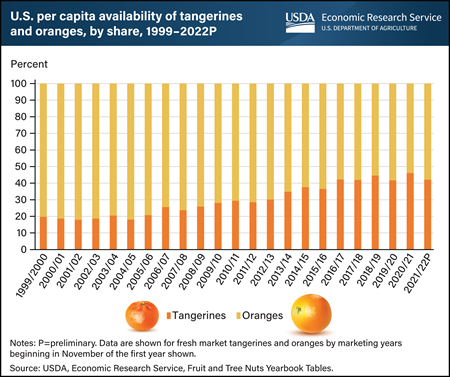
Fresh oranges have long been a favorite fruit of U.S. consumers. They currently rank fourth among fresh fruit in per capita availability (a proxy for consumption) after bananas, melons, and apples. Nonetheless, the U.S. palate has changed over the last several decades. Between 2000 and 2022, domestic availability of fresh oranges fell from 11.7 pounds to 8.3 pounds per person, stabilizing over the last decade between 8 and 10 pounds depending on market conditions. At the same time, the tangerine citrus commodity group has soared in popularity, with per capita availability more than doubling between 2000 and 2022. This broad group includes tangelos, mandarins, clementines, and traditional tangerines. A comparison of per capita fresh tangerine and fresh orange availability over the last 20 years shows the share going to tangerines increasing from 20 to 40 percent. Growth of the U.S. tangerine market coincides with the launch of marketing campaigns for easy-peel seedless mandarins by some of the more prominent citrus supply companies. This chart is based on USDA, Economic Research Service (ERS) Fruit and Tree Nuts Yearbook Tables, released November 2022. The data for this chart do not account for spoilage, waste, and other losses. For data that takes these losses into account, see ERS’ Loss Adjusted Food Availability.
Monday, November 21, 2022
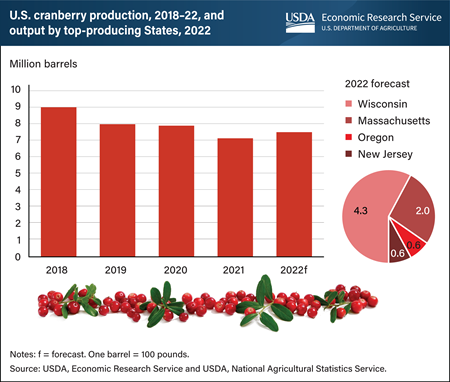
With the 2022 U.S. cranberry harvest wrapping up just in time for Thanksgiving, this year’s crop is forecast to be 5 percent larger than last year’s crop. The 2022 cranberry crop is estimated at 7.44 million barrels but is expected to be smaller than in any of the previous three years (2018–20). Cranberry production, as measured by USDA’s National Agricultural Statistics Service (NASS), comes from four States: Wisconsin, Massachusetts, Oregon, and New Jersey. In Wisconsin, the largest growing State, production is forecast at 4.3 million barrels, up 3 percent from last year. Larger crops are expected in all States but most prominently in Massachusetts, where production is forecast at 2 million barrels, an 11 percent increase from last year. According to NASS, Wisconsin and Massachusetts growers reported the crop experienced cold, wet weather and hail early in the growing season, stalling the planting season. However, warmer temperatures and better weather conditions helped cranberry plants and berries to develop. This chart is drawn from USDA, Economic Research Service’s Fruit and Tree Nuts Outlook, September 2022.
Monday, November 7, 2022
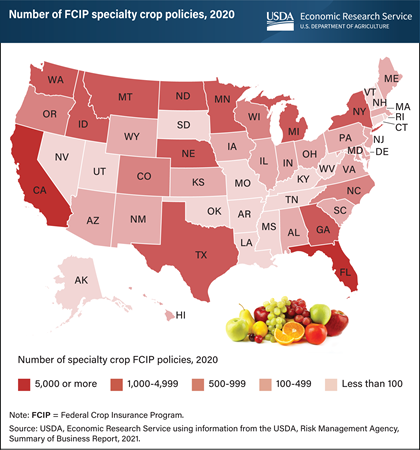
The USDA offers various risk management products to specialty crop farmers through the Federal Crop Insurance Program (FCIP). FCIP policies can mitigate risks by providing payments if insured crops experience losses caused by naturally occurring events (such as weather-related conditions) and market conditions. Specialty crops are a commodity group which includes fresh or dried fruits; tree nuts; vegetables; pulse crops such as dry beans, peas, and lentils; and horticulture nursery crops. California led the country in FCIP policies for specialty crops in 2020 (19,433), followed by Florida (5,060), Washington (4,233), North Dakota (3,860), and Minnesota (2,526). These States also produce the most fruits and vegetables (California, Florida, and Washington) and specialty field crops (North Dakota and Minnesota). California’s policies reflect the variety of specialty crops produced in the State, including almonds, grapes, oranges, walnuts, and raisins. Most North Dakota policies cover field crops—dry beans and dry peas. In 2020, specialty crops accounted for 25 percent of the value of U.S. crop production. This chart appears in the USDA, Economic Research Service bulletin Specialty Crop Participation in Federal Risk Management Programs, published in September 2022.
Tuesday, November 1, 2022
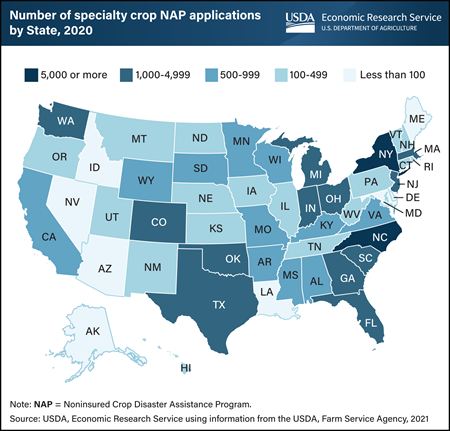
USDA operates various Federal crop insurance and disaster aid programs to help producers mitigate the risks of agricultural production such as weather, price, or pests. But when sufficient data is not available to create an actuarially sound insurance product (one in which premiums paid should approximately equal indemnity payments), then producers can apply to the USDA, Farm Service Agency’s Noninsured Crop Disaster Assistance Program (NAP). NAP covered about 115 million total acres in 2017. Specialty crops, which include fruits and vegetables, tree nuts, dried fruits, and horticulture nursery crops, are often grown in areas where there are suitable soil and weather conditions. In 2020, North Carolina and New York had the highest number of specialty crop NAP applications. Each State had more than 5,000 applications. Across the U.S., NAP applications were made for 147 different specialty crops in 2020. This chart appears in the Economic Research Service report Specialty Crop Participation in Federal Risk Management Programs, published in September 2022.
Thursday, October 20, 2022
Errata: On Oct. 25, 2022, a clarification was made for Florida's ranking in citrus production.
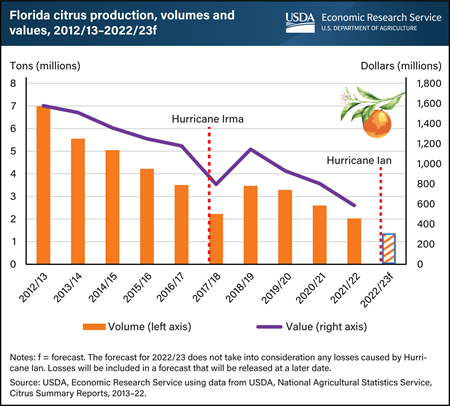
On September 28, 2022, Hurricane Ian made landfall as a category 4 hurricane on the southwest coast of Florida, the United States’ top producer of oranges. The hurricane crossed the peninsula, bringing severe winds and rainfall to some of the State’s foremost citrus-producing counties. Many of these same counties were affected by Hurricane Irma 5 years earlier. When Irma hit in September 2017, the State’s citrus production was already on a downward trajectory from diseases and other factors reducing acreage and yields. Florida’s citrus production fell by 1.3 million tons from the hurricane-free 2016/17 season, with the total value of production dropping 39 percent. On October 12, 2022, USDA’s National Agricultural Statistics Service released a citrus production estimate of about 1.4 million tons for the 2022/23 crop year. This forecast is 32 percent below total production from the previous season and does not take into consideration losses from Ian. While 2017 and 2022 hurricane events are distinct from one another, the effects of Irma can be used as a proxy to estimate the potential impact on value until the impact on the State’s total citrus production can be fully assessed. This chart is based on USDA, Economic Research Service (ERS) Fruit and Tree Nuts Outlook Report, released September 2022, and ERS’ Fruit and Tree Nuts Yearbook Tables, released October 2021, and has been updated with recent data.
_450px.png?v=3361.5)
Wednesday, September 28, 2022
From sweet and juicy to tart and crisp, apples grown in the United States vary with a wide range of characteristics. Prices received by apple producers reflect consumer preferences for these varied attributes, as well as production-related factors, including volume harvested, cultivation methods, and storability. In the State of Washington, where two-thirds of all U.S. apples are grown, price and production data for more than 20 different apple varieties are collected and published by the Washington State Tree Fruit Association. The iconic Red Delicious apple led production among varieties in Washington in the 2018/19 marketing year. This variety alone accounted for more than 29 million 40-pound boxes, or 25 percent of Washington State’s apple production for both domestic and international use. Red Delicious apples are usually harvested with a single pass through the orchard and are the easiest and least expensive variety for growers to harvest. In 2018/19, the price of a 40-pound box was $17.65, among the lowest of all varieties surveyed. Over the last two decades, varieties including Gala, Fuji, Granny Smith, and Honeycrisp have gained popularity among consumers. Honeycrisp apples are prized for their firm flesh and balance of both sweet and tart flavors—making them a popular snacking apple. Growing consumer demand has helped to elevate Honeycrisp production to more than 12 million 40-pound boxes in 2018/19 and supports both a retail- and farm-price premium. In 2018/19 Honeycrisp was Washington’s highest priced apple at $53.39 for a 40-pound box. Farm prices for Honeycrisp apples are higher, in part, because of elevated labor costs associated with harvest. Because this cultivar does not uniformly ripen, up to five passes through the orchard are required to harvest a crop of Honeycrisp apples. This chart is drawn from the USDA, Economic Research Service’s “Supplement to Adjusting to Higher Labor Costs in Selected U.S. Fresh Fruit and Vegetable Industries: Case Studies,” August 2022.
Monday, September 26, 2022
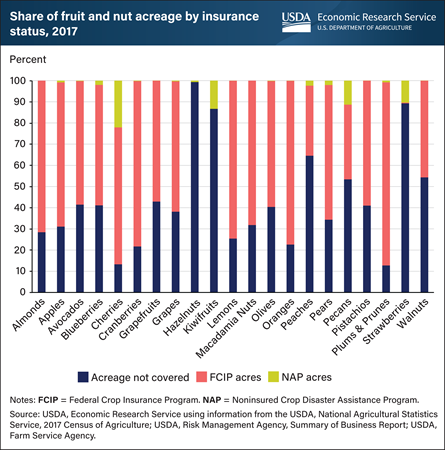
There are two permanent Federal options for specialty crop farmers to protect themselves against losses from natural disasters, but usage varies widely across fruit and nut crops. The USDA Risk Management Agency offers Federal Crop Insurance Program (FCIP) products to cover specialty crops in counties with enough data available to offer an actuarially sound insurance product. For crops grown in counties without enough data to provide FCIP products, coverage is available through the USDA Farm Service Agency Noninsured Crop Disaster Assistance Program (NAP). Using cherries as an example, FCIP is available for cherry growers who operate in counties with a high number of cherry acres. Because of this, farmers used FCIP to cover about 65 percent of all cherry acres. Cherry growers outside of those counties used NAP policies to cover about 20 percent of all cherry acres, leaving only 15 percent of acres not covered by any risk management program. For some crops, however, Federal agricultural risk management programs covered only a small portion of acres. Kiwifruits and strawberries had less than 15 percent of acres covered by either FCIP or NAP, while hazelnuts had less than 1 percent. This chart appears in the Economic Research Service bulletin Specialty Crop Participation in Federal Risk Management Programs, published in September 2022.


