
U.S. Fresh Vegetable Imports From Mexico and Canada Continue To Surge
- by Wilma V. Davis and Gary Lucier
- 11/8/2021
Highlights
- Over the past 2 decades, the volume of fresh vegetables imported by the United States, primarily from Mexico and Canada, rose nearly 200 percent.
- Market window creep, liberalized trade agreements, comparatively lower foreign exchange rates, and increased per capita consumption have all combined to fuel annual increases in fresh vegetable import volume.
- Although this article focuses on four specific markets: bell peppers, cucumbers, squash, and snap beans, imports are increasing across the fresh vegetable industry.
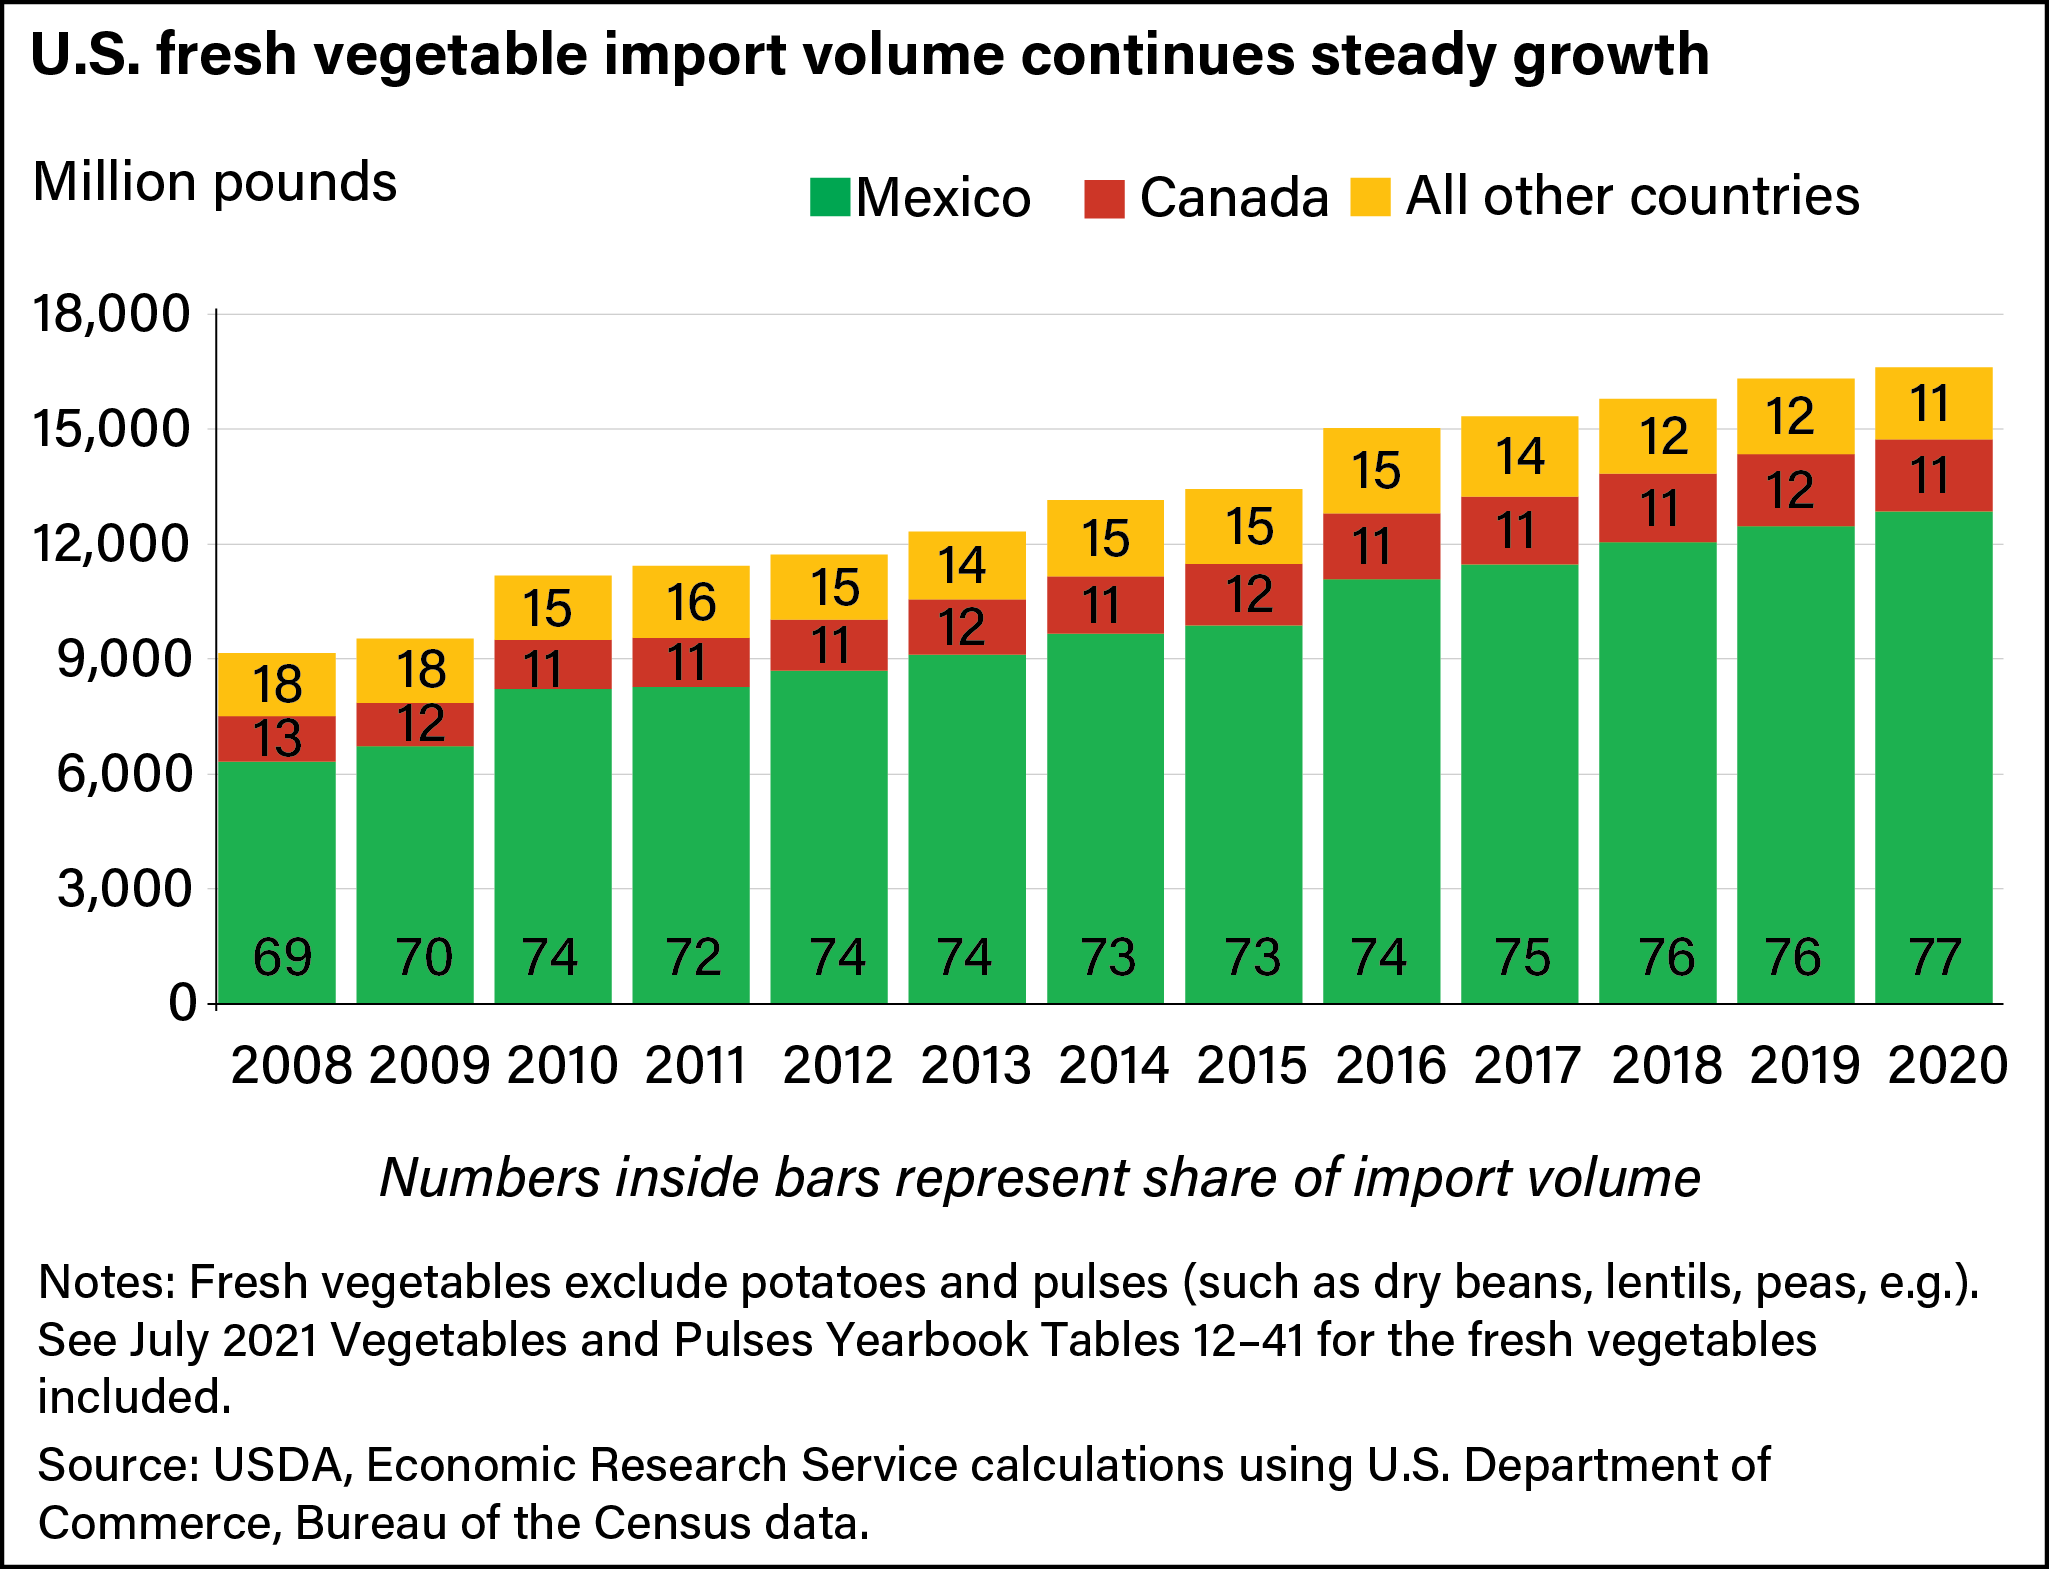
The United States receives fresh vegetables from more than 125 different countries, but most imports originate from Mexico and Canada. In 2020, Mexico accounted for 77 percent of U.S. fresh vegetable import volume, and Canada represented 11 percent (see chart below). An analysis of domestic census and trade data shows Mexican and Canadian producers have dominated the U.S. import market by offering protected culture—or greenhouse—imports as well as organic options, which increased choices for consumers. While conventional and field-grown fresh vegetables still account for most imports, organic and greenhouse vegetables are expanding market reach.
U.S. consumers have pushed for greater consistency in supermarket produce and expanded demand for year-round availability of virtually all fresh vegetables. Between 1998 and 2020, the volume of fresh vegetable imports increased nearly 200 percent, and the value of fresh vegetable imports grew to exceed fresh exports by $7.6 billion, more than double the same figure a decade earlier.
Market Window Creep in Fresh Vegetable Imports
Market window creep is an extension of seasonal demand and refers to the increasing volume of fresh vegetable imports entering during the start or end of the traditional domestic production seasons. Over time, the categorization of vegetables into summer and winter categories has dwindled as near year-round imports of both categories of produce proliferated. Many traditional domestic market windows have eroded as importers have found their own market windows expanding, according to trade data. From 2008 to 2020, imports entered the market earlier than usual (entering the traditional domestic market window), and shipping seasons were extended into the following season.
Imports previously complemented U.S. production during the winter, autumn, and early spring months when domestic supplies were limited. However, imports grown under greenhouse production or in southern climates increasingly augment U.S. production at the beginning and end of domestic market windows for many fresh vegetables. A cross-section view of four selected vegetables illustrates the challenges faced by the entire U.S. fresh vegetable industry from an increase in imports.
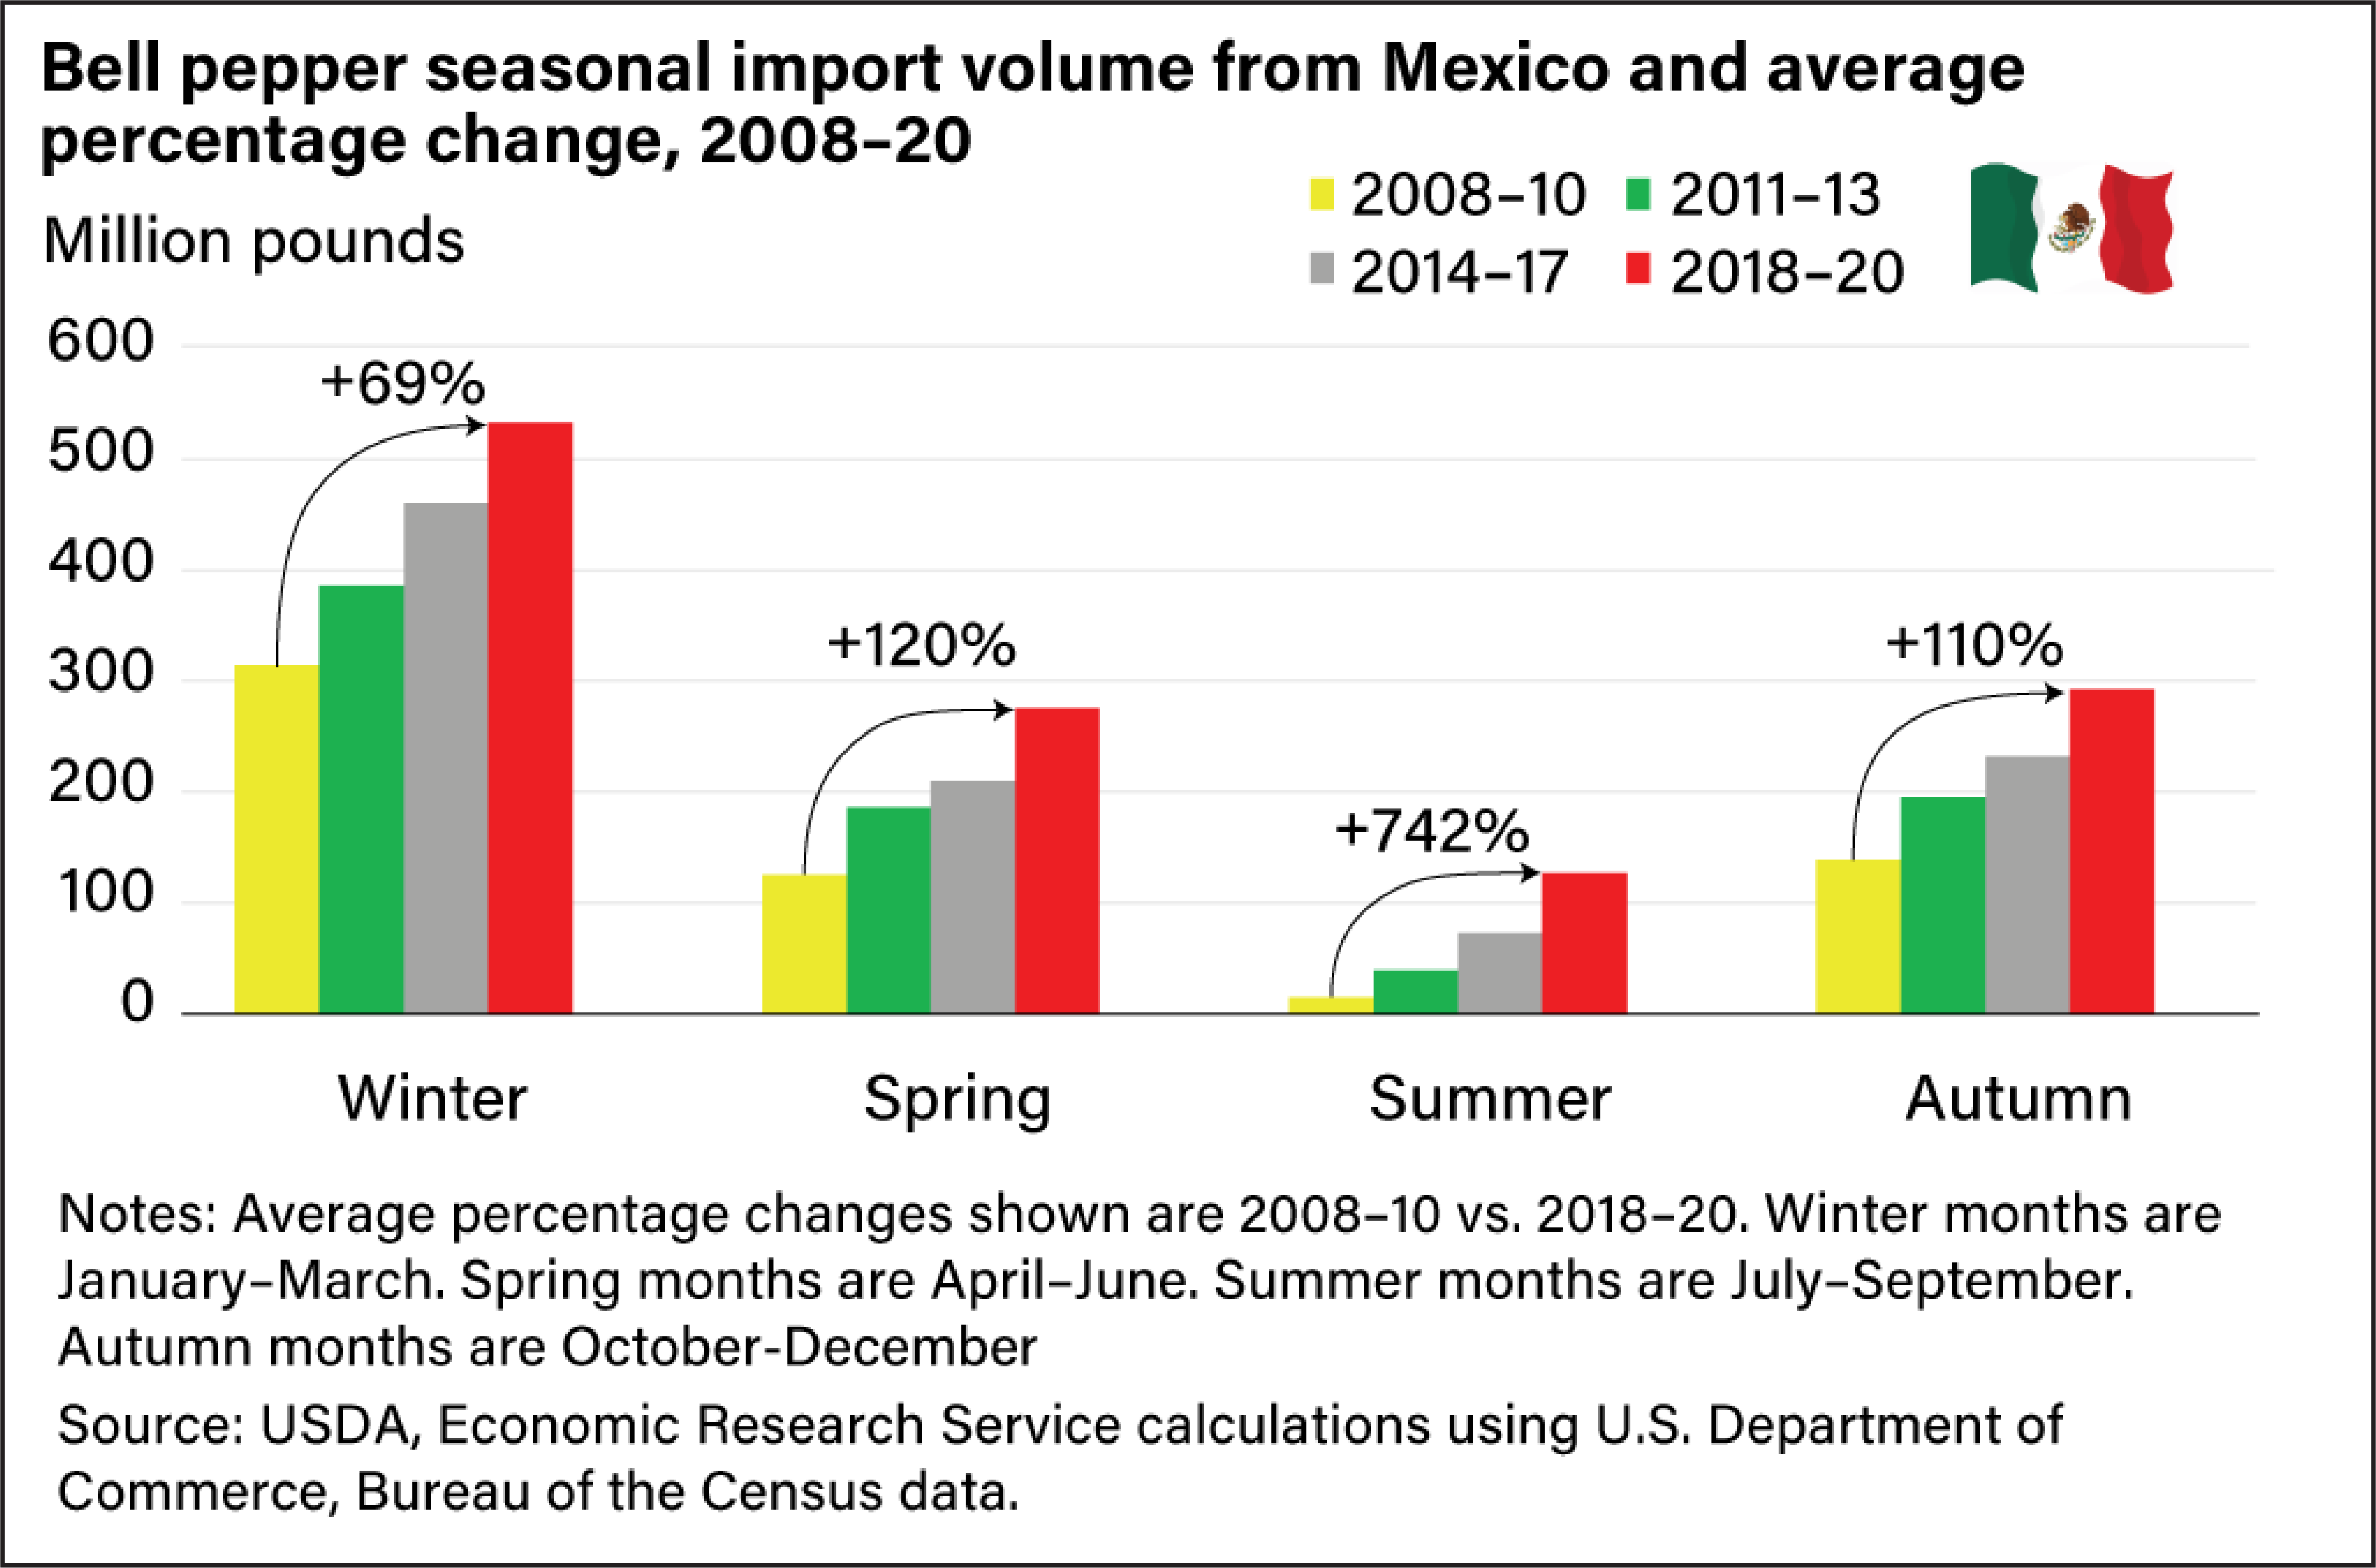
Summer is historically the primary market window for U.S. producers; however, fresh vegetable import volumes from Mexico during the summer months have shown substantial increases in the past 15 years. Comparing 3-year average import volumes for bell peppers from Mexico provides an illustration of market window creep in the summer months (see chart below). Bell pepper import volume increased by 742 percent to 127 million pounds in the summers of 2018–20 from 15 million pounds in the summers of 2008–10. Meanwhile, cucumber imports increased 156 percent to 223 million pounds from 87 million pounds over the same period; squash imports increased 105 percent to 69 million pounds from 34 million pounds; and snap bean import volume increased by 204 percent to 15 million pounds from 5 million pounds.
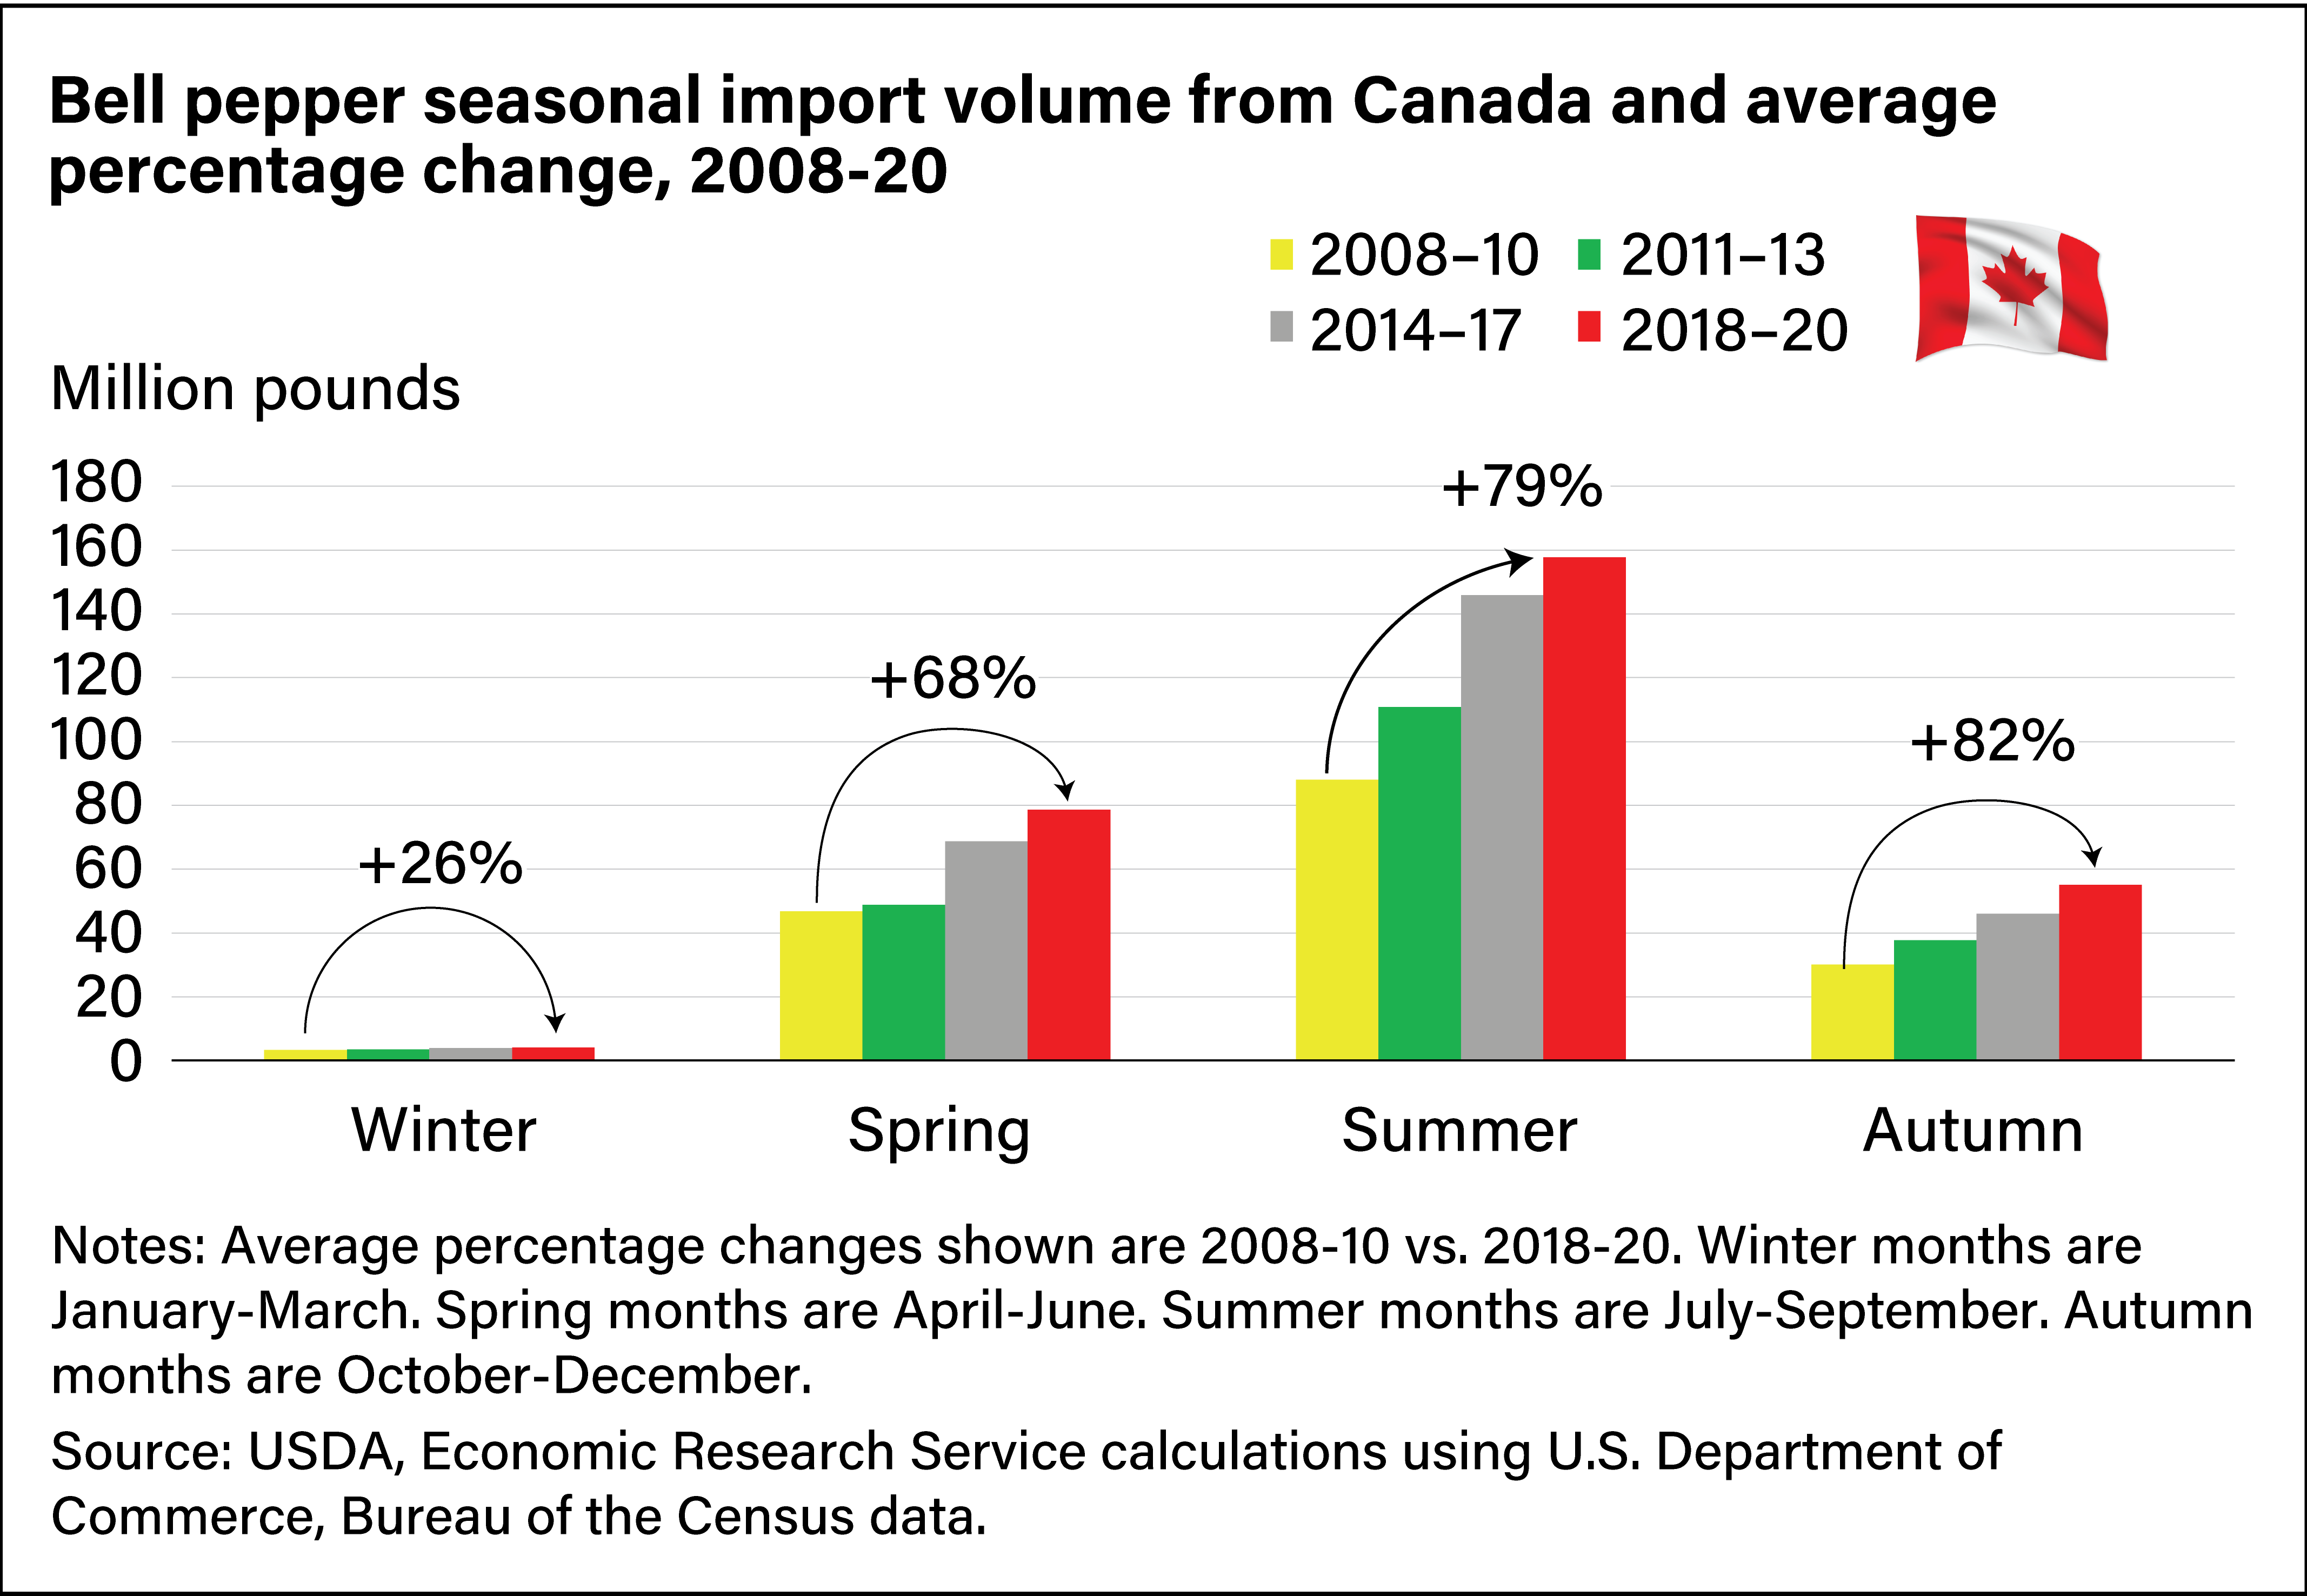
Market window creep is also apparent in the import volumes of fresh vegetables from Canada. A comparison of 3-year average import volume for bell peppers from Canada shows volume in the summer months is at its highest level and increased by 79 percent from 2008–10 to 2018–20 (see chart below). Meanwhile cucumber imports from Canada increased 149 percent (to 162 million pounds from 65 million pounds) in the same period; squash imports increased 355 percent (to 14 million pounds from 3 million pounds); and snap bean imports increased 114 percent (to 3 million pounds from 1 million pounds).
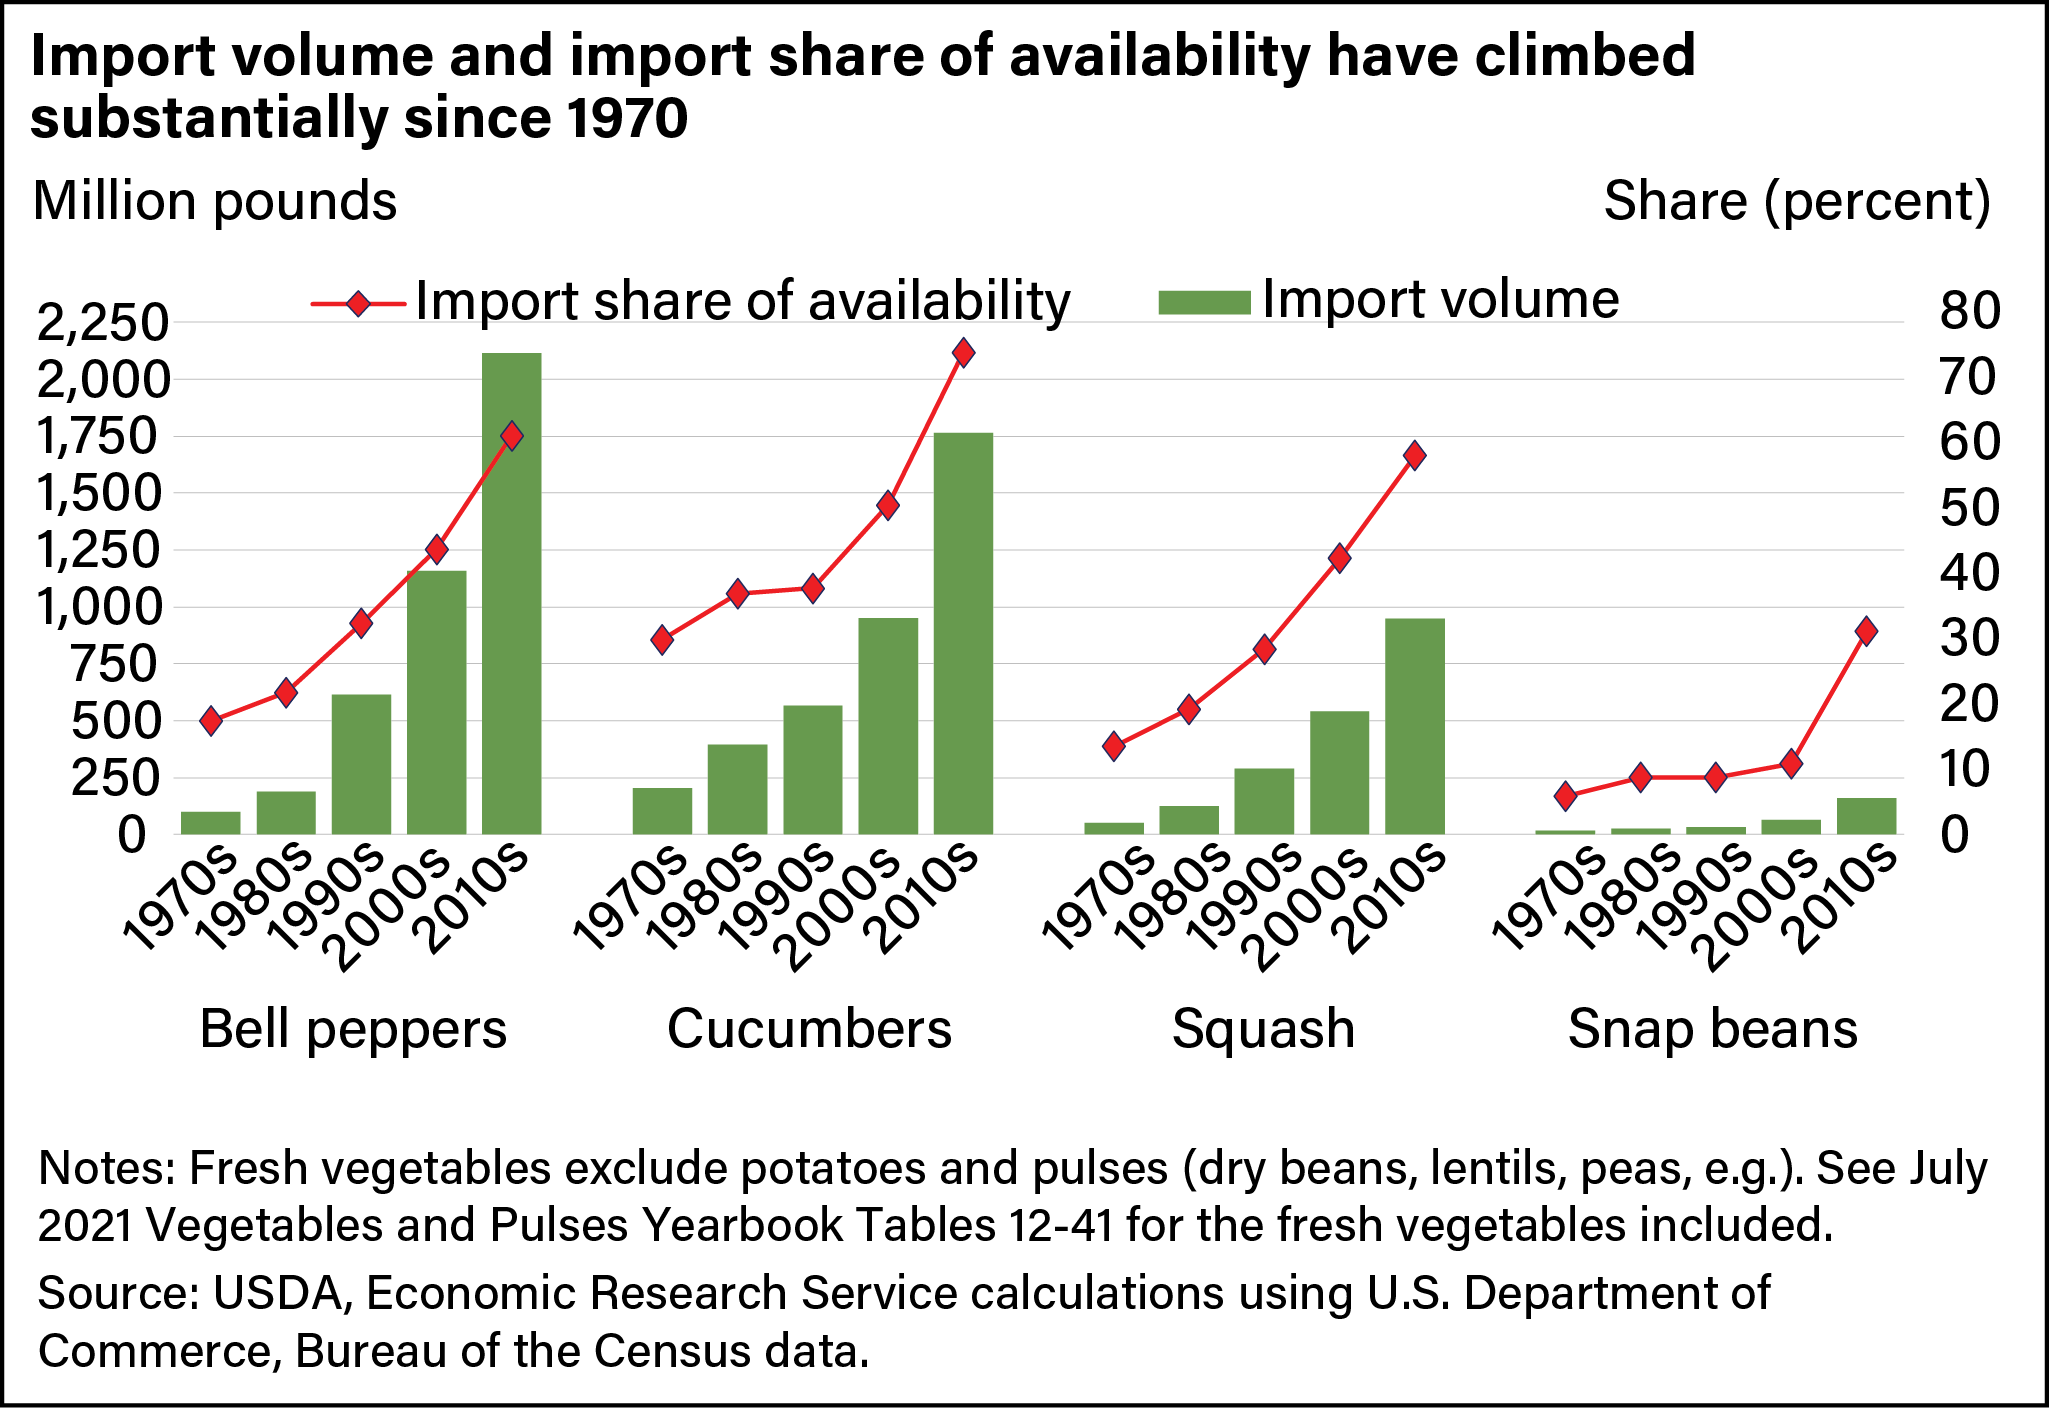
Import Share of Availability of Bell Peppers, Cucumbers, Squash, and Snap Beans
Over the past several decades, U.S. growers of fresh field-grown warm-season vegetables have been challenged by import competition. USDA, ERS has published studies over the years detailing the nature of competition between Mexico and Florida in the winter fresh vegetable market (see links below in “You may also be interested in…”). Availability—the annual quantity of a vegetable offered for domestic consumption—is the sum of domestic production plus imports, less U.S. export volume. In terms of volume and share of availability, imports of fresh bell peppers, cucumbers, squash, and snap beans have all increased each decade from 1970-2020 (see chart below).
Mexico remains the leading foreign source and year-round supplier of fresh bell peppers, cucumbers, squash, and snap beans and accounts for about 80 percent import volume during 2018-20 for all four commodities. Import penetration in volume and in the import share of availability (see chart below) in the United States for all four commodity markets continue to trend up each decade, while domestic production trends for the same four commodities are declining.
Broader Offerings Demanded
Over time, U.S. consumer demand has grown for products that command a price premium, such as organic vegetables and greenhouse tomatoes, peppers, and cucumbers. In the United States, producers responded by increasing the use of protected culture such as traditional or hydroponic greenhouses. (See blue box below for more on the use of the term “greenhouse.”) However, expansion of U.S. greenhouse production continues to lag demand, and imports of greenhouse and conventionally grown produce continue to rise, particularly from southern climates.
According to the 2019 Census of Horticulture, U.S. greenhouse bell pepper production increased 508 percent since the 2009 census, rising from 2 million pounds to 11 million pounds in the span of a decade. During the same period, U.S. greenhouse cucumber production increased 92 percent to 51 million pounds from 27 million. Bell pepper imports increased 141 percent to 881 million pounds in 2019 from 366 million pounds, and cucumber imports rose 175 percent to 386 million pounds from 141 million pounds. Even with these gains in U.S. greenhouse production over the past decade, greenhouse imports still dominated the market.
Trade Agreements and Foreign Exchange Rates Support Fresh Vegetable Imports
Annual increases in fresh vegetable import volume have also been influenced by trade agreements. Fresh market vegetables move tariff-free within the North American market under the United States-Mexico-Canada Agreement (USMCA), formerly the North American Free Trade Agreement. Other trade agreements, such as the U.S.-Peru Free Trade Agreement and the Dominican Republic-Central America-United States Free Trade Agreement (CAFTA-DR), have also provided access to increased supplies of fresh vegetables. Trade data shows that over time, this resulted in increased bilateral trade with the United States and vaulted Peru and Guatemala into the top five foreign sources of fresh vegetables.
In addition to trade agreements, exchange rates also affect the purchasing power of vegetable imports relative to domestic vegetable production. Assuming equivalent pricing, a stronger U.S. dollar can allow the same amount of currency to purchase a greater volume of products. The U.S. dollar to Mexico’s peso exchange rate trended higher over the past 20 years, with a dollar worth an average 21.50 pesos in 2020, compared with 12.63 pesos in 2010—a 70-percent gain. Similarly, 1 U.S. dollar traded for 1.34 Canadian dollars in 2020 and 1.03 Canadian dollars in 2010, a 30-percent increase.
Forthcoming Trade Investigations and Implications for U.S. Vegetable Producers
The impetus of this research was influenced by formal inquiries from U.S. vegetable producer groups presented to the U.S. International Trade Commission (USITC) in November and December 2020. U.S. producer groups for bell peppers, cucumbers, and squash filed inquiries with USITC to determine whether some type of relief was warranted with respect to unfair trade practices. The USITC submits a report at the end of each investigation. The cucumber and squash reports are scheduled to be delivered in December 2021. Additional information on the status of these inquiries can be found on USITC’s website.
Although this article focuses on specific fresh vegetable markets, import competition is an issue for the entire U.S. fresh vegetable industry. Market window creep, liberalized trade agreements, comparatively lower foreign exchange rates, and increased per capita consumption have all combined to fuel annual increases in fresh vegetable import volume. Given persistent decades-long trends, import gains as a portion of total supply are expected to continue within the fresh vegetable industry.
This article is drawn from:
- Davis, W.V. & Lucier, G. (2021). Vegetables and Pulses Outlook: April 2021. U.S. Department of Agriculture, Economic Research Service. VGS-366.
You may also like:
- Calvin, L. & Martin, P. (2010, December 1). Labor-Intensive U.S. Fruit and Vegetable Industry Competes in a Global Market. Amber Waves, U.S. Department of Agriculture, Economic Research Service.
- Cook, R. & Calvin, L. (2005). Greenhouse Tomatoes Change the Dynamics of the North American Fresh Tomato Industry. U.S. Department of Agriculture, Economic Research Service. ERR-2.
- Huang, S., Calvin, L., Coyle, W.T., Dyck, J., Ito, K., Kelch, D., Lucier, G., Perez, A., Pollack, S., Pryor, S., Regmi, A., Shane, M., Shields, D., Stout, J. & Worth , T. (2004). Global Trade Patterns in Fruits and Vegetables. U.S. Department of Agriculture, Economic Research Service. WRS-0406.
- Lucier, G., Pollack, S., Ali, M. & Perez, A. (2006). Fruit and Vegetable Backgrounder. U.S. Department of Agriculture, Economic Research Service. VGS-31301.
- Regmi, A. (2001). Changing Structure of Global Food Consumption and Trade. U.S. Department of Agriculture, Economic Research Service. WRS-01-1.
- Buckley, K.C., VanSickle, J.J., Bredahl, M.E., Belibasis, E. & Gutierrez, N. (1986). Florida and Mexico Competition for the Winter Fresh Vegetable Market. USDA, ERS.