
Inflation-adjusted orange juice prices up 12 percent over 20 years
- by Skyler Simnitt
- 10/24/2023
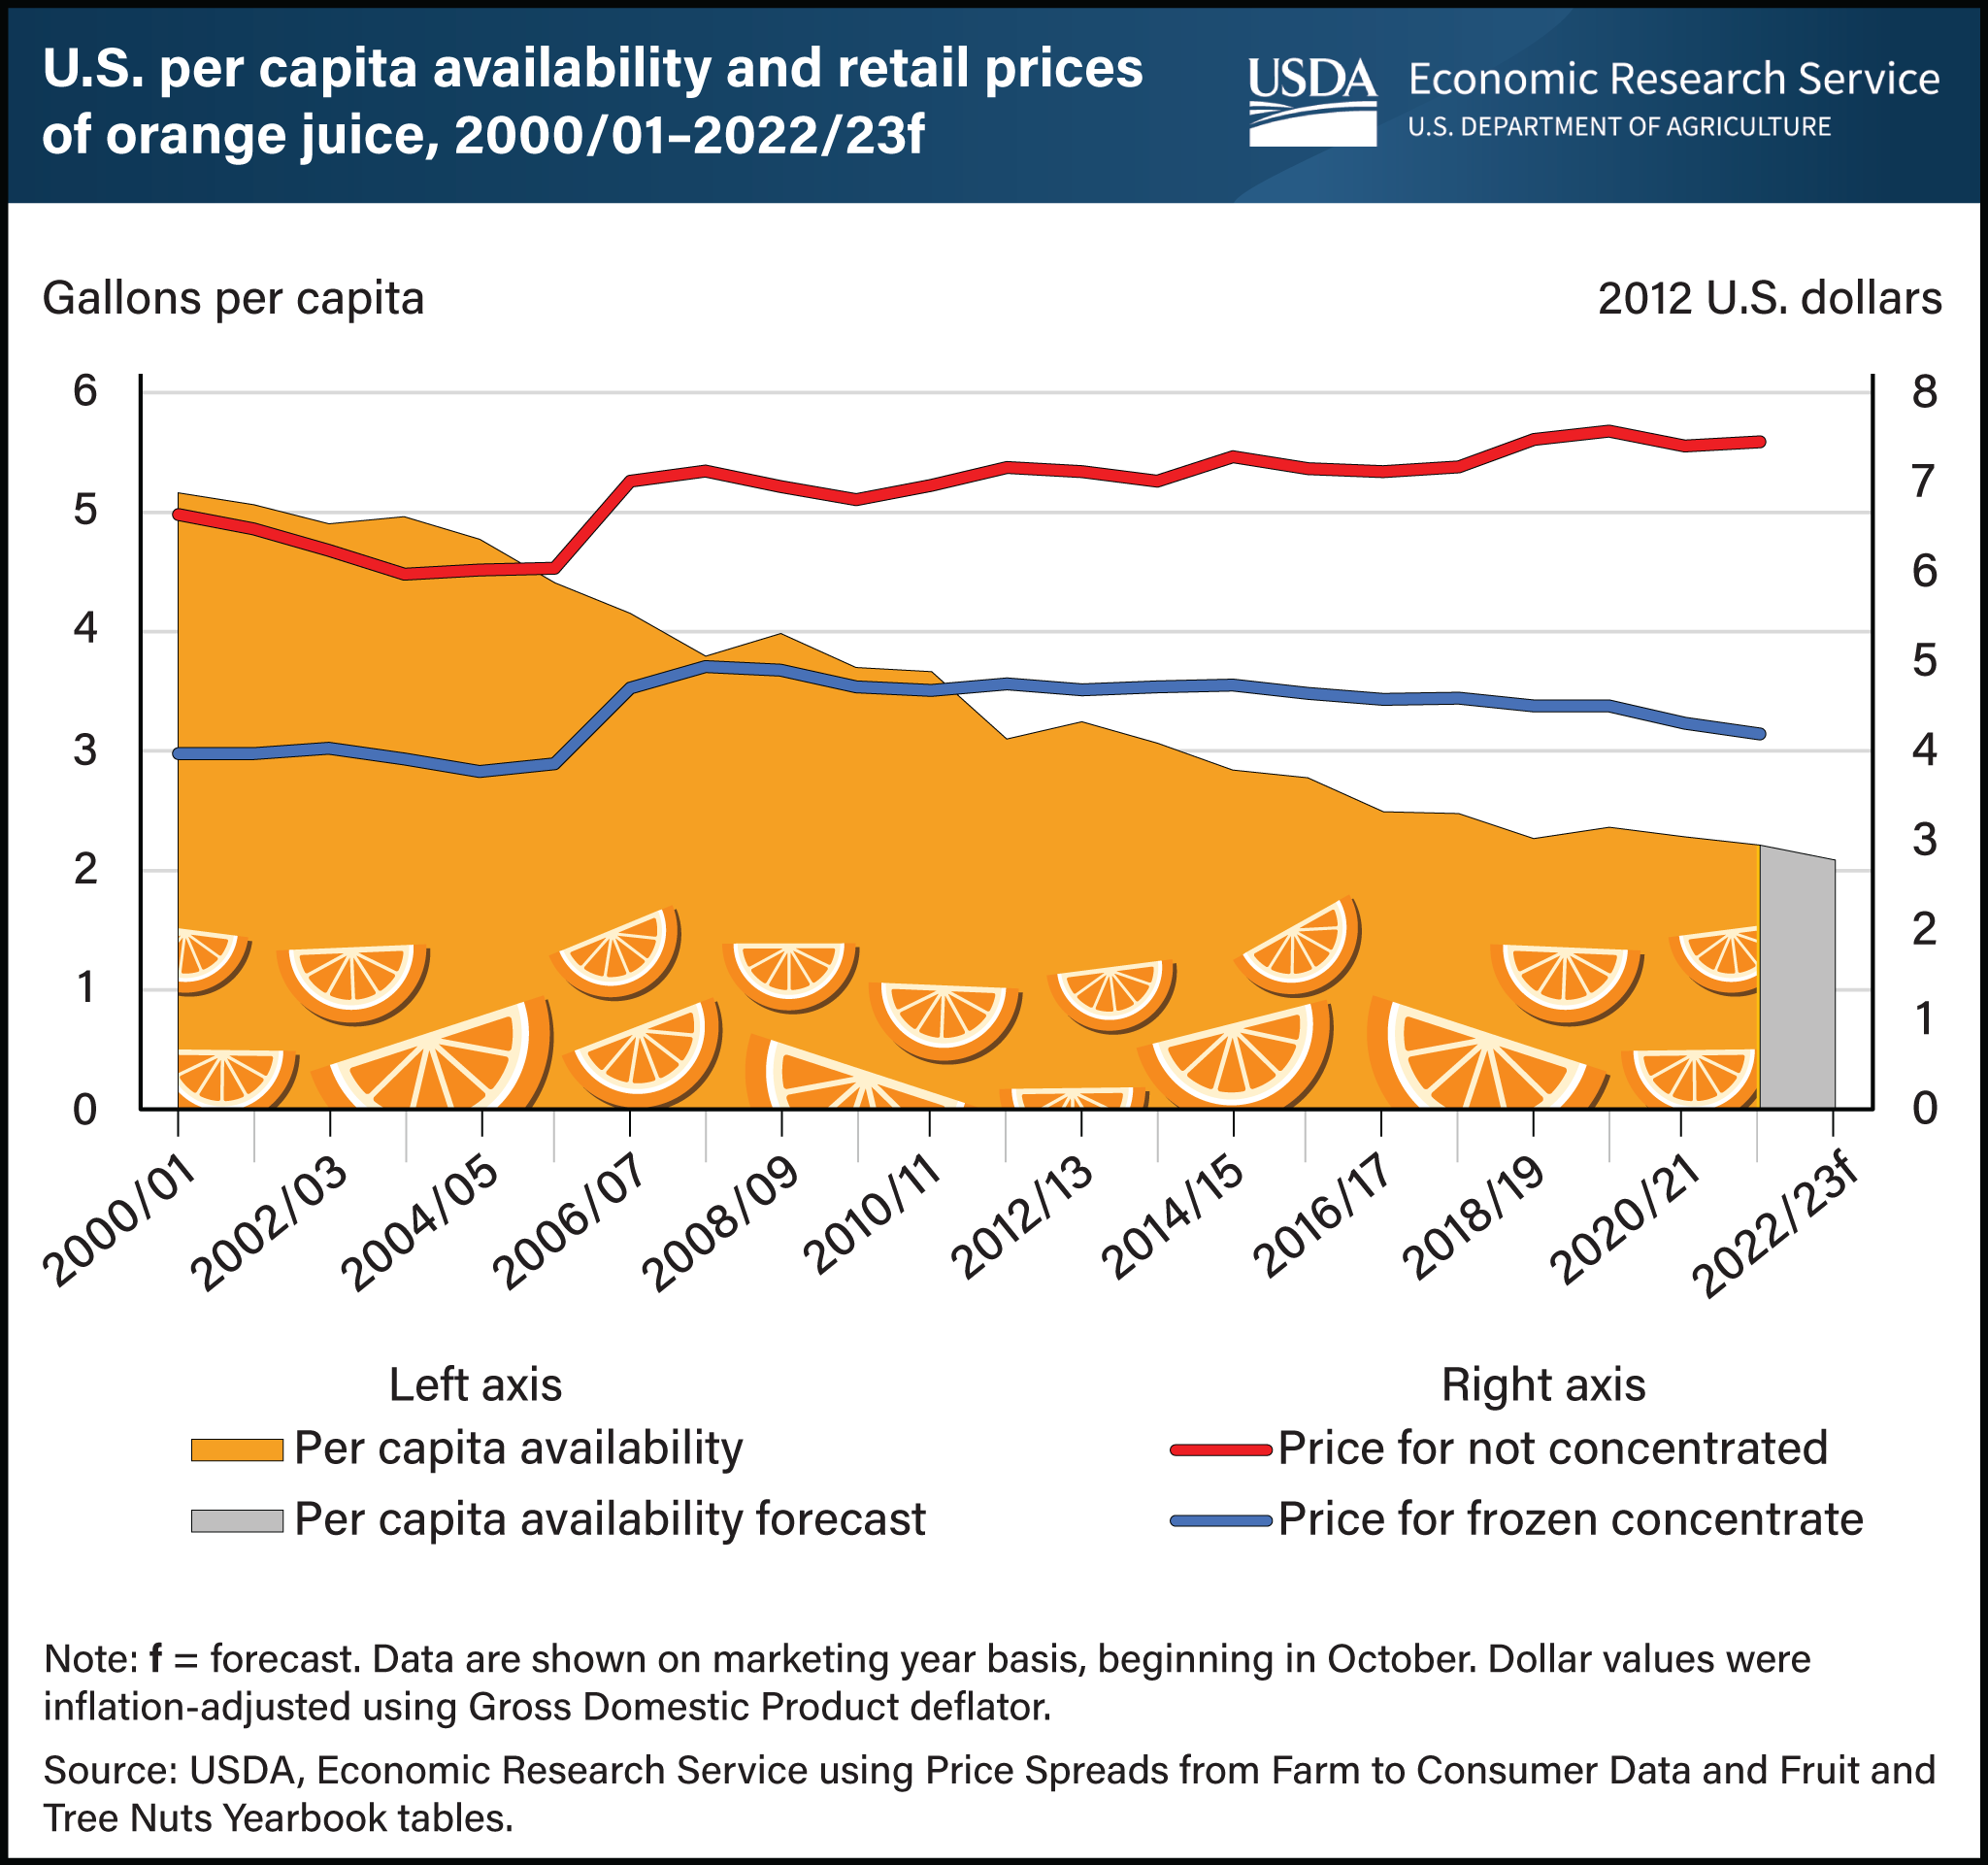
Orange juice, once a staple beverage in many U.S. households, has experienced a steady decline in consumption over the last two decades. While waning consumer demand has played a role, decreased domestic orange production has also negatively impacted per capita availability, a proxy measure for consumption. Orange juice imports from Brazil and Mexico have tempered some of this decline, however, availability of orange juice has fallen from about 5 gallons a person in the 2000/01 marketing year to a forecast of 2 gallons per person in 2022/23. Most oranges grown for the processing/juice market in the United States are harvested in Florida. In recent years, Florida’s citrus crop has suffered from disease and extreme weather events, resulting in smaller orange harvests. Reduced supply has contributed to generally higher orange juice prices. However, adjusted for inflation, prices for frozen concentrated orange juice and not from concentrate (the two main categories) increased at comparatively modest rates between 2000/01 and 2021/22. The price of frozen concentrated orange juice rose by 5 percent over 20 years, while orange juice not from concentrate rose by 12 percent over the same period. The modest increase in the real price highlights the impact of declining demand, somewhat muting the price effect associated with lower supply. This chart is based on the USDA, Economic Research Service (ERS) Fruit and Tree Nuts Outlook Report, released September 2023, and data from the ERS Fruit and Tree Nuts Yearbook and Price Spreads from Farm to Consumer.