
Water use tradeoffs exist between different dietary patterns, 2007
- by Sarah Rehkamp and Patrick Canning
- 8/9/2021
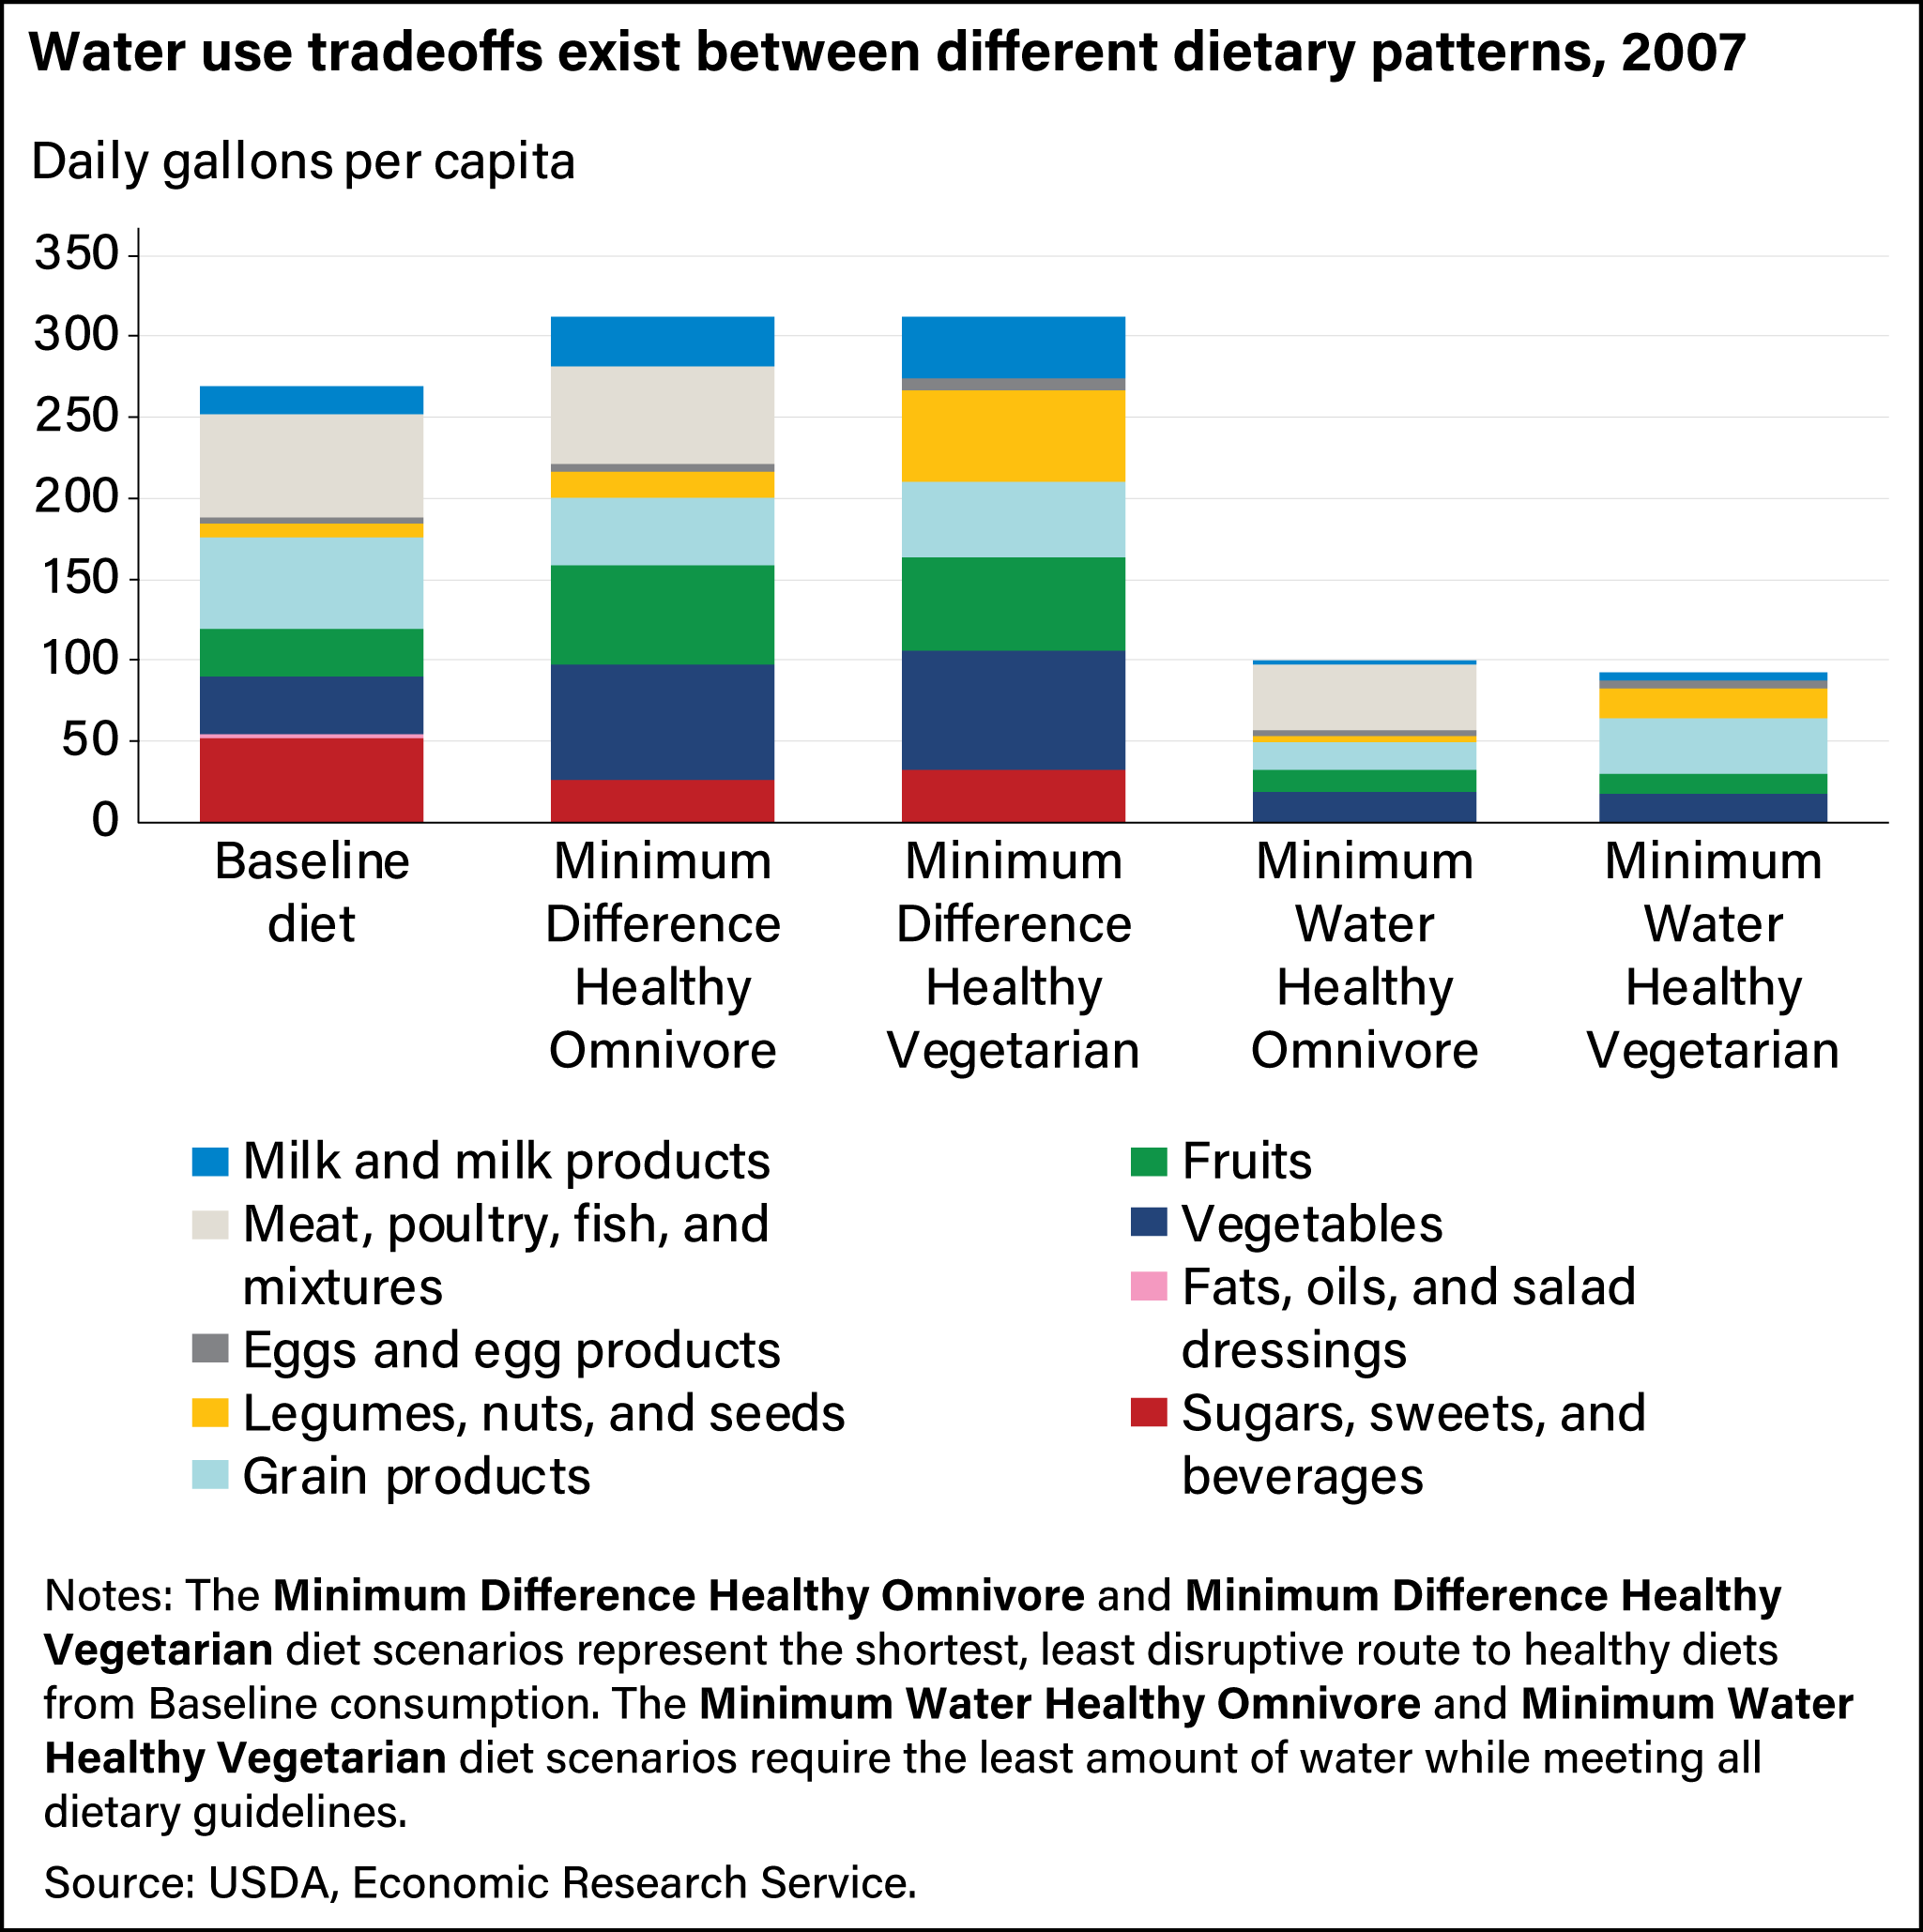
Stacked bar chart showing the daily gallons per capita of water use by nine food groups across five dietary patterns in 2007.