Skip to navigation Skip to main content
U.S. flag

An official website of the United States government

Here’s how you know

Official websites use .gov
A .gov website belongs to an official government organization in the United States.

Secure .gov websites use HTTPS
A lock ( LockA locked padlock ) or https:// means you’ve safely connected to the .gov website. Share sensitive information only on official, secure websites.

U.S. Department of Agriculture logo Economic Research Service U.S. Department of Agriculture
  • Home
    • Topics
    • Animal Products
    • Crops
    • Farm Economy
    • Farm Practices & Management
    • Food & Nutrition Assistance
    • Food Choices & Health
    • Food Markets & Prices
    • Food Safety
    • International Markets & U.S. Trade
    • Natural Resources & Environment
    • Rural Economy & Population
    • Farm Bill
    • Data Products
    • View by Topic:
    • Animal Products
    • Crops
    • Farm Economy
    • Farm Practices & Management
    • Food & Nutrition Assistance
    • Food Choices & Health
    • Food Markets & Prices
    • Food Safety
    • International Markets & U.S. Trade
    • Natural Resources & Environment
    • Rural Economy & Population
    • Publications
    • View by Topic:
    • Animal Products
    • Crops
    • Farm Economy
    • Farm Practices & Management
    • Food & Nutrition Assistance
    • Food Choices & Health
    • Food Markets & Prices
    • Food Safety
    • International Markets & U.S. Trade
    • Natural Resources & Environment
    • Rural Economy & Population
    • Newsroom
    • Contact ERS Press Office
    • Trending Topics
    • Multimedia
    • Calendar
    • Today's Releases
    • This Month's Releases
    • Next Month's Releases
    • Amber Waves Magazine
    • Amber Waves Home
    • All Articles
  • About ERS
  • Careers at ERS
  • FAQs
  • Contact Us
  • Home
  • Data Products
  • Chart Gallery
  • Chart Detail

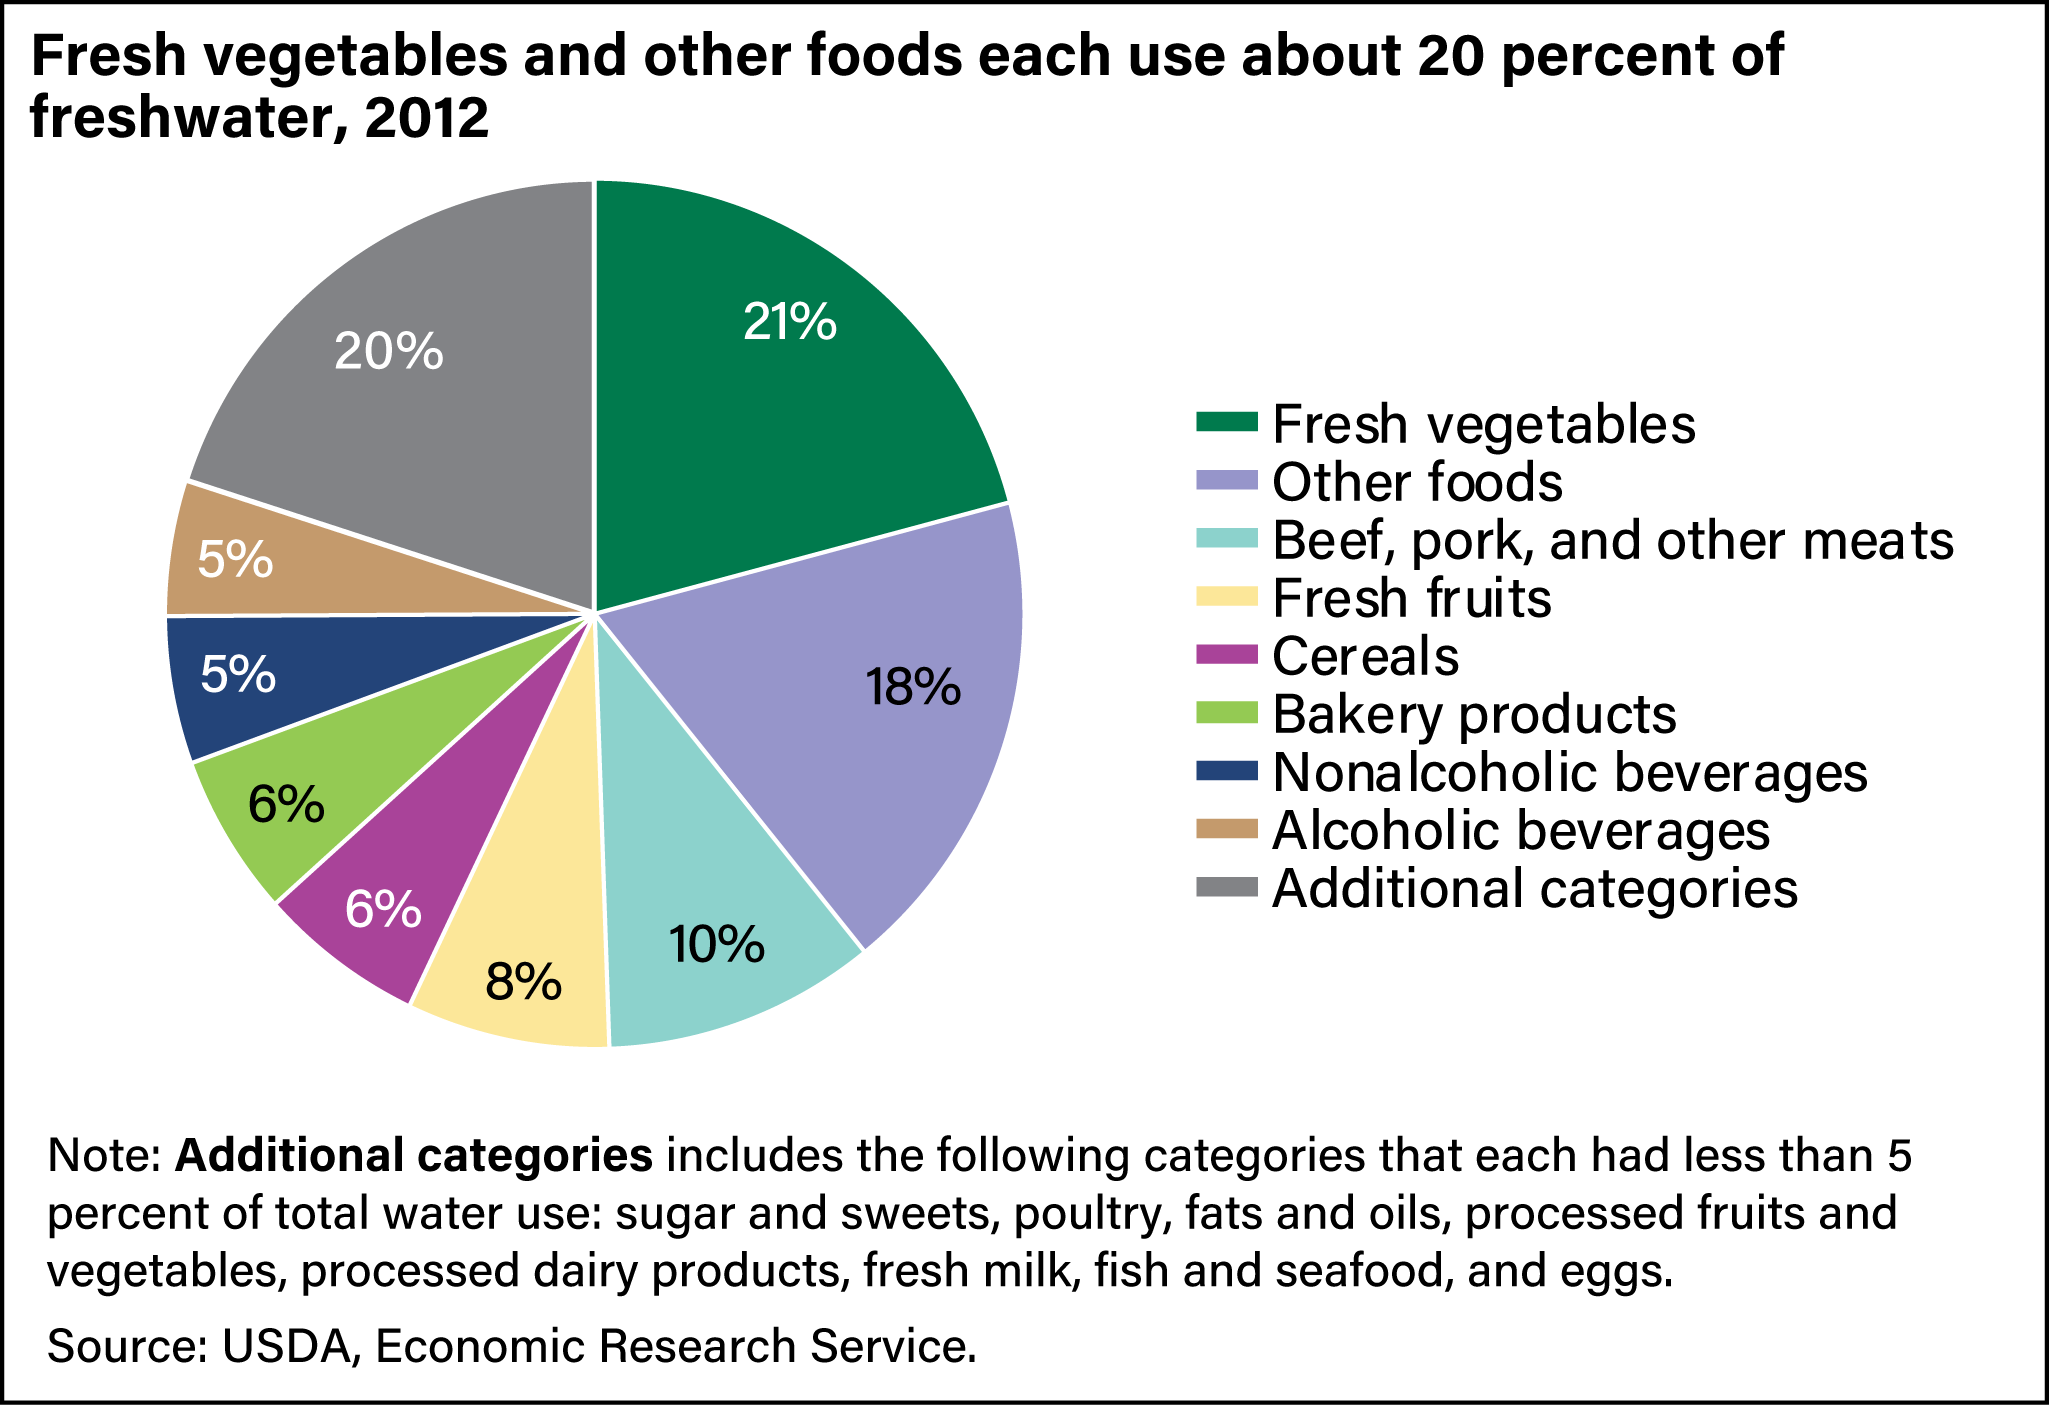
Fresh vegetables and other foods each use about 20 percent of freshwater, 2012

Pie chart showing the percent of food system use by food categories in 2012.

Pie chart showing the percent of food system use by food categories in 2012.

Embed this chart

Download larger size chart (2049 pixels by 1405, 144 dpi)

Related Reports
  • Tracking the U.S. Domestic Food Supply Chain’s Freshwater Use Over Time
Gallery
Related Topics
  • Land Use, Land Value & Tenure
  • Farm Practices & Management
  • Irrigation & Water Use
  • Diet Quality & Nutrition
  • Food Consumption & Demand
  • Processing & Marketing
  • Retailing & Wholesaling
  • Climate Change
  • Conservation Programs
  • Environmental Quality
  • Population & Migration

Last updated: Monday, August 09, 2021

For more information, contact: Sarah Rehkamp and Patrick Canning

Return to top

ERS Links

  • ERS Home
  • Accessibility
  • Careers
  • Contact Us
  • E-Mail Updates
  • Help
  • Information Quality
  • Site Map
  • Privacy Policy & Non-Discrimination Statement

USDA Links

  • FOIA
  • Plain Writing
  • Report Fraud
  • USDA.gov
  • USA.gov
  • White House.gov
Sign Up for Updates
Subscribe
U.S. Department of Agriculture logo
Economic Research Service U.S. Department of Agriculture
Twitter Icon
LinkedIn icon
Email Icon
Multimedia Icon
Blog Icon