



Mexico: Trade
Mexico is a major participant in international agricultural trade. In 2024, Mexico’s agricultural exports (to all countries) totaled about $48.2 billion (applying the World Trade Organization’s definition of agricultural trade to the Mexican Government’s trade statistics). Mexico’s agricultural imports (from all countries) in 2024 totaled about $39.6 billion. The United States is Mexico’s largest agricultural trading partner, buying approximately 91 percent of Mexican exports and supplying roughly 70 percent of the country’s imports in this category.
A turning point in U.S.-Mexico agricultural trade came in the late 1980s, when Mexico emerged from a period of economic difficulties and adopted a series of trade reforms. In 1986, Mexico signed the General Agreement on Tariffs and Trade (GATT), the predecessor to the World Trade Organization (WTO). In the early 1990s, Mexico lowered a number of agricultural trade barriers, and in 1994, Mexico joined Canada and the United States in implementing the North American Free Trade Agreement (NAFTA). Mexico also has free-trade agreements with about 40 other countries. In November 2018, Canada, Mexico, and the United States signed the United States-Mexico-Canada Agreement (USMCA)—a newer trade accord that replaced NAFTA. The entry-into-force date for USMCA was July 1, 2020.
With a growing population and a market-oriented agricultural and food sector that is open to international trade, Mexico is the United States’ largest agricultural trading partner in terms of combined exports and imports, with Canada being a close second. In terms of value, Mexico accounted for 17.1 percent of U.S. agricultural exports and 22.8 percent of U.S. agricultural imports in 2024. Between 1993 (the year before NAFTA’s implementation) and 2024, U.S. agricultural exports to Mexico expanded at a compound annual growth rate (CAGR) of 7.0 percent, while agricultural imports from Mexico grew at a rate of 9.6 percent. During the period 2012–20, however, the total value of U.S. agricultural exports to Mexico experienced little to no growth. Reasons included lower prices for many bulk agricultural commodities, slow economic growth in Mexico (compounded by the global recession caused by the COVID-19 pandemic), and depreciation of the Mexican peso. From 2011 to 2019 (the last year before the pandemic’s onset in the United States and Mexico), U.S. agricultural exports to Mexico grew at a CAGR of 0.6 percent, compared with 7.8 percent for corresponding imports from Mexico. With the economic recovery in the United States and Mexico that followed the pandemic, U.S. agricultural exports to Mexico increased at a CAGR of 9.3 percent between 2019 and 2024, and U.S. agricultural imports from Mexico grew at a CAGR of 10.0 percent.
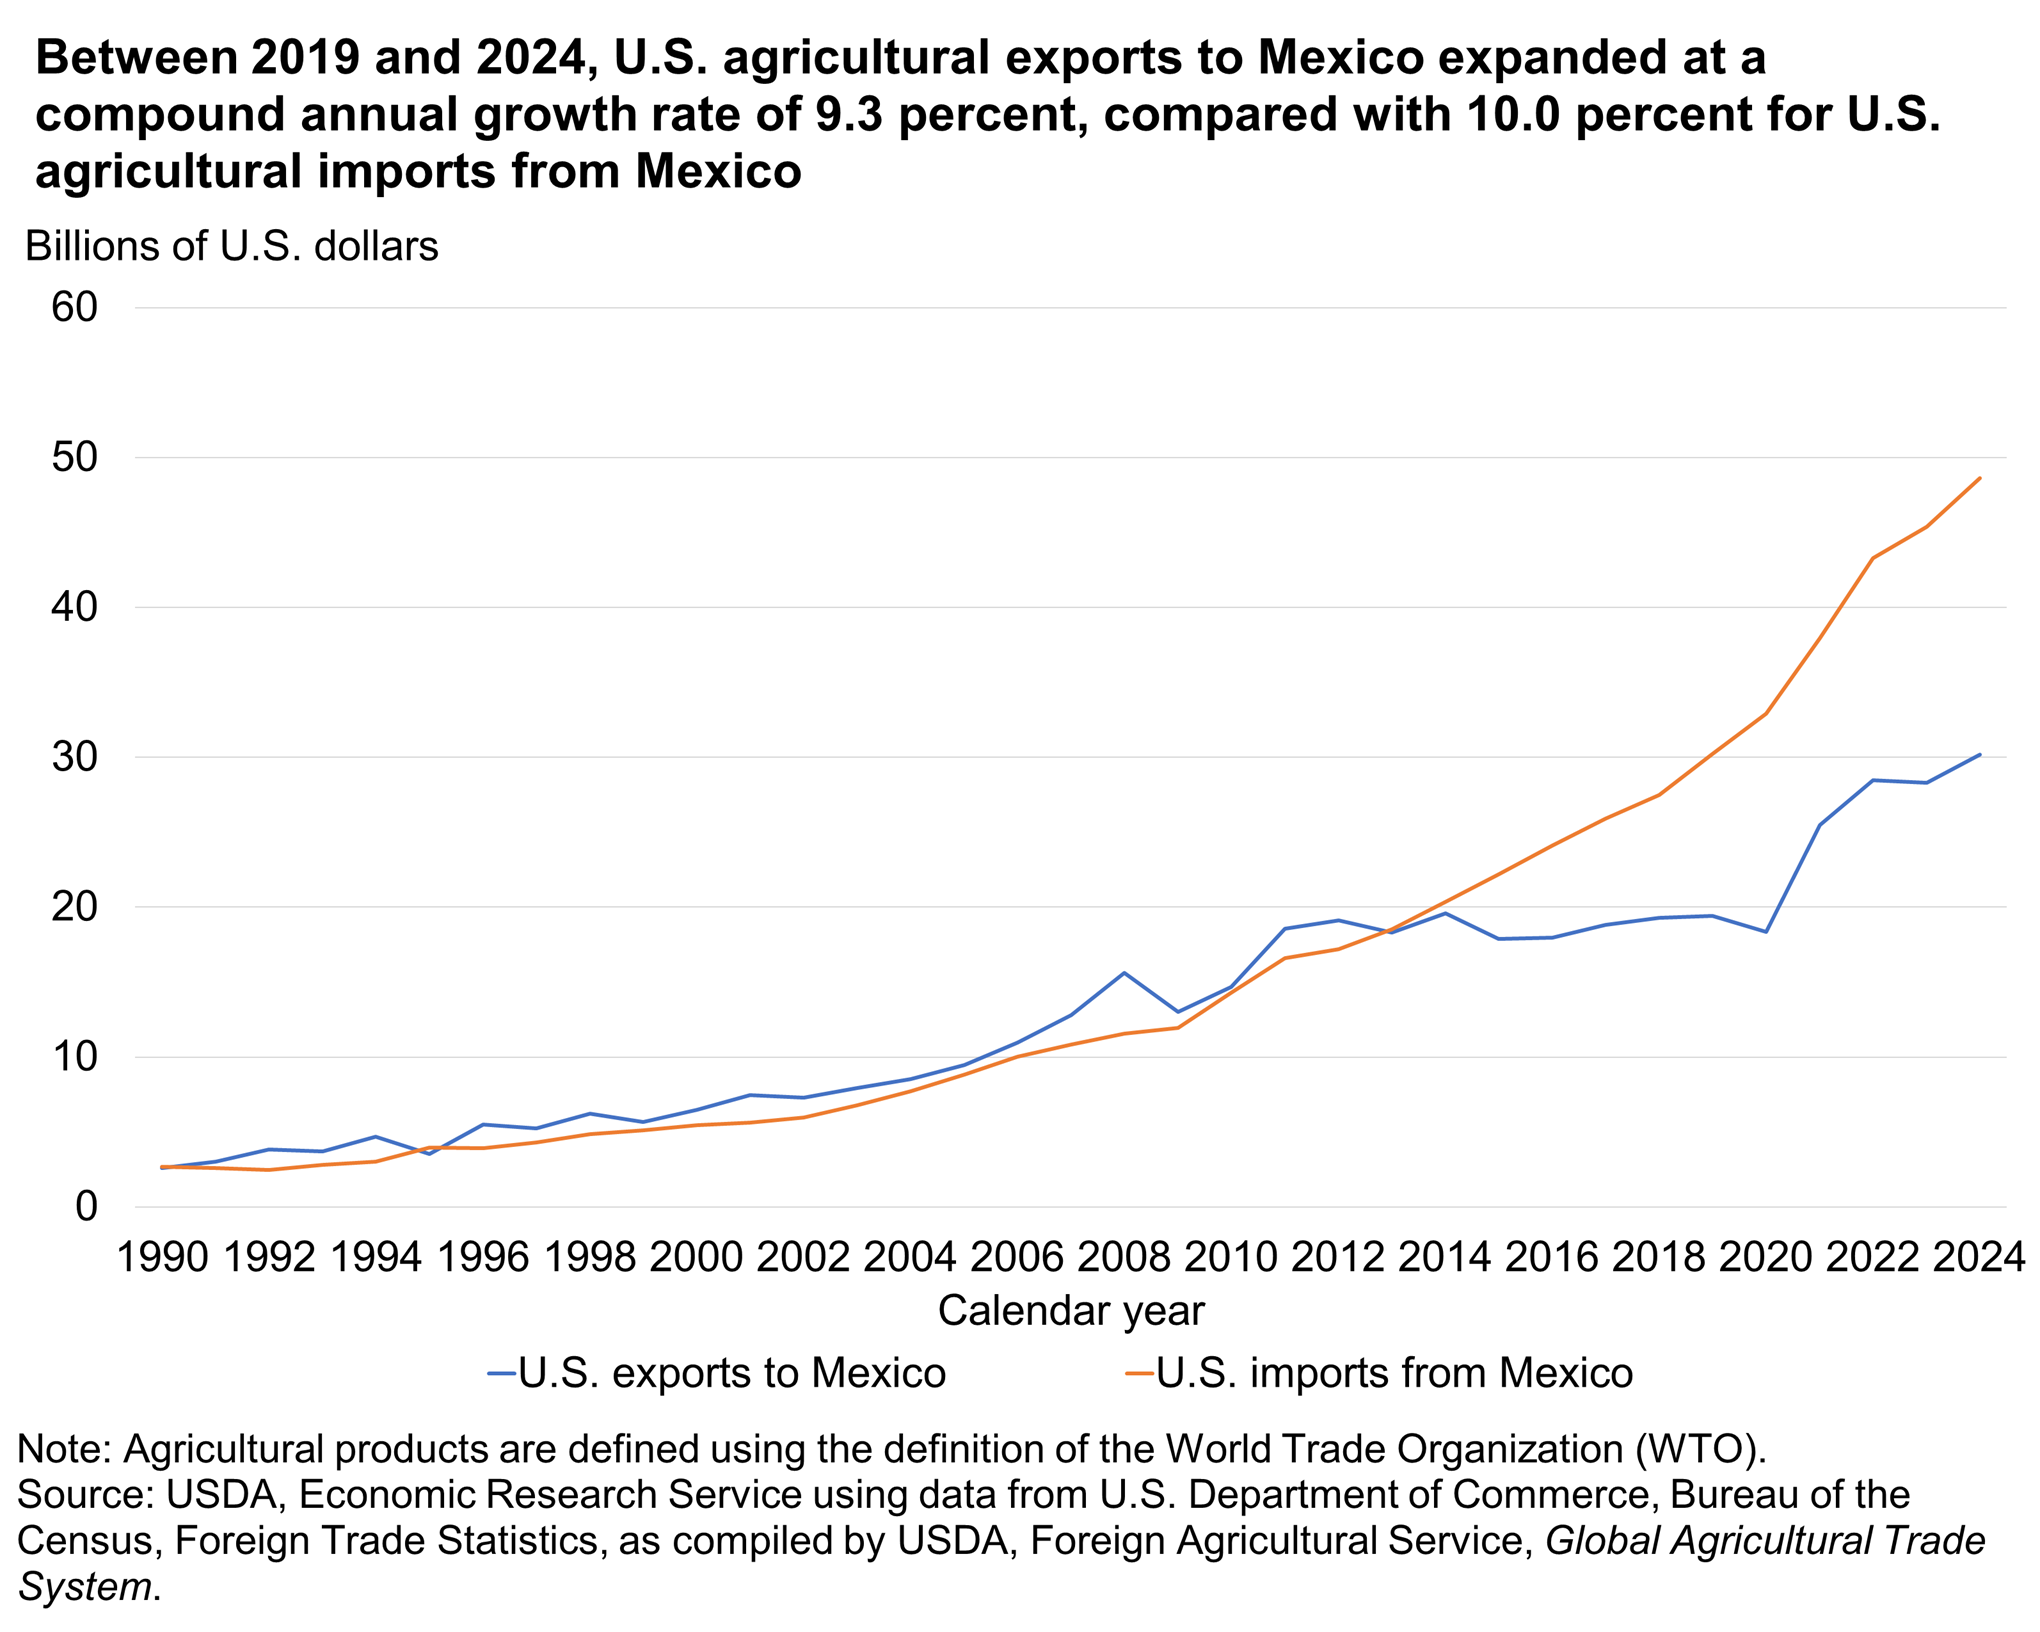
Download chart data in Excel format
U.S.-Mexico agricultural trade is largely complementary, meaning that the United States tends to export different commodities to Mexico than Mexico exports to the United States. Nearly three-fourths (73.3 percent) of U.S. agricultural exports to Mexico are grains, oilseeds, meat, or related products. Mexico does not produce enough grains and oilseeds to meet internal demand, so the country’s food and livestock producers import sizable volumes of these commodities to make value-added products such as meat, vegetable oil, and wheat products (primarily for the domestic market).
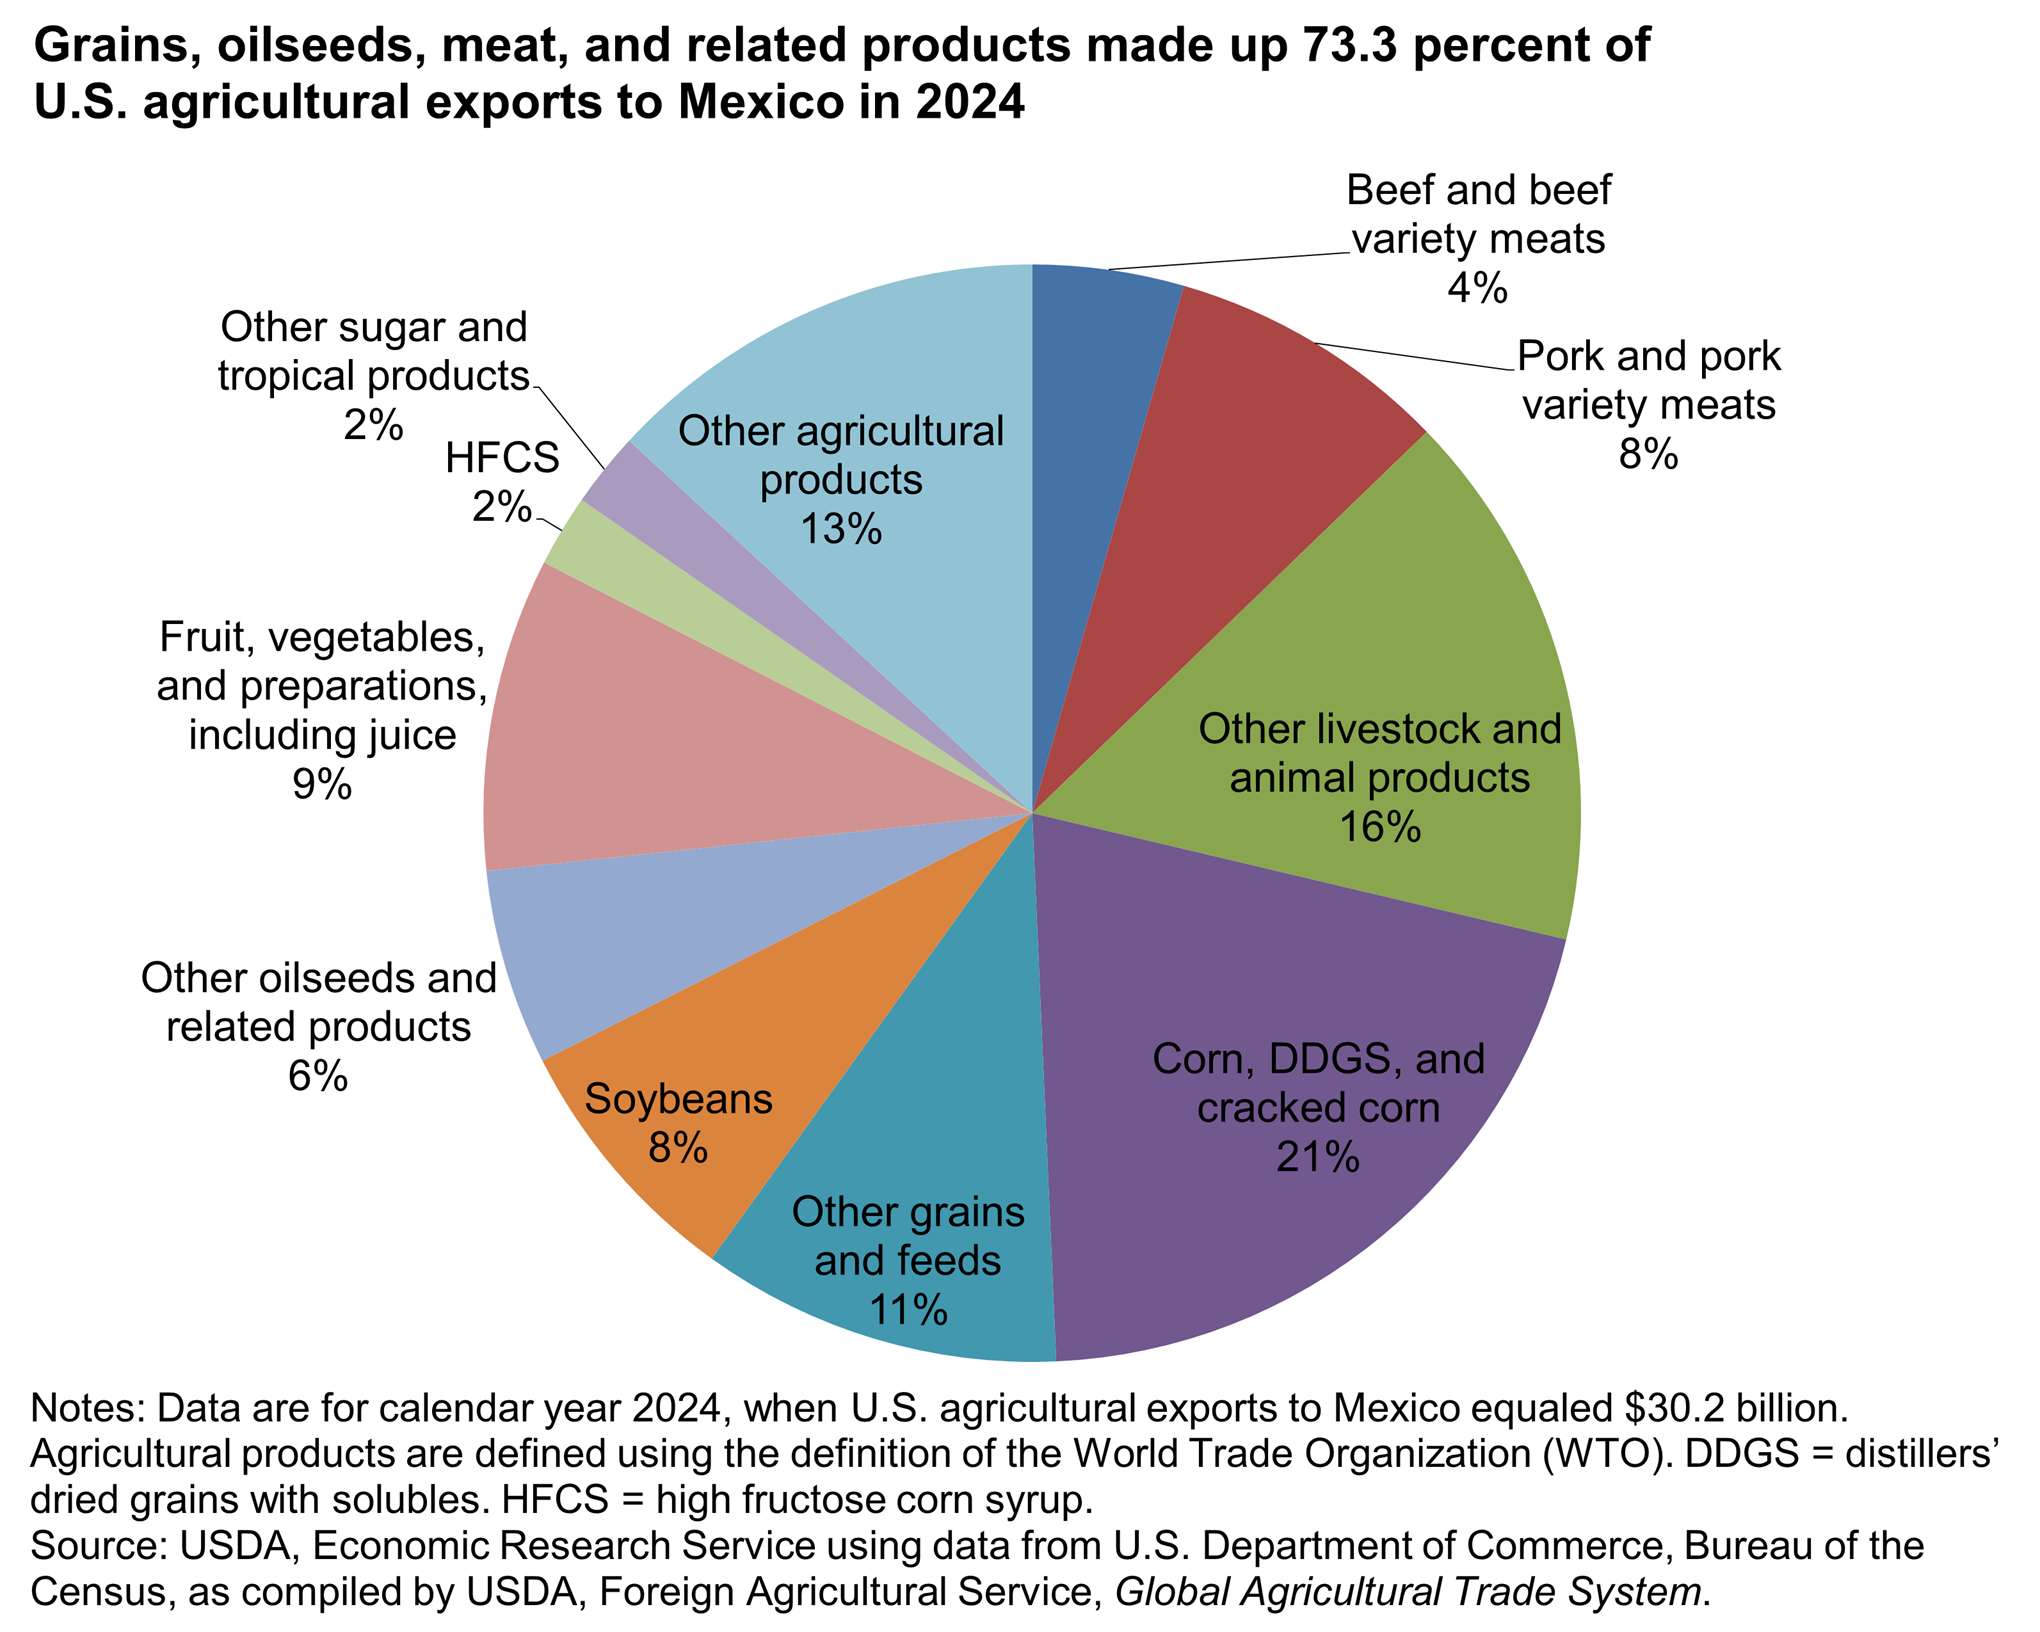
Download chart data in Excel format
Detailed table on selected U.S. agricultural exports to Mexico
Nearly three-quarters (73.1 percent) of U.S. agricultural imports from Mexico consist of vegetables, fruit, beverages, and distilled spirits. These imports are closely tied to a number of factors, including: Mexico’s accumulated knowledge in producing alcoholic beverages and a wide range of fruit and vegetables; the popularity in the United States of certain imports from Mexico (beer, tequila, and avocados, for example); and Mexico’s growing seasons, which largely complement those of the United States. For example, many types of produce that the United States does not grow in winter are grown during that time in Mexico.
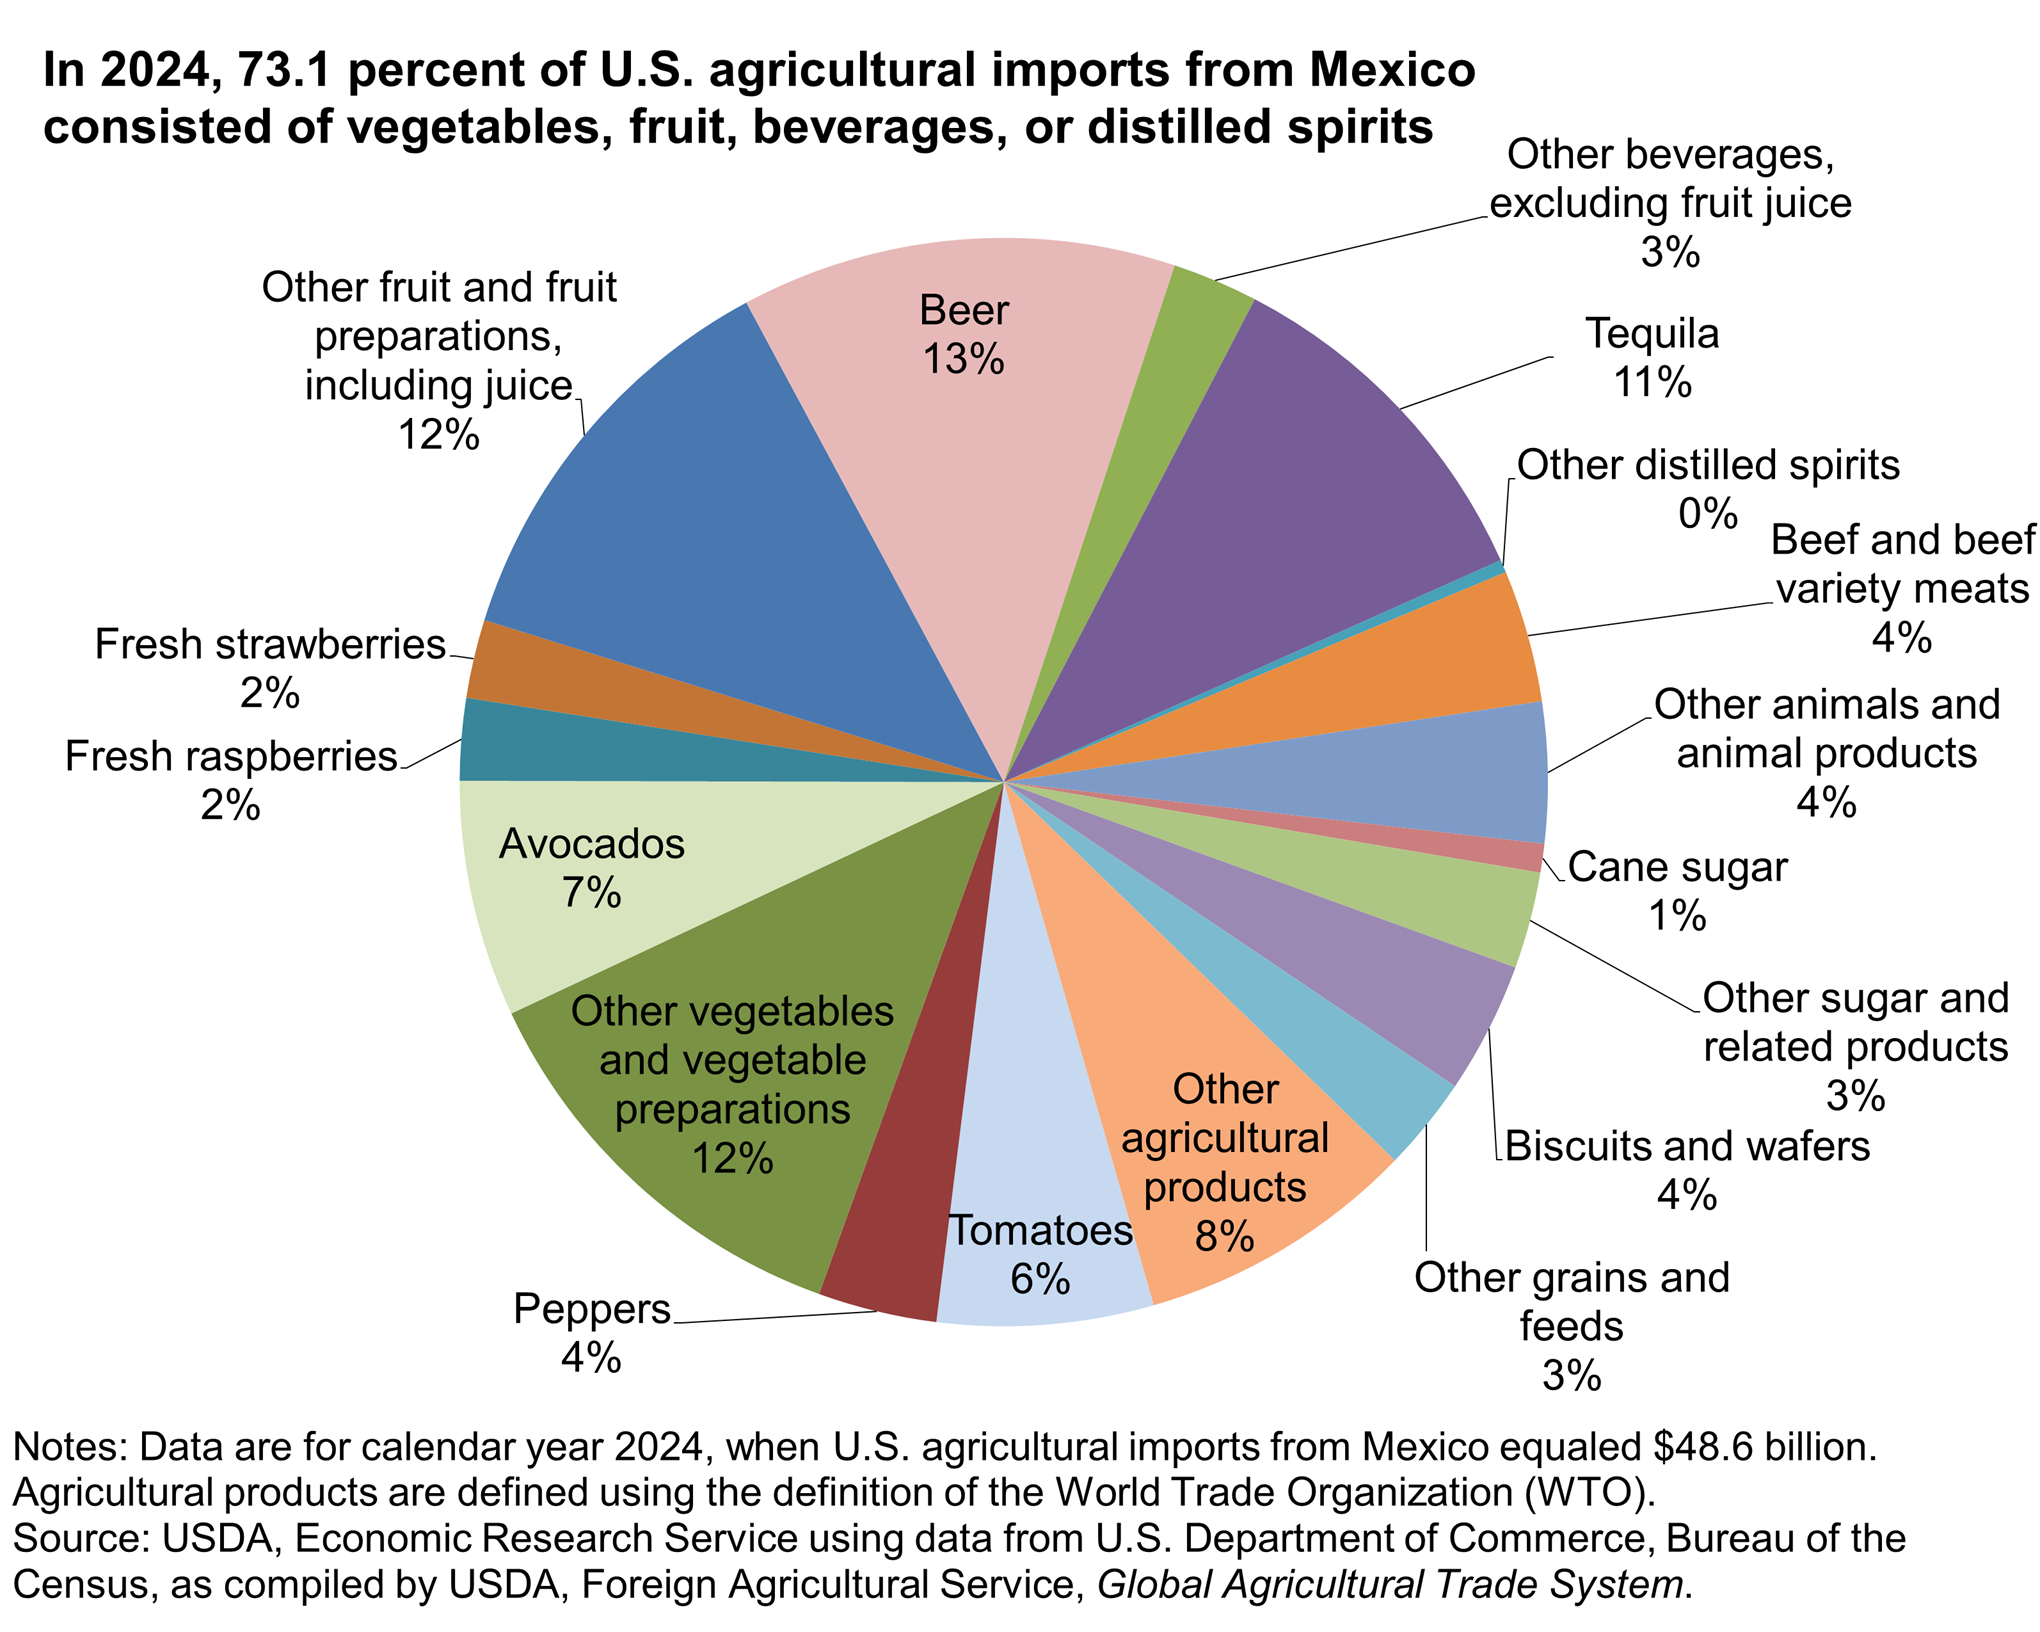
Download chart data in Excel format
Detailed table on selected U.S. agricultural imports from Mexico
To view more U.S.-Mexico agricultural trade statistics, go to USDA Foreign Agricultural Service's Global Agricultural Trade System.
Mexico: Foreign Direct Investment
In 2023, Mexico was the sixth-largest destination for U.S. direct investment in the food industry (after the United Kingdom, European Union, Australia, Canada, and Brazil) and has also attracted U.S. direct investment in its beverage industry. Many of these investments were initiated following implementation of the North American Free Trade Agreement (NAFTA) in 1994. That agreement contained provisions designed to facilitate foreign direct investment (FDI). These provisions include equal treatment of both foreign and domestic investors, and the prohibition of certain performance standards (such as a minimum amount of domestic content in production) for foreign investments. The United States-Mexico-Canada Agreement (USMCA), the trade accord that replaced NAFTA in July 2020, contains similar investment provisions. However, Mexico really began to open up to foreign investment in the 1980s, when the country first relaxed (and then eliminated) rules for most sectors of its economy that limited foreign ownership of Mexican businesses.
In 2023, U.S. direct investment in Mexico—on a historical-cost basis—was about $4.3 billion in the food industry, $6.3 billion in the beverage industry, and $3.5 billion in agriculture, fishing, forestry, and hunting (nominal figures, not adjusted for inflation; information from the U.S. Department of Commerce, Bureau of Economic Analysis (BEA)). Mexico also has substantial direct investment in the U.S. food industry—about $6.3 billion in 2023. According to BEA, “direct investment position at historical cost” is defined as a “measure of the value of direct investors’ equity in, and net outstanding loans to, their affiliates in which the direct investors’ investment is valued at book value. It largely reflects prices at the time of the investment rather than prices of the current period and is not ordinarily adjusted to reflect the changes in the current costs or the replacement costs of tangible assets or in stock market valuations of firms.”
U.S. direct investment in Mexico’s food and beverage industries expanded greatly during the first decade of NAFTA, growing from a total of about $2.3 billion in 1993 to about $10.9 billion in 2012. The total declined to about $6.8 billion in 2013. From 2013 to 2020, the total was in the neighborhood of $7 billion–$8 billion, but by 2023, the total had surged to $10.6 billion (see line graph below). Mergers and acquisitions in the beverage industry largely explain the decline in 2013 and the sharp rise in 2023.
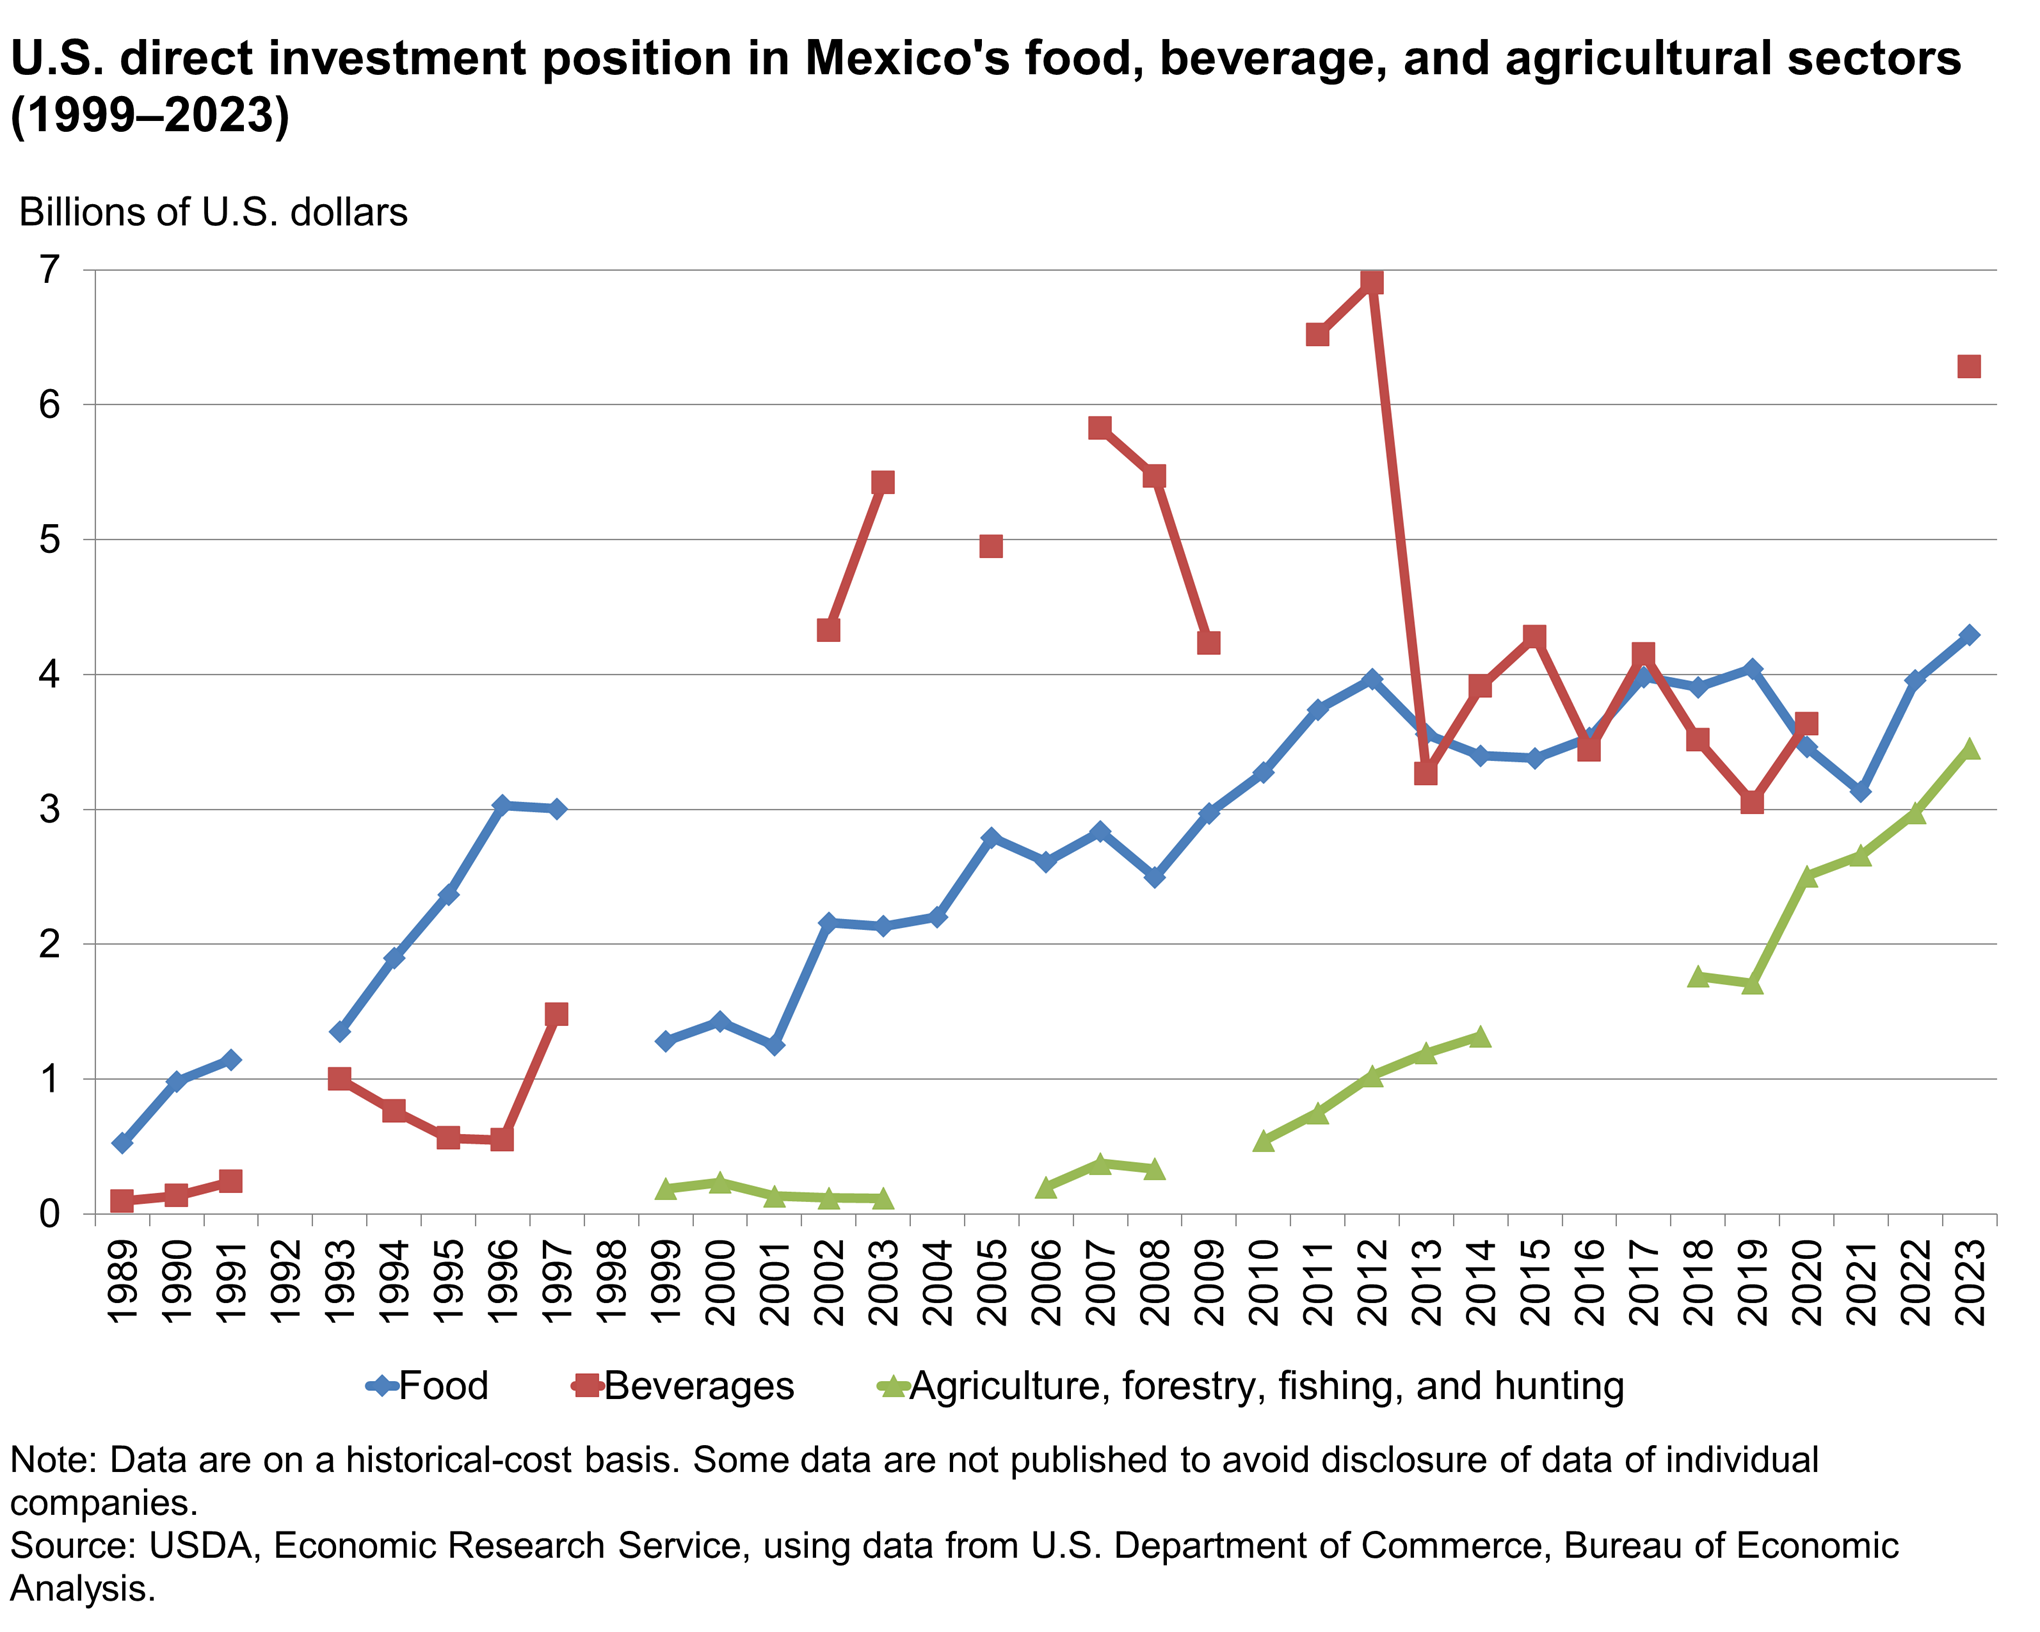
Download chart data in Excel format
Detailed table on selected U.S. direct investment position in Mexico