
Household Food Security in the United States in 2023
This page provides the following information:
- Trends in Prevalence Rates of Food Insecurity and Very Low Food Security in U.S. Households, 2001–23
- Report Contents
- Interpreting the Statistics
- Interactive Data Visualizations
- Related Amber Waves Articles
- USDA Information
- Additional Resources
- Getting It Right: Avoiding Common Misinterpretations of Food Security Statistics
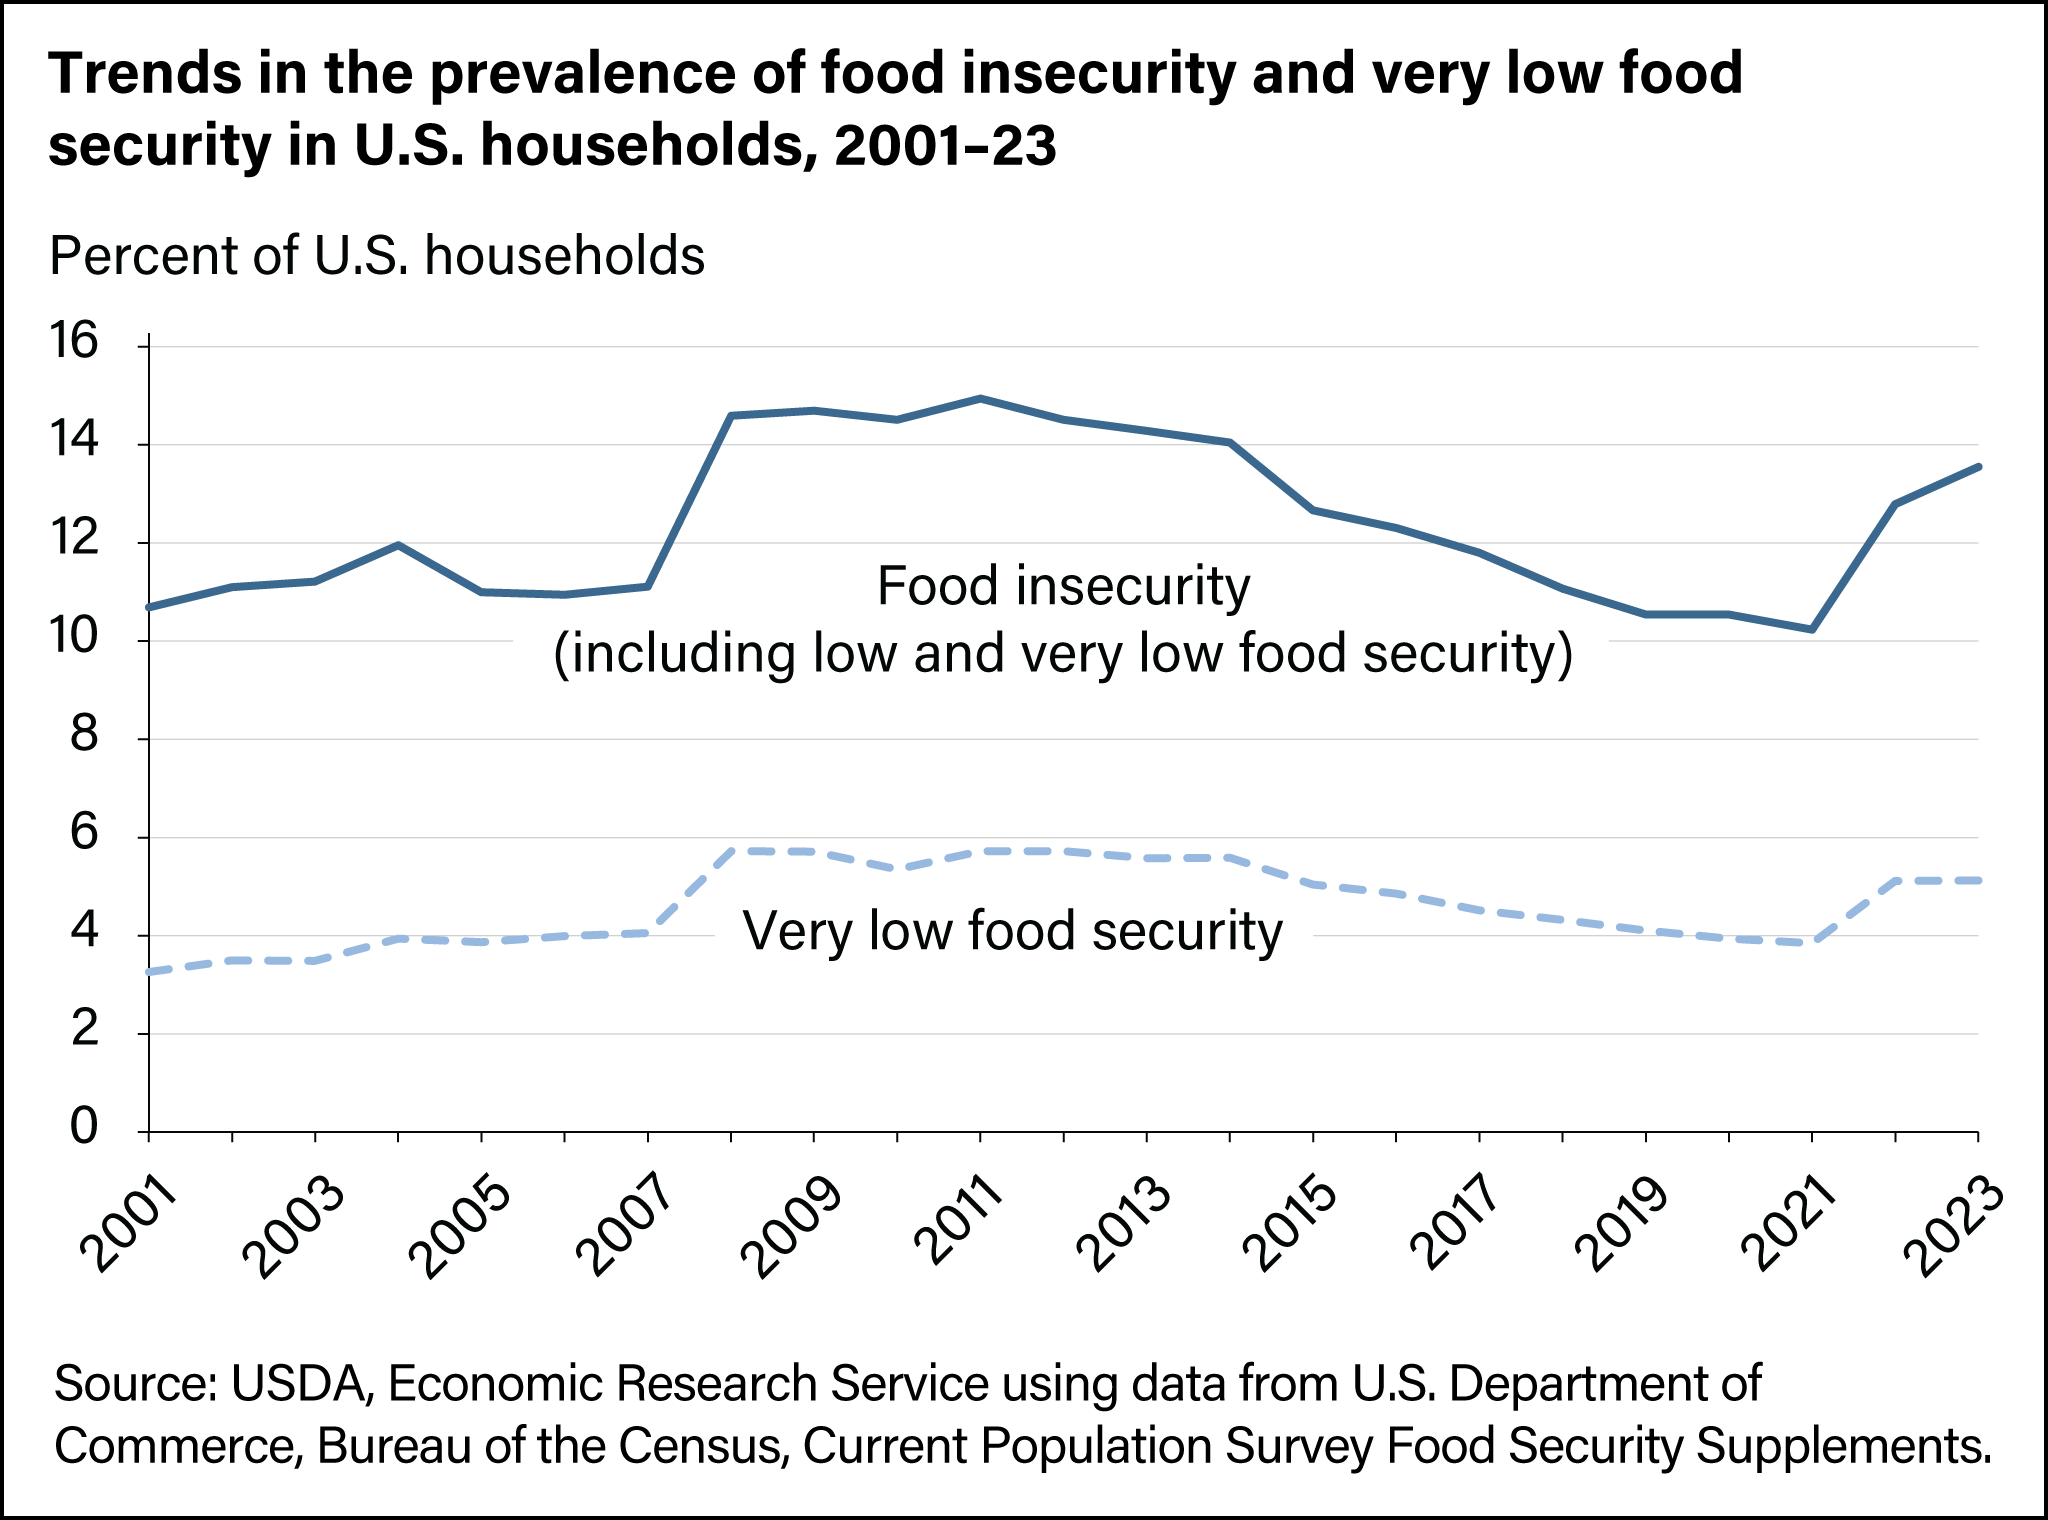
In 2023, 13.5 percent (18.0 million households) of U.S. households were food insecure. The 2023 prevalence rate was statistically significantly higher than the 12.8 percent (17.0 million households) in 2022. Food-insecure households—those with low and very low food security—had difficulty at some time during the year providing enough food for all their members due to a lack of resources.
In 2023, 5.1 percent (6.8 million households) of U.S. households had very low food security. The 2023 prevalence of very low food security was statistically unchanged from the 5.1 percent (6.8 million households) in 2022. In this more severe range of food insecurity, the food intake of some household members was reduced and normal eating patterns were disrupted at times during the year due to limited resources.
Report contents:
- Household Food Security in the United States in 2023
- Statistical Supplement to Household Food Security in the United States in 2023
Food Security in the U.S. topic page
Interpreting the statistics:
- Getting It Right: Avoiding Common Misinterpretations of the Data
- Survey Questions Used by USDA to Assess Household Food Security
Interactive data visualizations:
Related Amber Waves articles:
- “One-Third of Households With Children Paying for School Meals Reported That Doing So Contributed to Financial Hardship,” Amber Waves, September 2023.
- “U.S. Food and Nutrition Assistance Programs Continued To Respond to Economic and Public Health Conditions in Fiscal Year 2022,” Amber Waves, August 2023.
- “Food Insecurity Decreased for U.S. Households With Children in 2021, but Increased for Households Without Children,” Amber Waves, November 2022.
- “Food Insecurity for Households With Children Rose in 2020, Disrupting Decade-long Decline,” Amber Waves, February 2022.
- “Food Pantry Use Increased in 2020 for Most Types of U.S. Households,” Amber Waves, November 2021.
- “Coronavirus (COVID-19) Pandemic Transformed the U.S. Federal Food and Nutrition Assistance Landscape,” Amber Waves, October 2021.
- “Updated Food Access Research Atlas Now Maps Changes in Low-Income and Low-Supermarket Access Areas in 2019,” Amber Waves, June 2021.
- “USDA School Meals Support Food Security and Good Nutrition,” Amber Waves, May 2021.
- "Food-Insecure Households Score Lower on Diet Quality Compared to Food-Secure Households," Amber Waves, March 2020.
- "Commemorating 20 Years of U.S. Food Security Measurement," Amber Waves, October 2015.
- “Inflation and Higher Food Prices Kept Food Insecurity Rates Relatively High After the 2007-09 Recession,” Amber Waves, December 2014.
- "Effects of Changes in SNAP Benefits on Food Security," Amber Waves, October 2013.
USDA information:
- USDA's Food and Nutrition Service oversees the administration of 15 nutrition assistance programs.
- FNS Partnerships provides guidance on addressing hunger in communities and ways to partner with USDA, Food and Nutrition Service (FNS).
- USDA Nutrition Security provides information on USDA work related to nutrition security.
Additional resources:
- ERS Nutrition Security Research Resources
- ERS Racial and Social Equity Research Resources
- ERS Coronavirus (COVID-19) Media Resources
- ERS COVID-19 Economic Implications for Agriculture, Food, and Rural America: Food and Consumers
- Additional ERS publications related to food security in the U.S. can be found on the ERS Publications page
Getting It Right: Avoiding Common Misinterpretations of Food Security Statistics
USDA monitors the food security of U.S. households to support evidence-based policy and program development. The following is intended to help journalists avoid common misinterpretations of these statistics.
Challenges in Communicating Food Security Statistics
USDA uses descriptions based on the concept of "food security" to report results of its annual survey. These descriptions are consistent with the content of the food security survey questions and follow a 2006 recommendation by the National Academies' Committee on National Statistics to avoid using the word "hunger"—a physiological term—to describe severe food insecurity.
These descriptions also avoid inconsistencies of interpretation inherent with the term "hunger" in the United States. A nationally representative survey in 2007, for example, revealed a wide range of views about what conditions the government should describe as "hunger" in official reports. On the one hand, nearly half of respondents thought the inability to afford nutritious meals, even without any more severe indications, might be hunger. At the other extreme, nearly one in six were not sure that the most severe conditions described in the survey ("Could not afford to eat enough on several days, felt weak and dizzy and got sick and lost weight as a result") should be called "hunger."
A Short Primer on Terminology
Food-secure households have consistent access throughout the year to adequate food for active healthy living for all household members.
Food-insecure households, at some time during the year, lack that access. These are households with low food security or very low food security.
Households with low food security make up the majority of food-insecure households. These households manage to get enough to eat but reduce the quality, variety, or desirability of their meals to do so. Members of these households are at elevated risk for a number of problematic health and developmental conditions, but because they do not substantially reduce the amount of food they eat, they are not likely to suffer from hunger in the sense of the uneasy or painful sensation caused by lack of food.
Households with very low food security—the more severe condition—make up slightly more than one-third of food-insecure households. In these households, at least some members (usually only adults) reduce the amount of food they eat below usual levels and below the amount they consider appropriate. In most of these households, the adult respondent reports that in the past 12 months he or she was hungry and did not eat because there wasn't enough money for food. If these conditions extend to children along with adults, the household is classified as having very low food security among children, the most severe range of food insecurity reported by USDA.
Common Misinterpretations of Food Security Statistics
The most common misinterpretations fall into four categories. Three overstate the seriousness of the problem, and one understates it.
1. Overstating the severity of the condition represented by a statistic:
Example—incorrect: In November 2009, a prominent national online news source reported, "A Department of Agriculture report...said the number of Americans that were hungry rose to 14.6 percent."
Discussion/comment: Food insecure does not always mean "hungry." The 14.6 percent was actually the percentage of households that were food insecure in 2008. "Were hungry" describes a more severe condition, and most U.S. adults would not consider conditions in most food-insecure households to be appropriately described as such (for a discussion of U.S. adults’ perception of what “hunger” means, see “What Should the Government Mean by Hunger?”, by Mark Nord, Max Finberg, and James McLaughlin, in Journal of Hunger & Environmental Nutrition, 4:20-47, 2009.
Alternative, accurate language (updated to 2023 statistics): "In 2023, 13.5 percent of U.S. households were unable to put adequate food on the table at times during the year." (Further description may clarify that for most food-insecure households, the inadequacies were in the form of reduced quality and variety of food rather than insufficient quantity.)
2. Overstating the number of food insecure persons by attributing a household's food insecurity to every individual in the household:
Example—incorrect: In 2009, a prominent national newspaper reported: "… the number of youngsters who sometimes were outright hungry rose from nearly 700,000 to almost 1.1 million."
Discussion/comment: These numbers actually represent children living in households with very low food security among children—that is, where at least one child experienced a severe level of food insecurity. But describing all the children in those households as having very low food security, or as being "outright hungry," overstates the prevalence of the condition. It is not necessarily the case that all persons living in a household with very low food security experience the same effects of that condition. In some households with very low food security among children, for instance, the younger children were not affected to that extent.
Alternative, accurate language (updated to 2023 statistics): "In 2023, 841,000 children lived in households where one or more of the children experienced very low food security."
3. Overstating the frequency of food-insecure conditions:
Example—incorrect: A few years ago, an advocacy organization in a widely publicized statement described a USDA statistic as representing children "going to bed hungry every night."
Discussion/comment: A common misinterpretation is to cite a statistic and describe the corresponding conditions as occurring every day. When food insecurity occurs in U.S. households, it is usually periodic or occasional rather than persistent or chronic. The food security scale is designed to register even a single episode of food insecurity during the year. Most questions in the survey begin: "In the last 12 months, did you ever…?"
Alternative, accurate language: Describing children as "being hungry at some time during the year" would have been a more accurate representation of the statistic.
4. Understating the severity of food insecurity by misrepresenting how households are classified:
Example—incorrect: A 2009 op-ed column in a prominent national newspaper stated, "The first question [in the food security survey] was whether the respondent had ever 'worried' about running out of food in the previous 12 months—not actually run out of food, just worried about it. A 'yes' answer counts as 'food insecurity.'"
Discussion/comment: Households that report only worrying about running out of food are not classified as food insecure. To be classified as food insecure, respondents must also say "yes" to at least two other questions about conditions more severe than worrying.