



Suggested citation for linking to this discussion:
U.S. Department of Agriculture, Economic Research Service. (2025, February 6). Farm sector income & finances: Assets, debt, and wealth.
Farm Sector Equity (Wealth) Forecast To Continue To Grow in 2025
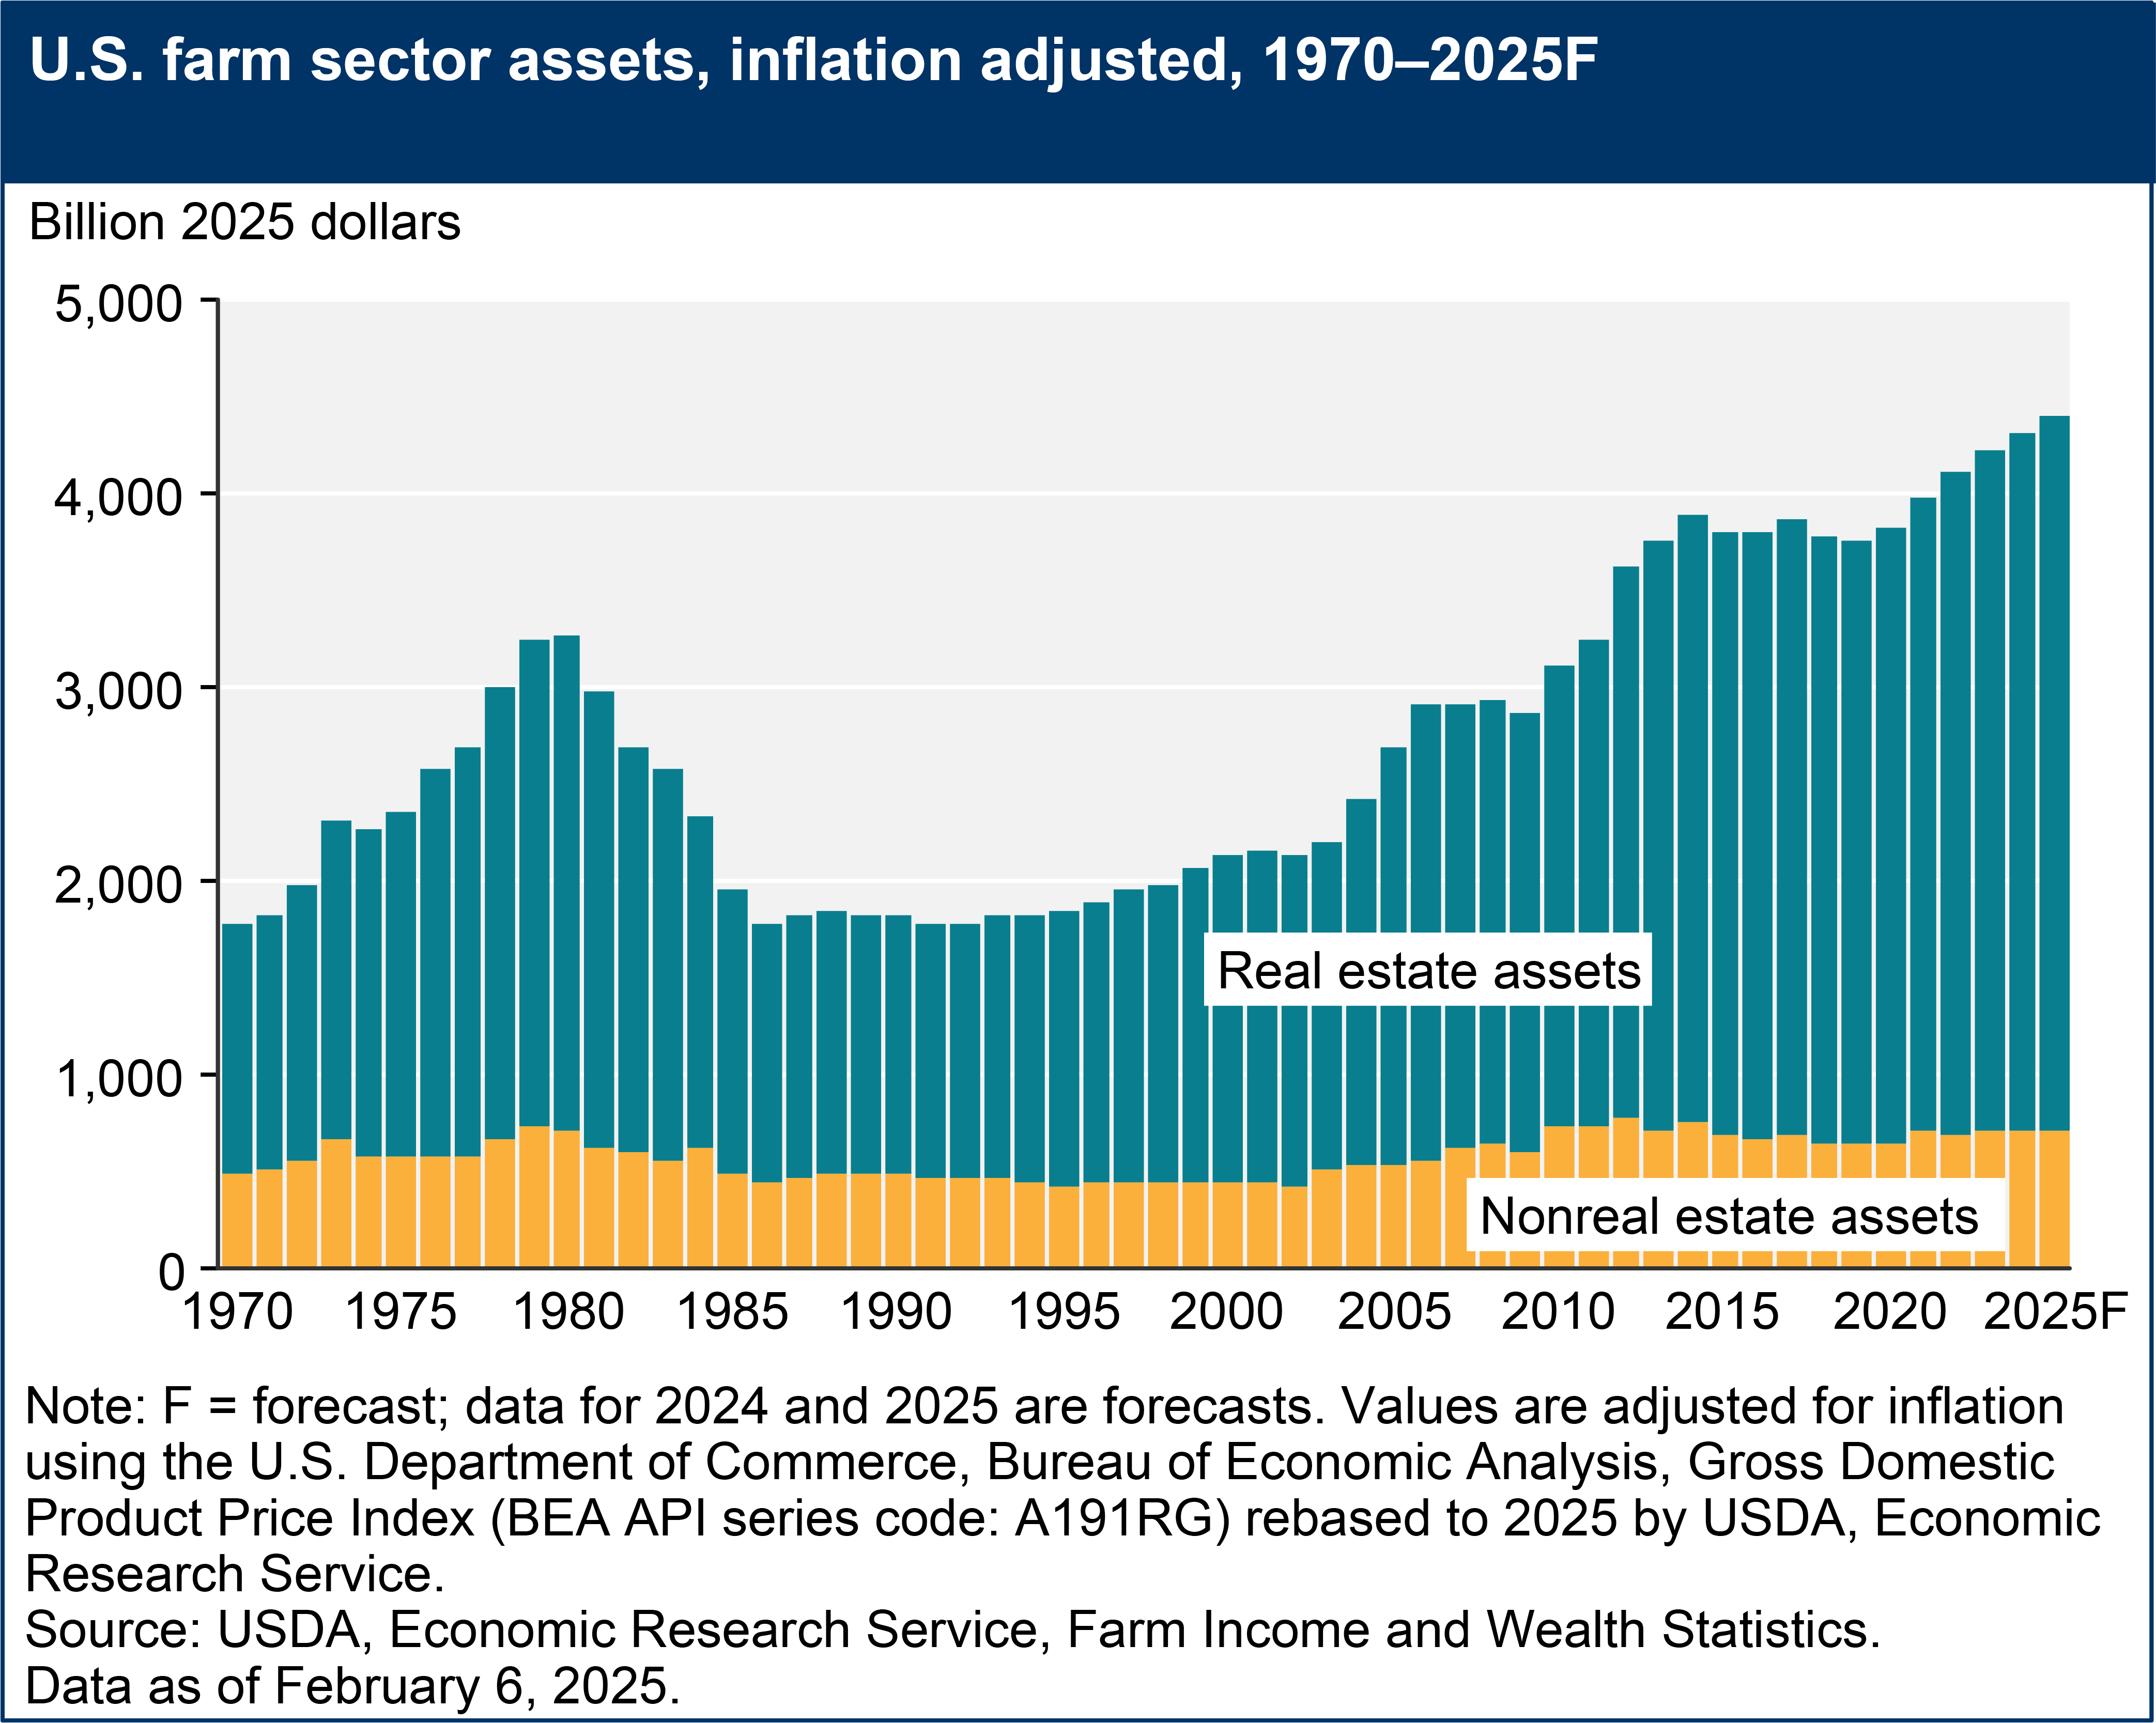
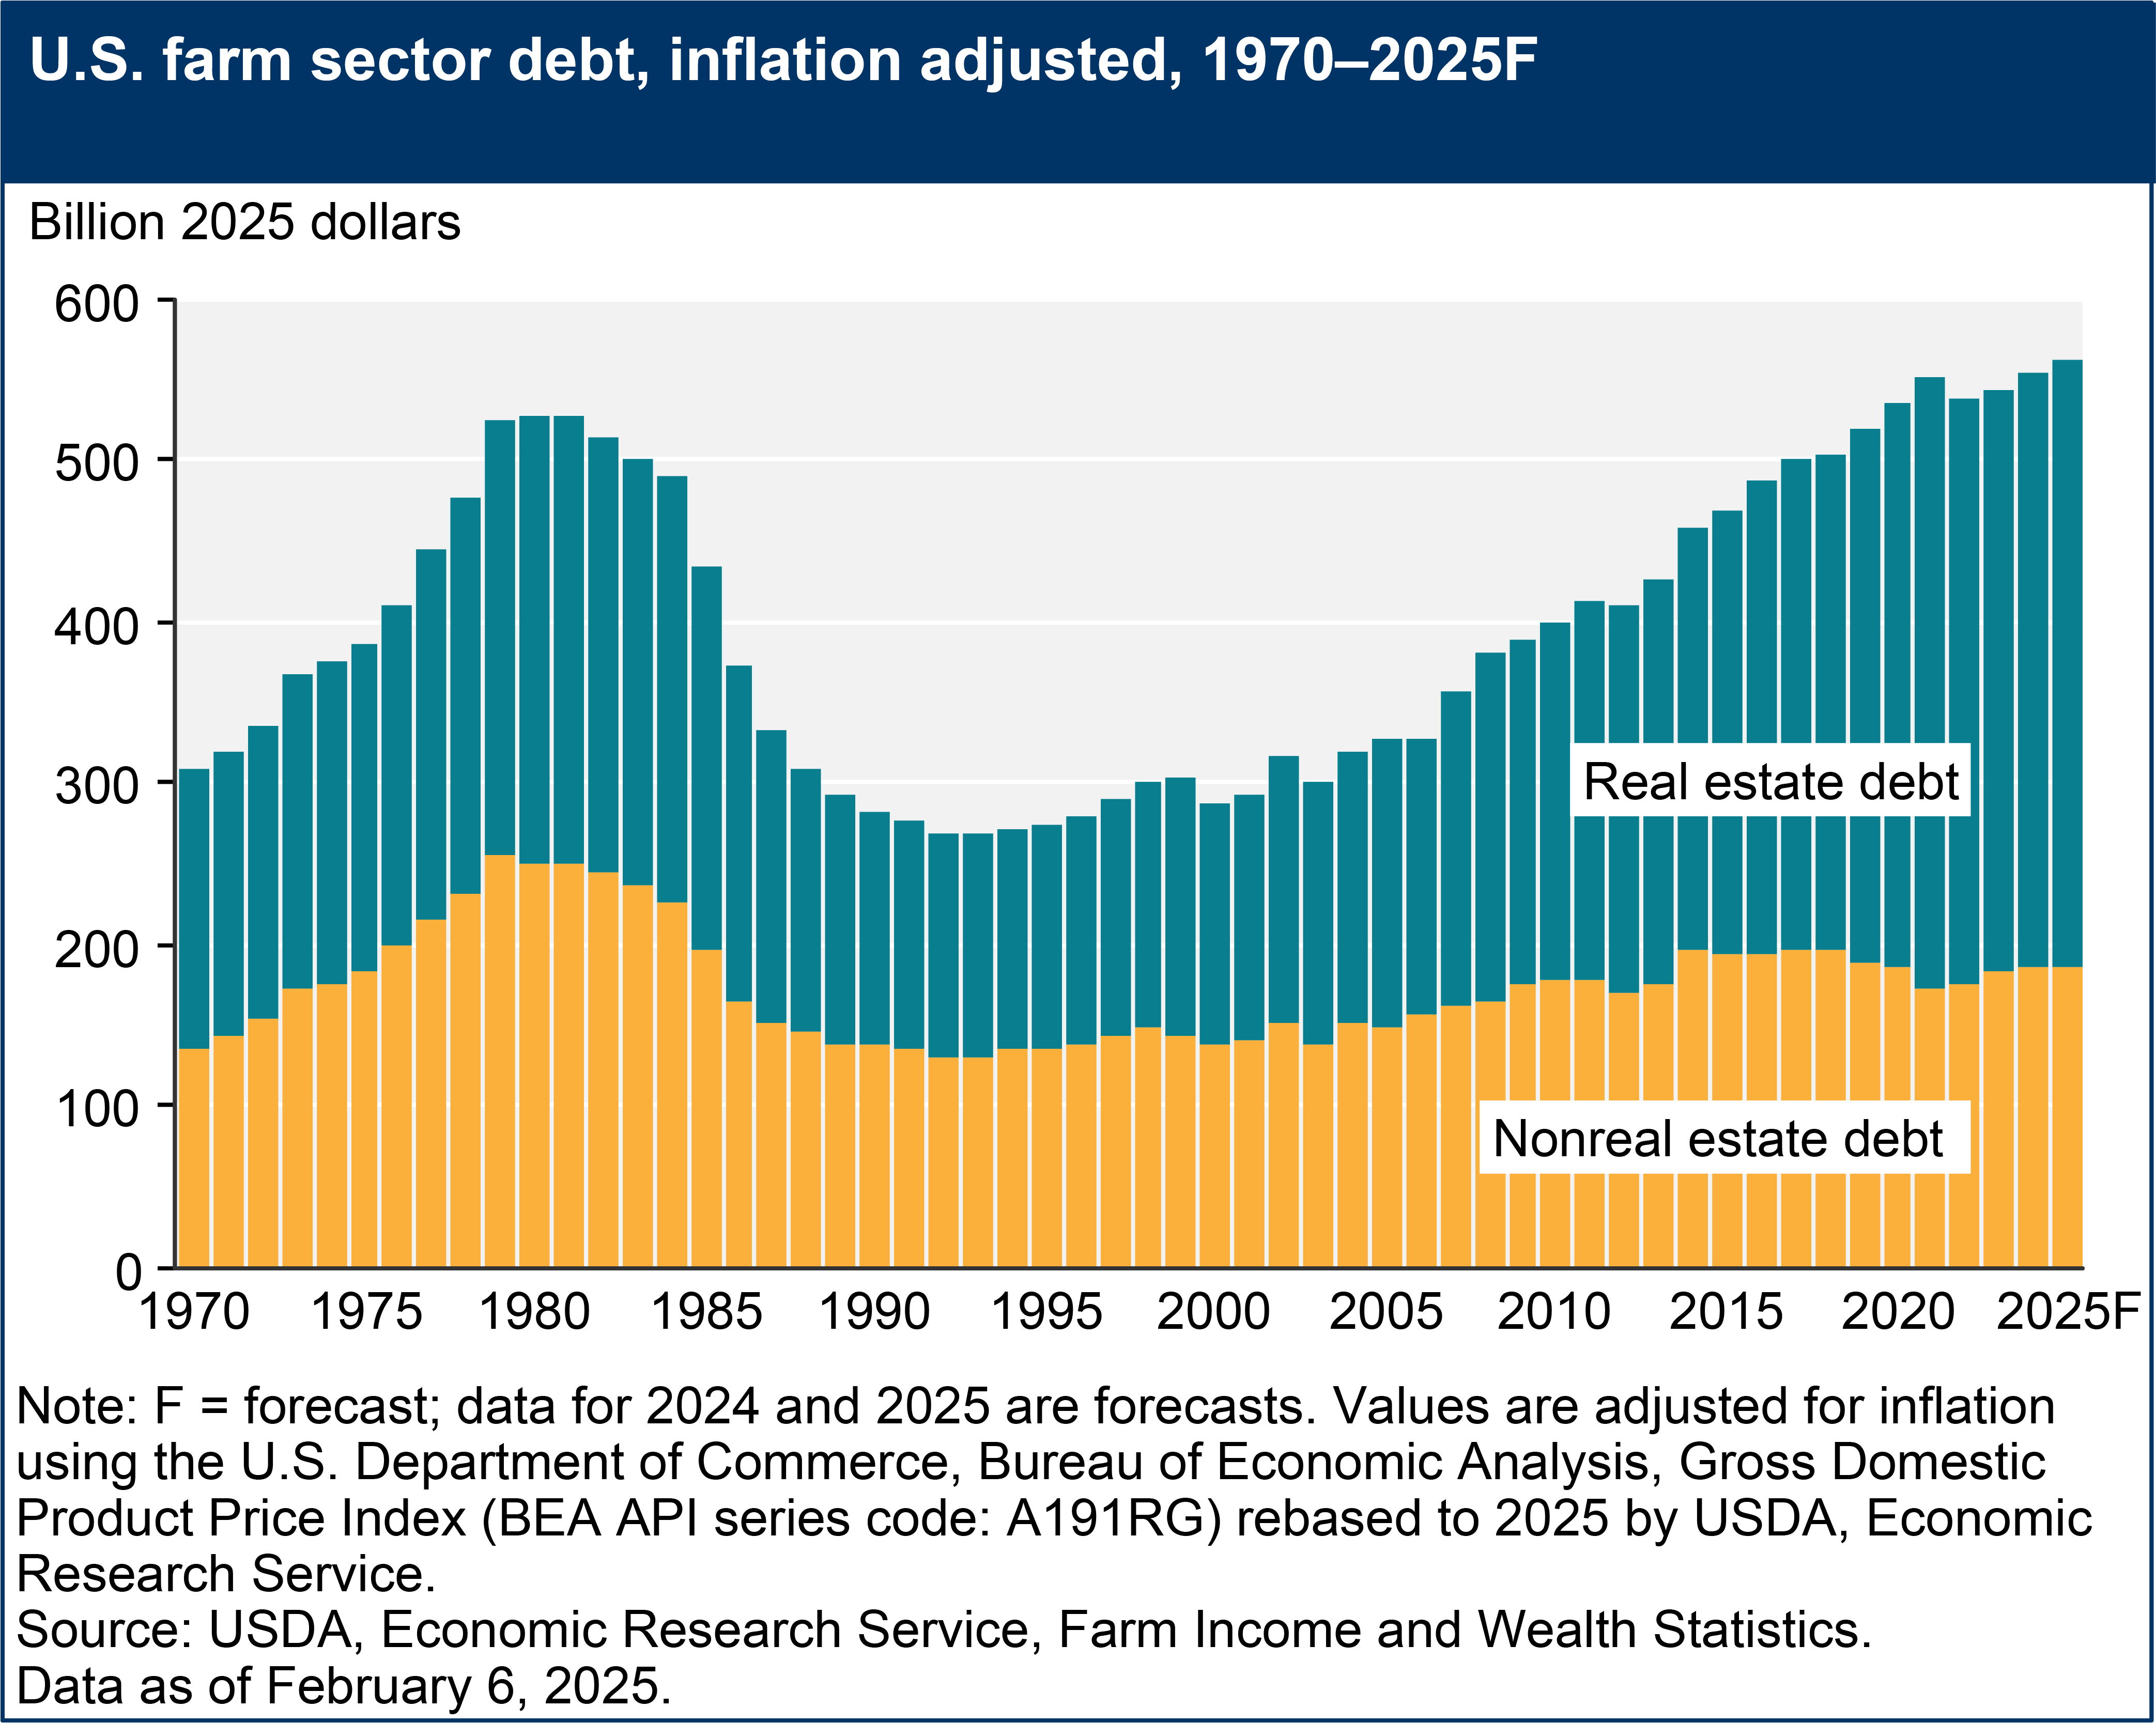
Farm sector equity, the difference between farm sector total assets and total debt, is forecast to rise to $3.83 trillion in 2025, a 4.3-percent increase relative to 2024 in nominal dollars. This follows a forecast increase of 5.2 percent from 2023 to 2024. The farm sector assets are expected to increase 4.2 percent to reach $4.40 trillion in 2025 after increasing by 5.1 percent in 2024 from 2023. The farm sector debt is expected to increase 3.7 percent to reach $561.8 billion in 2025 after increasing by 4.4 percent in 2024 from 2023. After adjusting for inflation, in 2025, farm sector equity, assets, and debt are forecast to increase by 1.8 percent, 1.7 percent, and 1.2 percent, respectively. This follows a forecast increase of farm sector equity, assets, and debt by 2.7 percent, 2.6 percent, and 1.9 percent, respectively, in 2024 relative to 2023.
See the full balance sheet details, including the current/noncurrent balance sheet and selected financial ratios. A summary of the balance sheet is available in the table U.S. farm sector financial indicators, 2018–2025F.
Farm real estate assets, land and its attachments, are forecast to be $3.67 trillion in 2025, a 4.3-percent increase from 2024 in nominal dollars (1.8 percent in inflation-adjusted dollars), representing 84 percent of total farm sector assets. In 2024, real estate assets are forecast to increase by 5.5 percent in nominal dollars (3.0 percent in inflation-adjusted dollars) relative to 2023. Nonreal estate assets include the value of investments and other financial assets, inventories of crops and animals, purchased inputs, and machinery/vehicles. Nonreal estate assets are expected to increase 3.7 percent in 2025 in nominal dollars after increasing by 3.1 percent in 2024 relative to 2023. In inflation-adjusted dollars, nonreal estate assets are forecast to increase by 1.2 percent in 2025 after increasing slightly in 2024 relative to 2023.
Download chart image | Chart data
Total farm sector debt is forecast to increase in 2024 and 2025 relative to previous years with increases forecast for both real estate and nonreal estate debt. Farm real estate debt is expected to reach $374.2 billion in 2025, a 3.9-percent increase in nominal dollars (1.4-percent increase in inflation-adjusted dollars). This follows a forecast increase in 2024 real estate debt of 4.5 percent in nominal dollars (2.0 percent in inflation-adjusted dollars) compared with 2023. Farm nonreal estate debt is expected to reach $187.6 billion in 2025, a 3.2-percent increase in nominal terms and a 0.8-percent increase in inflation-adjusted dollars. This follows a forecast increase in 2024 nonreal estate debt of 4.2 percent in nominal dollars (1.7 percent in inflation-adjusted dollars) compared with 2023.
Download chart image | Chart data
Farm Sector Solvency To Improve Slightly in 2024 and 2025, and Liquidity To Rise in 2025 Following a Decline in 2024
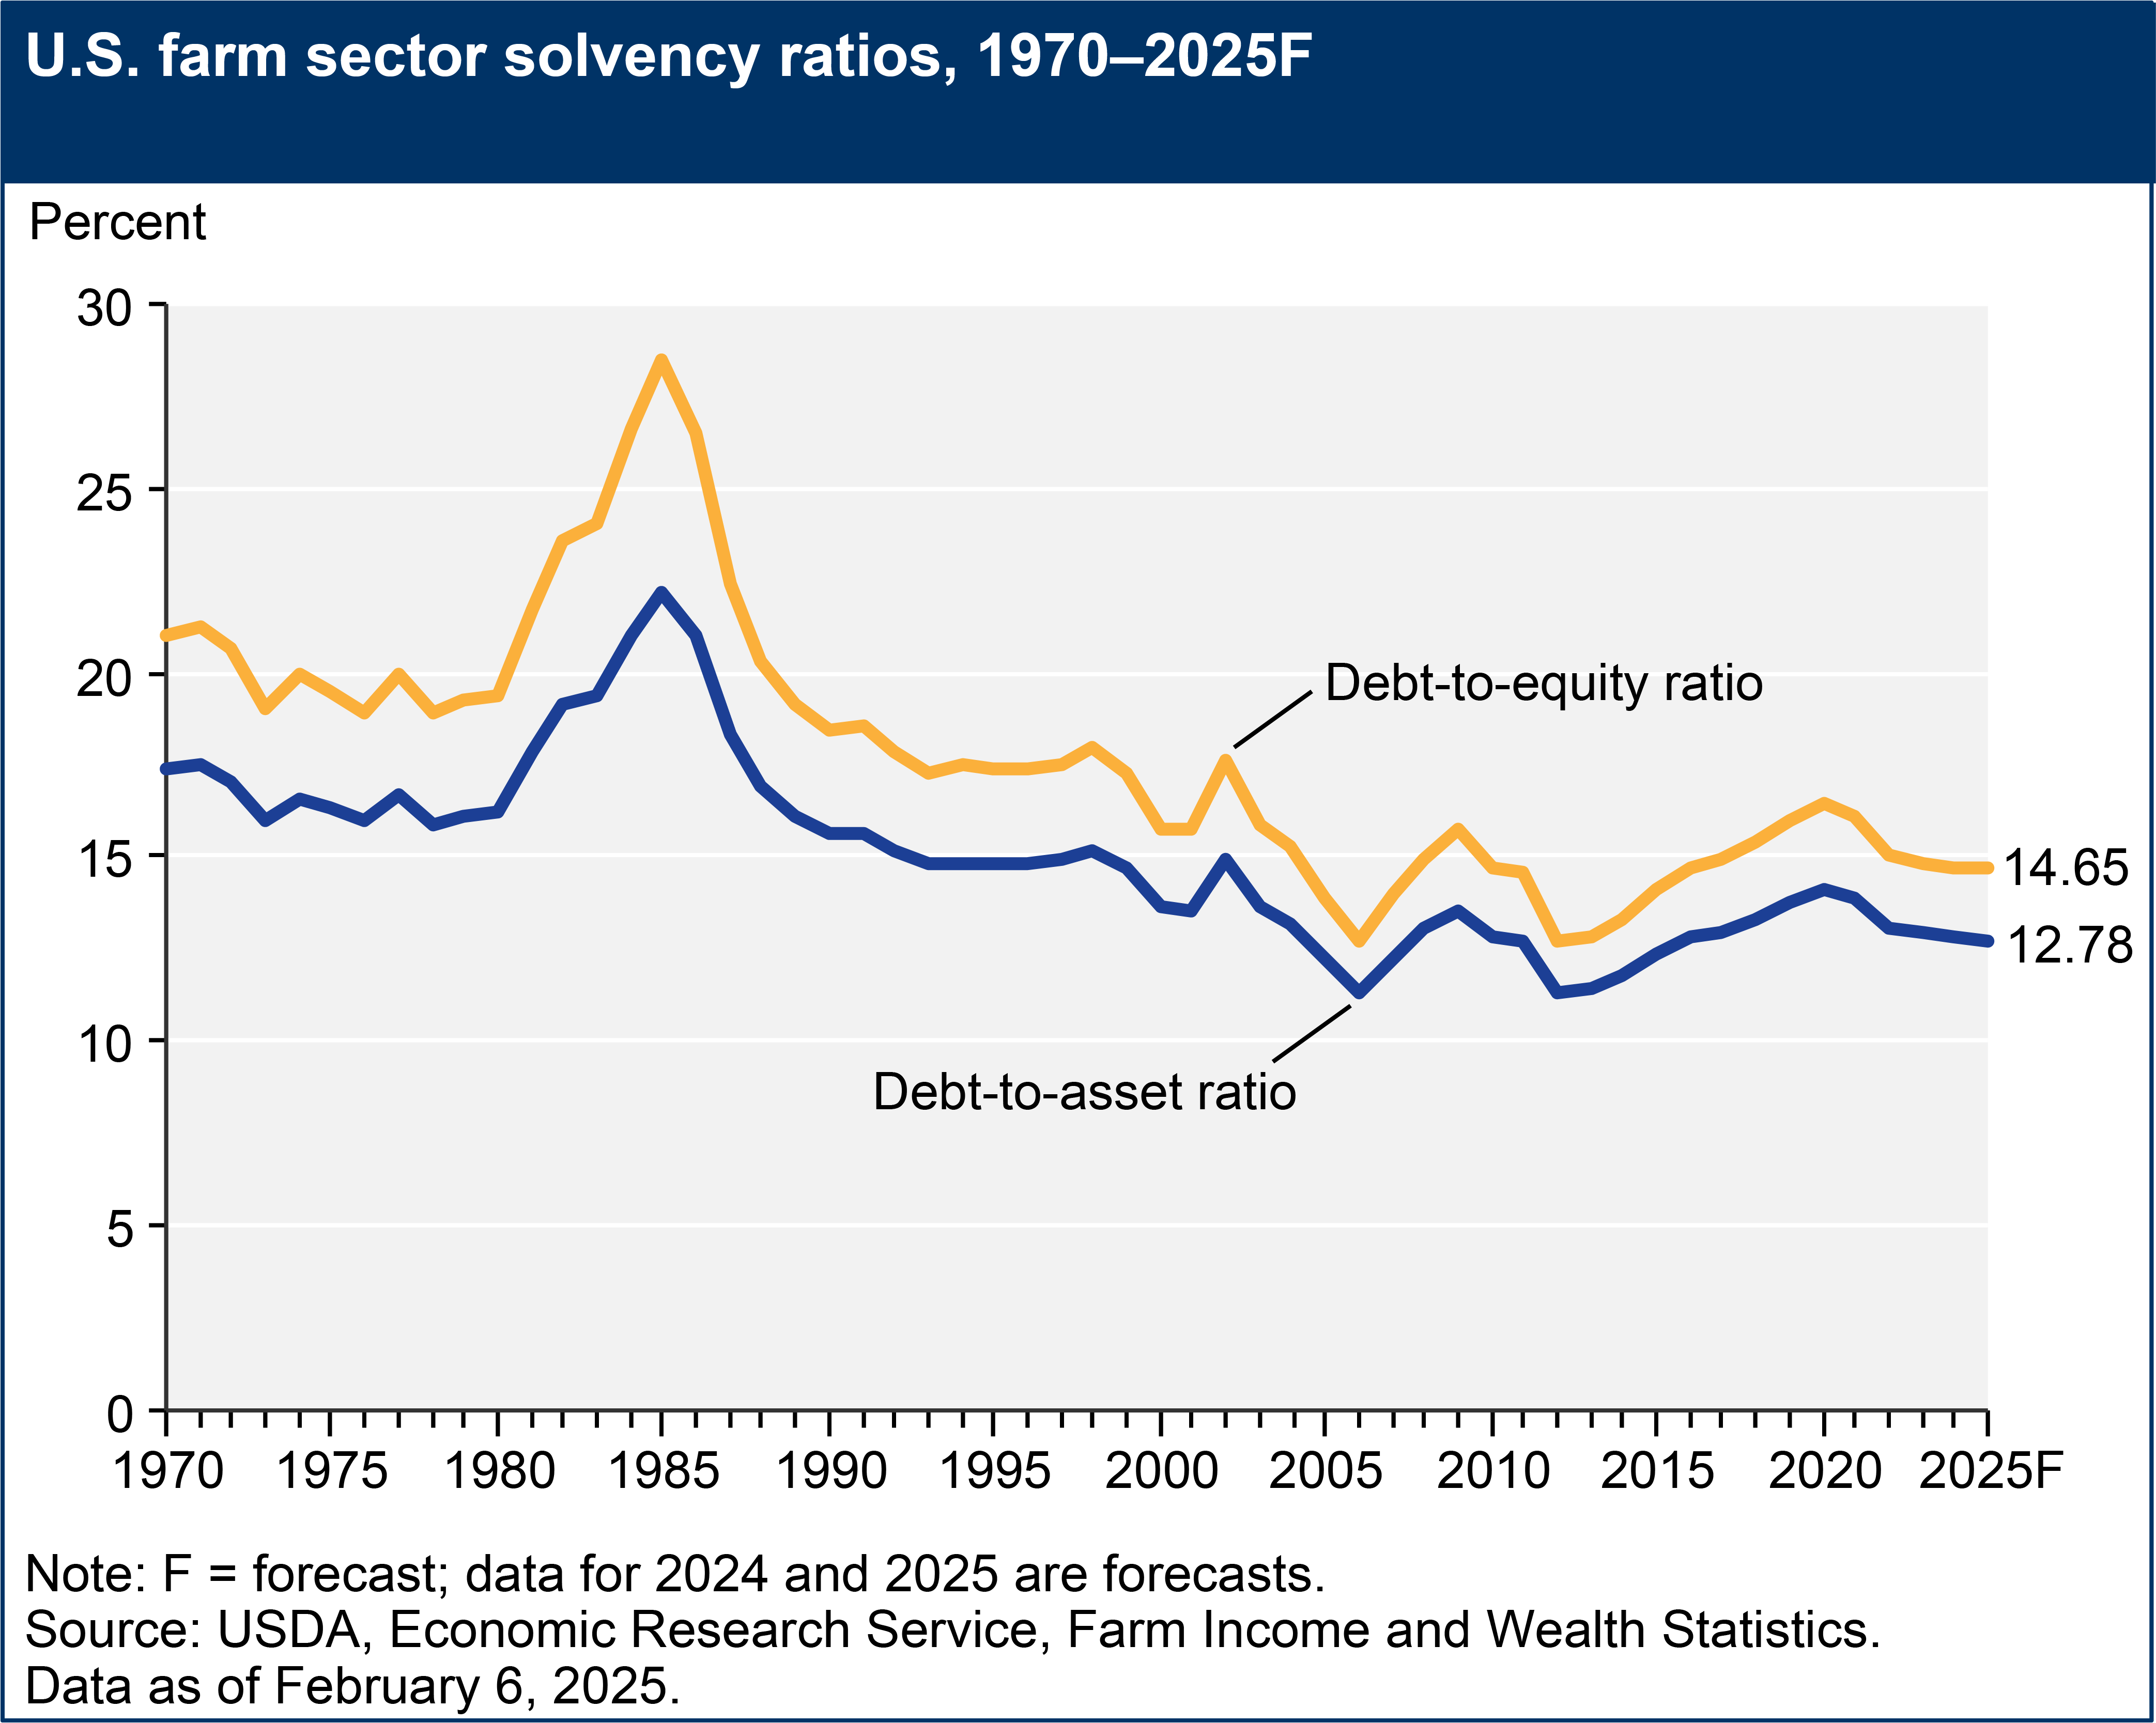
Solvency is a measure of the ability of a farm or ranch operation to satisfy its debt obligations when due. Popular measures of solvency include the debt-to-asset ratio and debt-to-equity ratio. Lower values for these ratios are preferred. In 2024 and 2025, these ratios are expected to go down slightly because debt is forecast to grow at a slower rate than assets in both years. The debt-to-asset ratio is forecast to decrease from 12.93 percent in 2023 to 12.84 percent in 2024 and further decrease to 12.78 percent in 2025. The debt-to-equity ratio is expected to decrease from 14.85 percent in 2023 to 14.74 percent in 2024 and further decrease to 14.65 percent in 2025.
Liquidity is the ability to transform or convert assets to cash quickly to satisfy short-term obligations when due without a material loss of value or price of the asset. USDA uses several financial metrics to evaluate farm sector liquidity. One measure is working capital, which measures the amount of cash available to fund operating expenses after paying off debt to creditors due within 12 months (current debt). In 2025, working capital is forecast to increase 3.9 percent from 2024 in nominal dollars (1.5 percent in inflation-adjusted dollars). This follows a forecast decrease of 6.7 percent nominally (9.0 percent in inflation-adjusted dollars) in 2024 compared with 2023. Other liquidity measures such as the current ratio and debt service ratio are also forecast to improve in 2025. The current ratio measures the ability of current assets, if sold and converted to cash, to cover current debt obligations. The debt service ratio measures the share of production plus direct Government payments used for debt payments.
See more about financial ratios in the Documentation for the Farm Sector Financial Ratios.
Download chart image | Chart data
A Note on Farm Balance Sheet Estimates and Forecasts
The farm sector balance sheet provides a market value estimate and forecast of farm sector assets, debts/other liabilities, and wealth (e.g., equity or net worth) as of December 31 of the current calendar year. It differs from individual business and corporate balance sheet accounts that are based on historical cost accounting concepts. For example, historical cost-based balance sheets show capital assets such as farm machinery and equipment at their original cost less accumulated depreciation. The objective of the farm sector balance sheet is to estimate or forecast the value of assets if sold in today's marketplace.