Skip to main content

Official websites use .gov
A .gov website belongs to an official government organization in the United States.

Secure .gov websites use HTTPS
A lock ( ) or https:// means you’ve safely connected to the .gov website. Share sensitive information only on official, secure websites.

Farm & Commodity Policy - Farm Bill Spending

Note: Get ERS analysis of the 2018 Farm Bill

The Farm Bill consists of 12 titles that shape Federal policy across food assistance, farm income support, conservation, and other key agricultural topic areas. In this policy context, the One Big Beautiful Bill Act (OBBBA), signed into law on July 4, 2025, introduced updates affecting future agriculture focused spending.

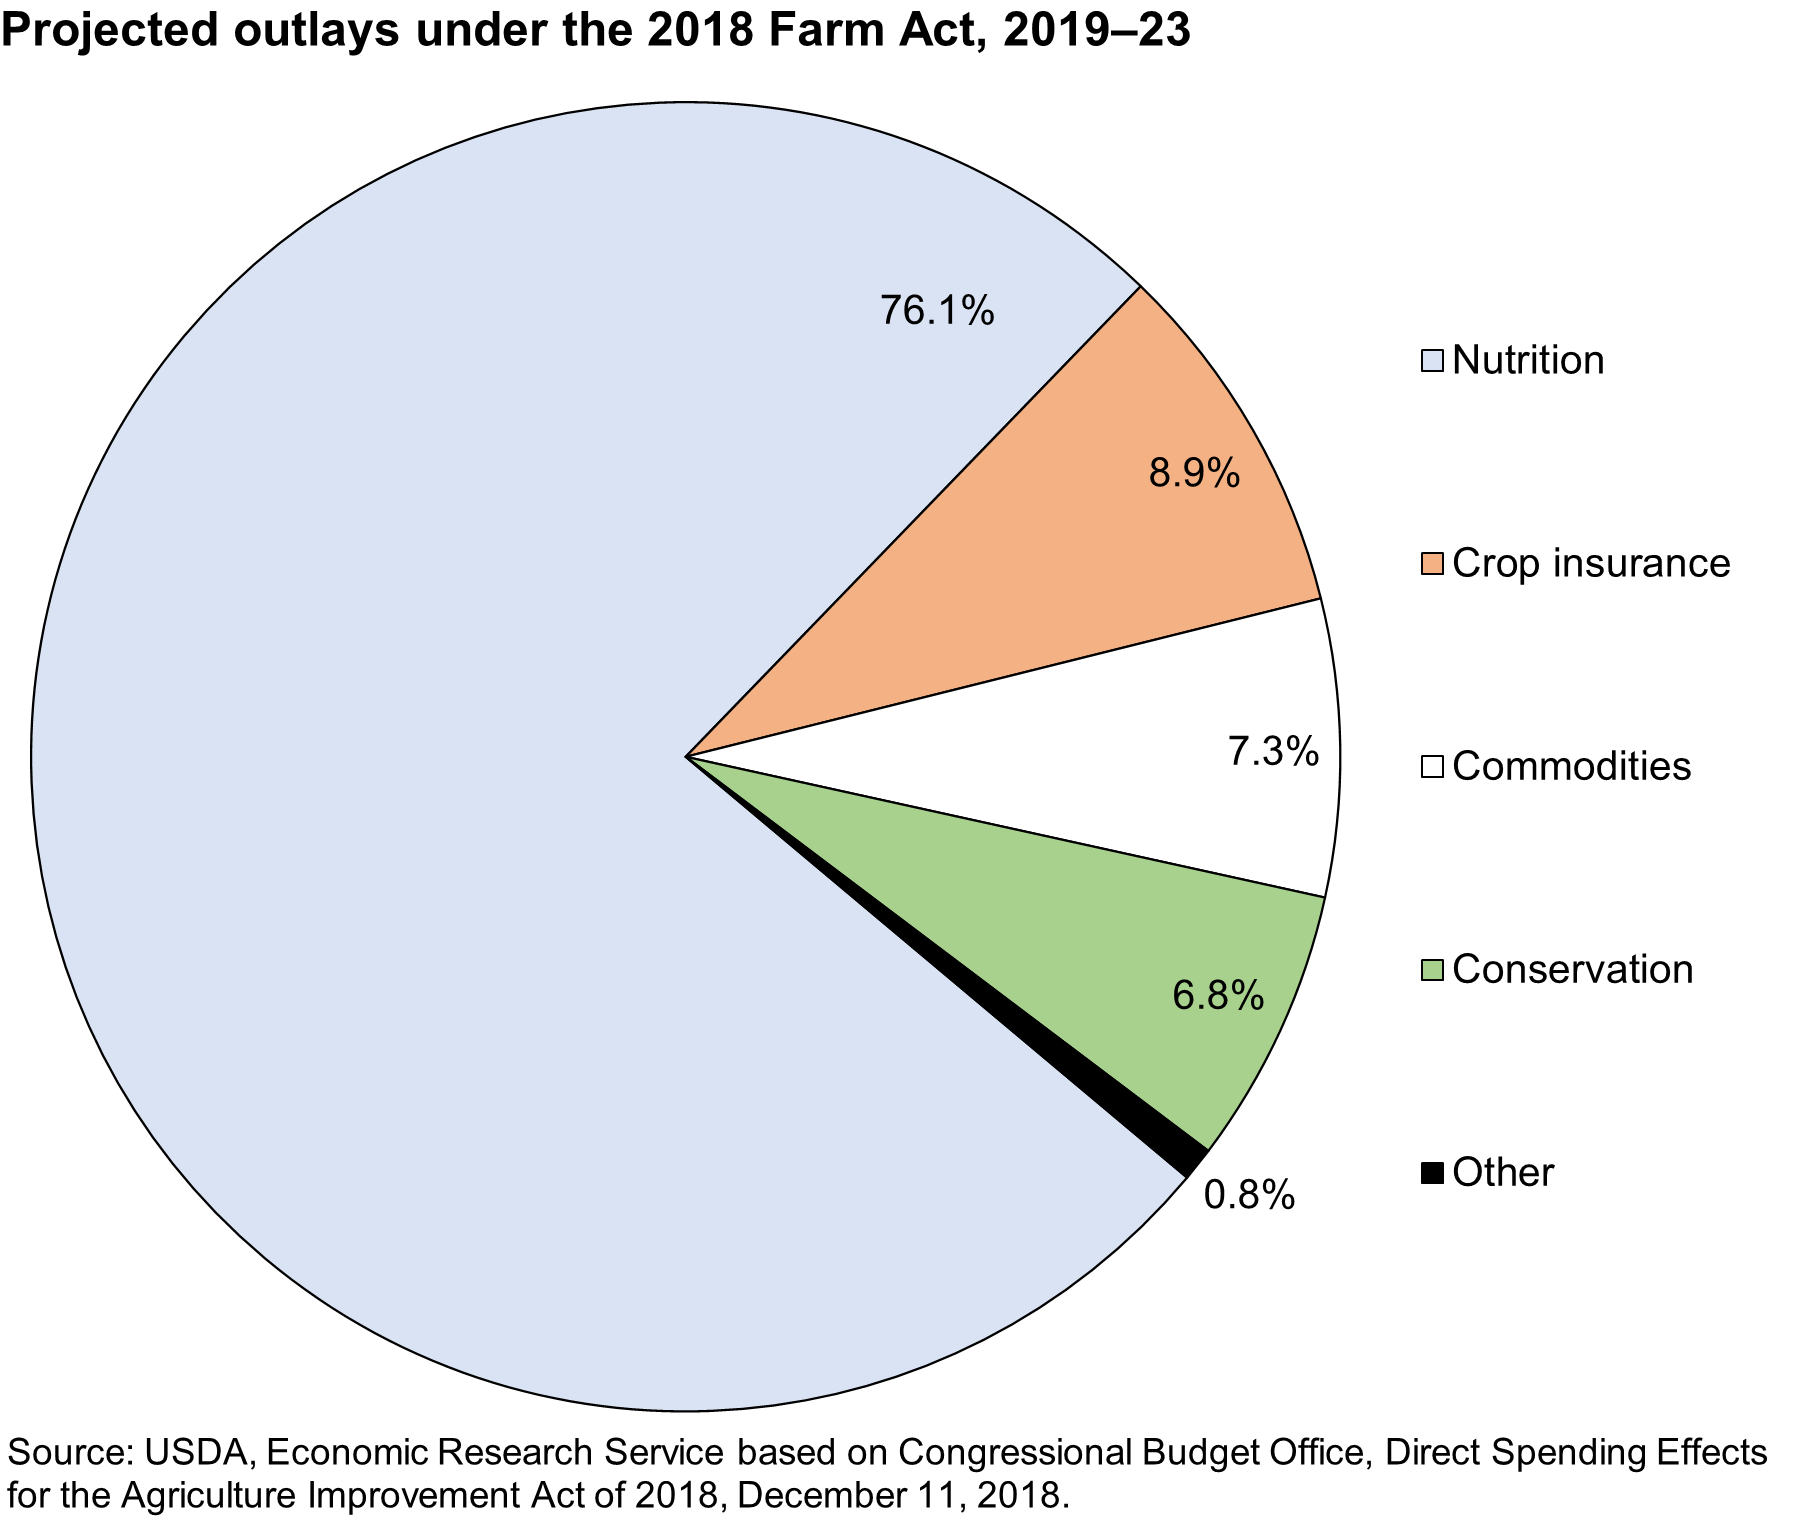
Of the $1.4 trillion in the Congressional Budget Office’s baseline projected outlays (2027–36) for farm and nutrition programs, nutrition programs account for more than 70 percent—with most of the remaining spending directed to crop insurance, commodity programs, and conservation. The outlay projections help illustrate how mandatory programs continue to drive the overall spending pattern across Farm Bill cycles, even as specific program authorities evolve over time.

Of the $1.4 trillion in the Congressional Budget Office’s baseline projected outlays (2027–36) for farm and nutrition programs, nutrition programs account for more than 70 percent—with most of the remaining spending directed to crop insurance, commodity programs, and conservation.

Download chart image | Chart data


The 2018 Farm Act authorizes two kinds of program funding:

Mandatory funding. Mandatory funding refers to programs that receive funding automatically, either as needed or at levels set in statute, without requiring annual appropriations from Congress. These programs are financed primarily through the Commodity Credit Corporation (CCC), a Government-owned corporation that provides a permanent funding mechanism. Because the programs are not subject to yearly appropriations decisions, spending under mandatory programs can fluctuate from year to year, based on participation levels and economic conditions. Congress can change mandatory funding levels at any time through new legislation, but these programs are not automatically reconsidered during the lifespan of a Farm Bill. Examples of Farm Bill programs with mandatory funding include the Supplemental Nutrition Assistance Program (SNAP), as well as most commodity and conservation programs. Mandatory funding plays a central role in shaping the long‑term fiscal trajectory of Farm Bill legislation.

Discretionary funding. Programs authorized with discretionary funding receive annual funding levels set through the appropriations process. These levels may vary from year to year, depending on congressional priorities. Once a program reaches its annual appropriation, no additional spending can occur unless Congress provides new appropriations. Because of this structure, discretionary programs—many of which include research and rural‑development initiatives—face more year‑to‑year uncertainty than programs with mandatory funding. This uncertainty can influence program planning, administrative capacity, and the stability of services delivered to producers and rural communities. In contrast, Farm Bill programs funded through mandatory authority receive funding automatically, without the need for annual appropriations. For this reason, Congressional Budget Office (CBO) baseline projections include only programs authorized with mandatory funding and therefore, do not reflect the full scope of discretionary activities that also support agriculture and rural development.

Four policy areas dominate projected spending under the 2018 Farm Act:

Nutrition. Mandatory nutrition-program spending was projected to account for 72 percent ($985 billion) of the 10-year projected outlays from 2027–2036. Details on food and nutrition-assistance-program spending can be found at ERS Ag and Food Statistics: Charting the Essentials, Food Security and Nutrition Assistance.

Crop insurance. Crop-insurance-program expenditures are projected to comprise 11 percent ($156 billion) of total outlays over 2027–36. These expenditures include support to crop-insurance companies for delivery and underwriting, as well as subsidies for farmer premiums. 

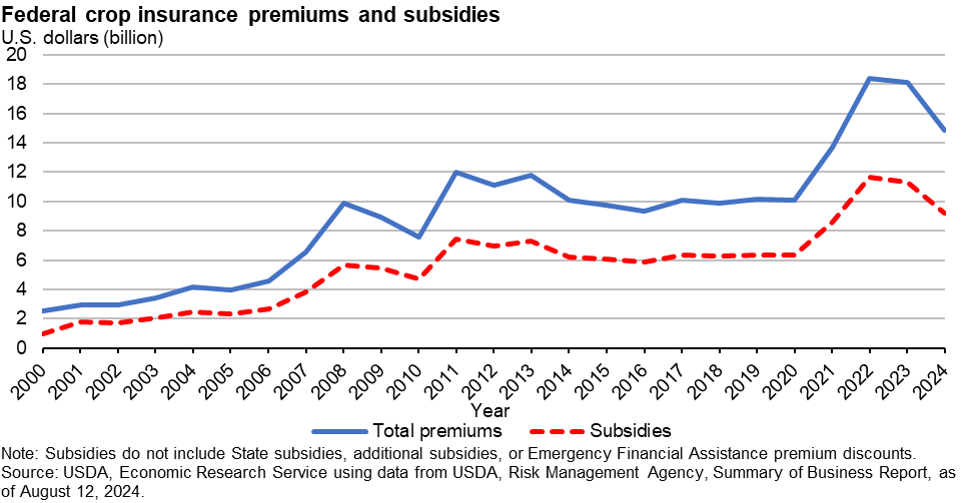
Because premium calculations depend in part on expected prices and crop insurance subsidies are a set percentage of the premium, Government expenditures on crop insurance fluctuate with commodity prices—in periods of high prices, expenditures on crop insurance rise, and they fall when prices decline. Expenditures on crop insurance also change when there are increases in subsidy rates or when there is increased uptake of new crop insurance products. For example, following the introduction of revenue-based insurance policies in the 1990s, their use increased such that (in 2025) these policies represented 57 percent of insured liabilities in the Federal Crop Insurance Program (FCIP). Index plans have also gained popularity since their introduction in 2007, and now comprise a majority of insured acres (largely under the Pasture, Rangeland, and Forage policy). Additionally, purchases of livestock insurance products have been rising since Congress amended rules around subsidization of livestock insurance in 2018. In 2025, livestock insurance plans (Dairy Revenue Protection, Livestock Gross Margin, and Livestock Risk Protection) accounted for 20 percent of total FCIP liabilities. The 2025, OBBBA raised subsidy rates across different levels of crop insurance coverage, beginning in crop year 2026. Details on crop insurance-program spending are provided on the ERS Risk Management web page Crop Insurance at a Glance.

The chart shows U.S. Federal crop insurance premiums and subsidies from 2000 to 2025. The solid blue line represents total premiums, which rise steadily over time with notable jumps around 2011 and again after 2020. The dashed red line shows subsidies, which follow a similar upward pattern but at lower levels. Overall, both premiums and subsidies increase significantly over the 25 year period.

Download chart image | Chart data

The chart shows the number of acres insured under the U.S. Federal Crop Insurance Program from 2000 to 2025, broken out by major policy types. Total insured acres increase steadily over time, growing from just above 200 million acres in the early 2000s to nearly 550 million acres by 2025. Most of the growth comes from the red “Area and index plans” category, which expands sharply after 2018. Individual revenue plans (yellow) are the second-largest category in 2025.

Download chart image | Chart data

The chart shows U.S. Federal Crop Insurance Program liabilities by policy type from 2000 to 2025. Total liabilities rise steadily over time, growing from over 30 billion dollars in 2000 to about 200 billion dollars by 2025. Individual revenue policies (yellow) make up the largest share throughout the period and drive most of the long‑term growth. Area and index plans (red) expand sharply after 2020 and contribute increasingly to total liabilities.

Download chart image | Chart data

Conservation. Mandatory conservation-program expenditures were projected to account for just over 5 percent of outlays from 2027–36. Details on conservation-program spending are provided on the ERS website topic page Conservation Programs.

Commodity Programs. Commodity-program payments were projected to make up just over 10 percent of outlays from 2027-36. As in the 2014 Farm Bill, commodity payments can respond to changes in yields and market prices, a feature which adds uncertainty to total outlays. For this reason, producers may receive higher or lower payments than the levels initially projected by CBO. In addition to payments made under the Agriculture Risk Coverage (ARC) and Price Loss Coverage (PLC) programs, direct Government payments to producers can be made under Marketing Loan Program provisions under certain economic circumstances.

The chart shows Agriculture Risk Coverage (ARC) and Price Loss Coverage (PLC) payments from 2014 to 2023. Payments peak in the early years, especially in 2015 and 2016, when total payments exceed $7 billion, with ARC making up the majority. PLC payments become more prominent in 2019, when they reach their highest level in the series. After 2019, both ARC and PLC payments drop sharply, with payments from 2021 to 2023 a fraction of previous levels.

Download chart image | Chart data