
USDA's National Household Food Acquisition and Purchase Survey (FoodAPS) provides unique and comprehensive data about household food purchases and acquisitions, for consumption at home and away from home, including foods acquired through food and nutrition assistance programs. FoodAPS fills a critical data gap and supports research on key national priorities, including health and obesity, hunger, and nutrition assistance policy. The data also include information about factors that affect food purchase decisions, such as the number and characteristics of people in the household, their available resources (including food and nutrition assistance program benefits, if any), and the array of stores and restaurants that are nearby. Food at home refers to grocery store or supermarket food purchases and food away from home refers to restaurant purchases.
- Key findings
- Additional findings and resources
Key findings
- Nutrition scores for Americans’ food acquisitions vary by source
- Americans purchase almost two-thirds of their calories from large grocery stores
- SNAP benefits play a strong role in the food budgets of participant households with children and those in deep poverty
- SNAP participants spend more out-of-pocket on food-at-home than with SNAP benefits as time since their benefit receipt increases
- SNAP households acquire about as many calories as other households but spend less
- Distance to grocery stores and vehicle access affect low-income shoppers’ food spending
Nutrition scores for Americans’ food acquisitions vary by source
The Healthy Eating Index-2010 measures dietary quality in terms of conformance to the 2010 Dietary Guidelines for Americans, with a higher score reflecting a healthier diet. ERS researchers calculated nutrition scores for foods purchased or acquired for free by three groups: participants in USDA’s Supplemental Nutrition Assistance Program (SNAP), low-income non-SNAP households, and higher income non-SNAP households. Although foods acquired at large grocery stores were more nutritious than foods from smaller stores, restaurants, and other eating places, such purchases by SNAP households scored 4 points below purchases by low-income non-SNAP households and 8 points below purchases by higher income non-SNAP households. For SNAP households, school food rivaled large grocery stores for nutritional quality. This is likely because meals served as part of USDA’s school lunch and breakfast programs must meet Federal nutrition standards.

Americans purchase almost two-thirds of their calories from large grocery stores
ERS researchers found that three-quarters of U.S. households’ calories came from retail stores, with supermarkets, supercenters, and other large grocers providing 65 percent of calories by themselves. Small and specialty food stores such as bakeries and farmers' markets supplied 3 percent of calories and 6.5 percent came from convenience stores, dollar stores, and other stores. Restaurants and other eating places provided 17 percent of household calories. Additionally, the overall nutritional quality of foods purchased at large grocery stores was higher than that of foods purchased at other retail outlets or restaurant and fast-food establishments.

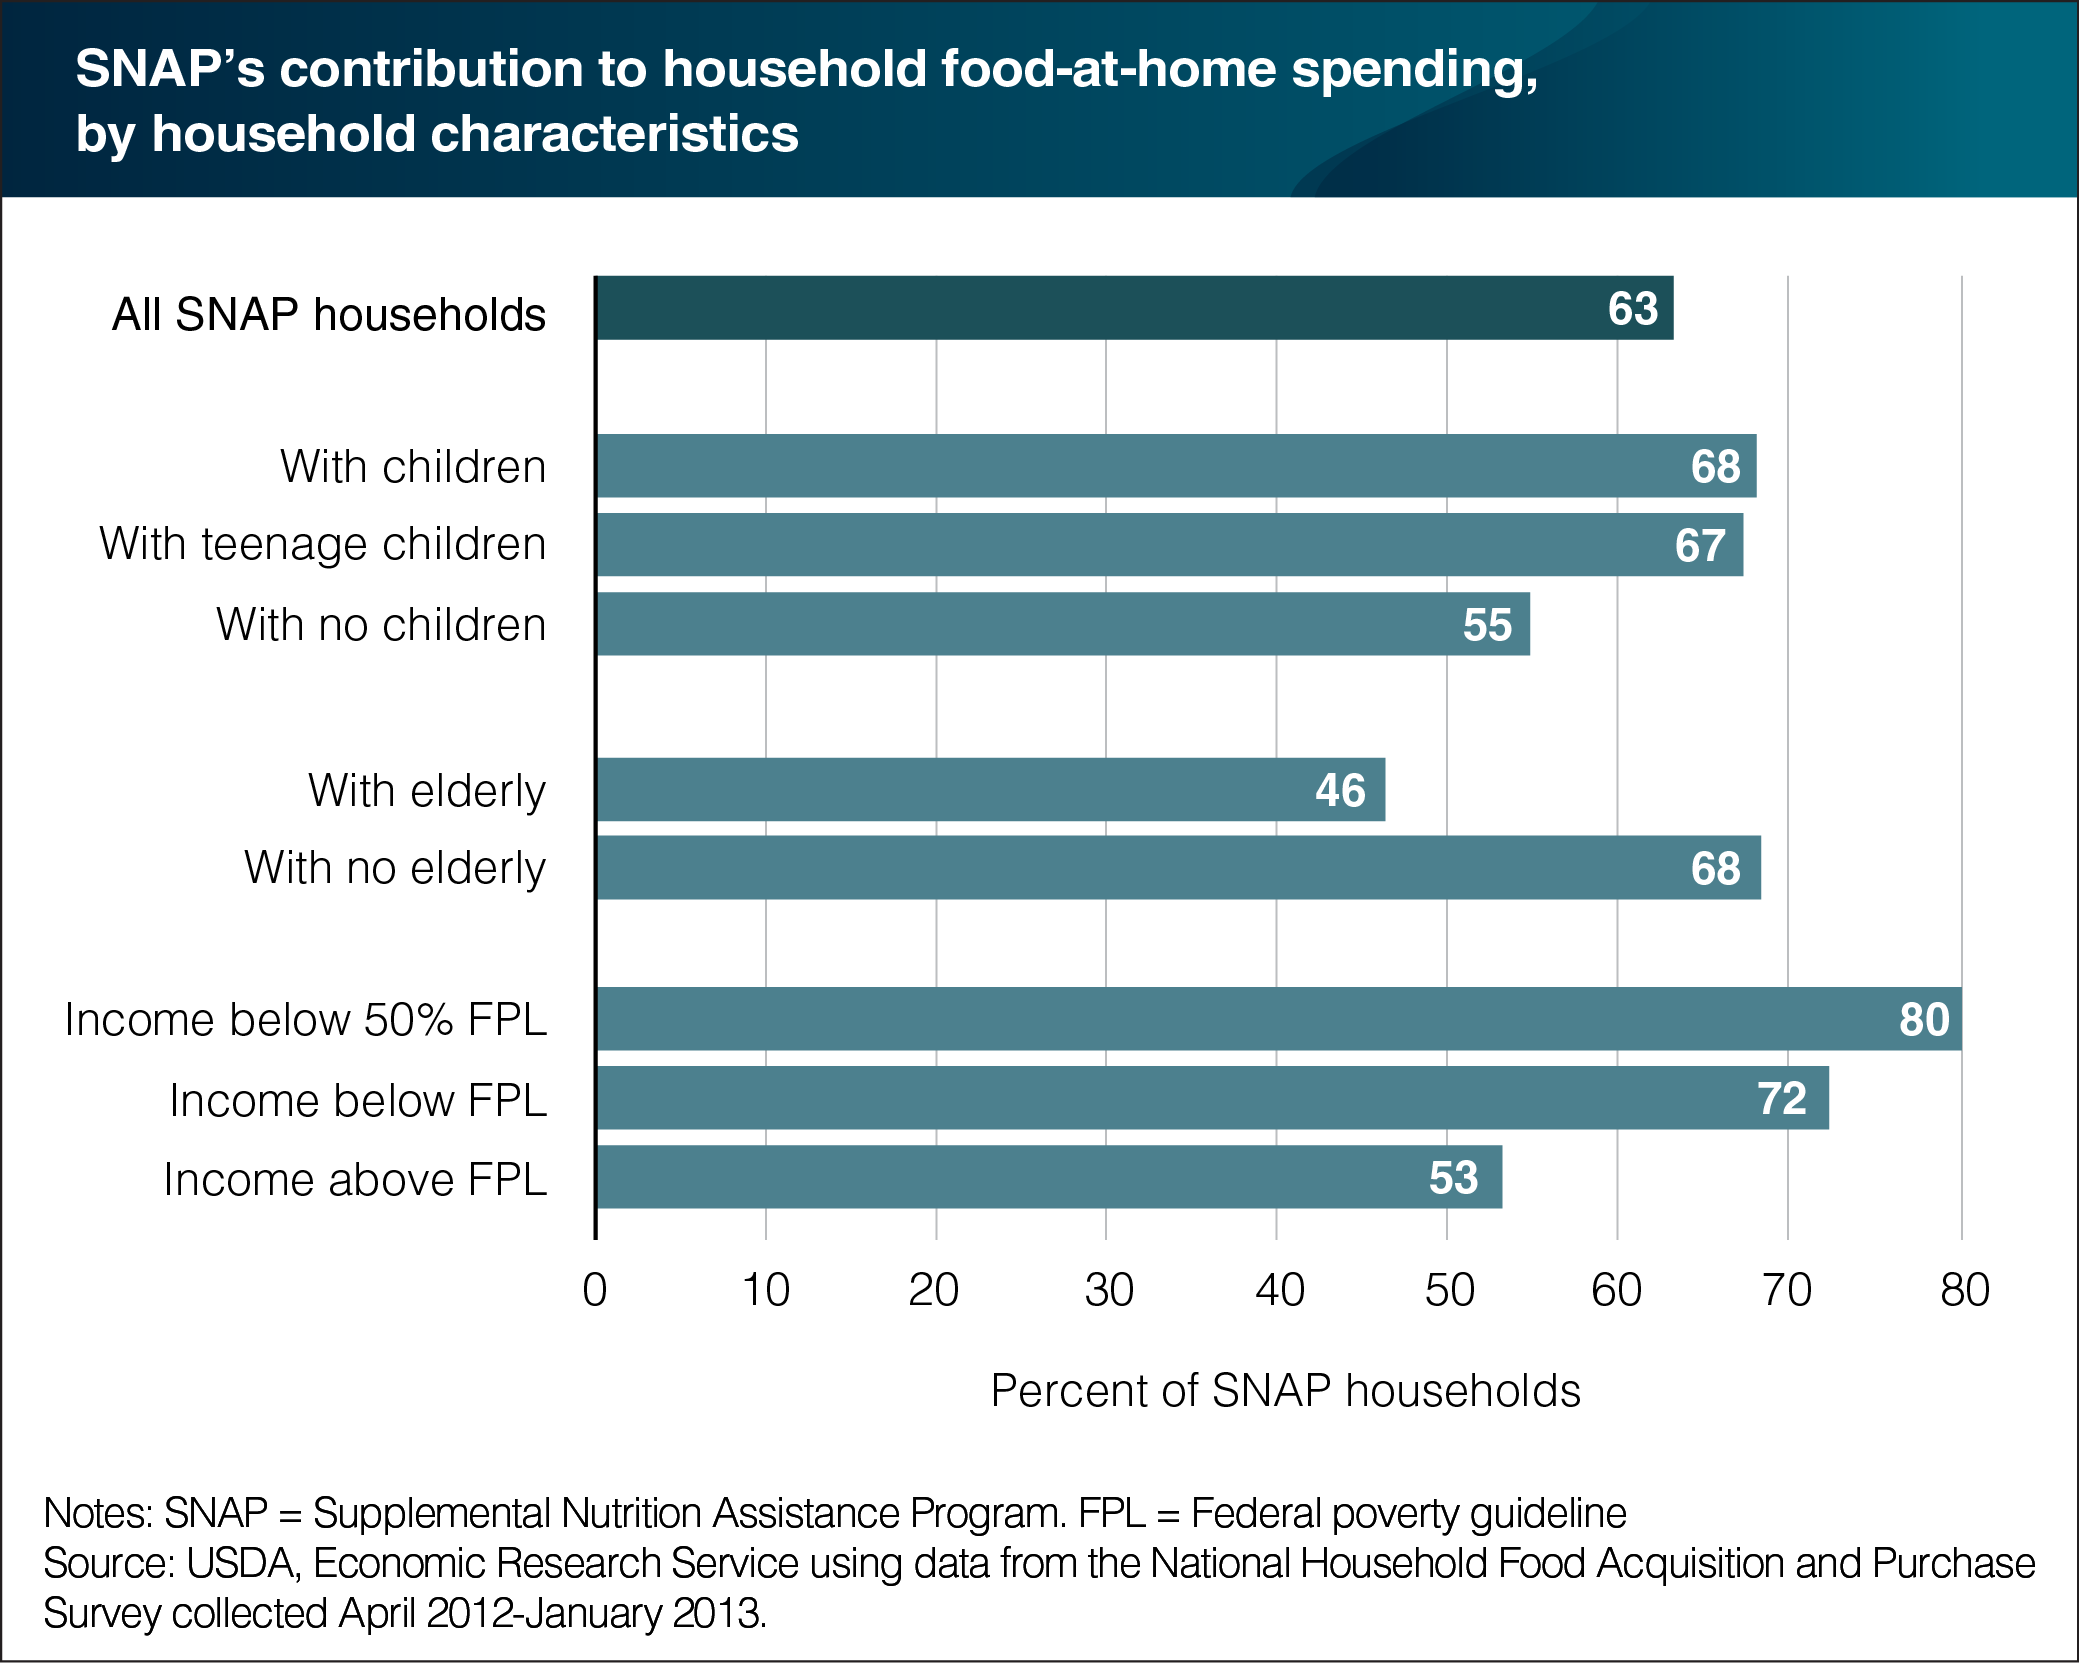
SNAP benefits play a strong role in the food budgets of participant households with children and those in deep poverty
As one of the largest social safety net programs, SNAP provides millions of Americans with additional funds to purchase food. The amount of SNAP benefits received by eligible households is based on the expectation that households spend 30 percent of their income on food, resulting in many SNAP-participating households spending more on food than the benefit amount received. ERS researchers found that SNAP benefits covered 63 percent of the average food-at-home spending (SNAP benefits cannot be used to purchase food at restaurants) in 2012. Households must use other resources to purchase the remaining 37 percent of weekly food purchases. For SNAP households with children, their benefits covered 68 percent of weekly food-at-home spending. Among participating households in deep poverty (income below 50 percent of the Federal poverty guidelines in 2012), SNAP benefits accounted for 80 percent of food-at-home spending.
SNAP participants spend more out-of-pocket on food at home than with SNAP benefits as time since their benefit receipt increases
In a 2016 article in the American Journal of Agricultural Economics, researchers found evidence that suggests a monthly pattern of higher consumption at the start of the SNAP benefit month followed by lower consumption toward the end of the benefit month. Looking at average daily spending for SNAP households, the table below displays daily spending over the benefit month. SNAP households, on average, spent $45.7 on food-at-home ($39.6) and food-away-from-home ($6.1), conditional on a positive purchase. Compared to the overall monthly average, spending on food items during the first week after receiving SNAP benefits increased to $62.7 total, and decreased to $37.2 during the rest of the month. The decrease is almost entirely attributed to food-at-home spending, as food-away-from-home purchases remain relatively constant.
| Expenditures (dollars) | ||
|---|---|---|
| Period | Food at home | Food away from home |
| Week 1 | 56.1 | 6.6 |
| Weeks 2-4 | 31.3 | 5.9 |
| Entire month | 39.6 | 6.1 |
Source: Source: Travis A. Smith, Joshua P. Berning, Xiaosi Yang, Gregory Colson, Jeffrey H. Dorfman; The Effects of Benefit Timing and Income Fungibility on Food Purchasing Decisions among Supplemental Nutrition Assistance Program Households, American Journal of Agricultural Economics, Volume 98, Issue 2, 1 March 2016, Pages 564–580, https://doi.org/10.1093/ajae/aav072 |
||
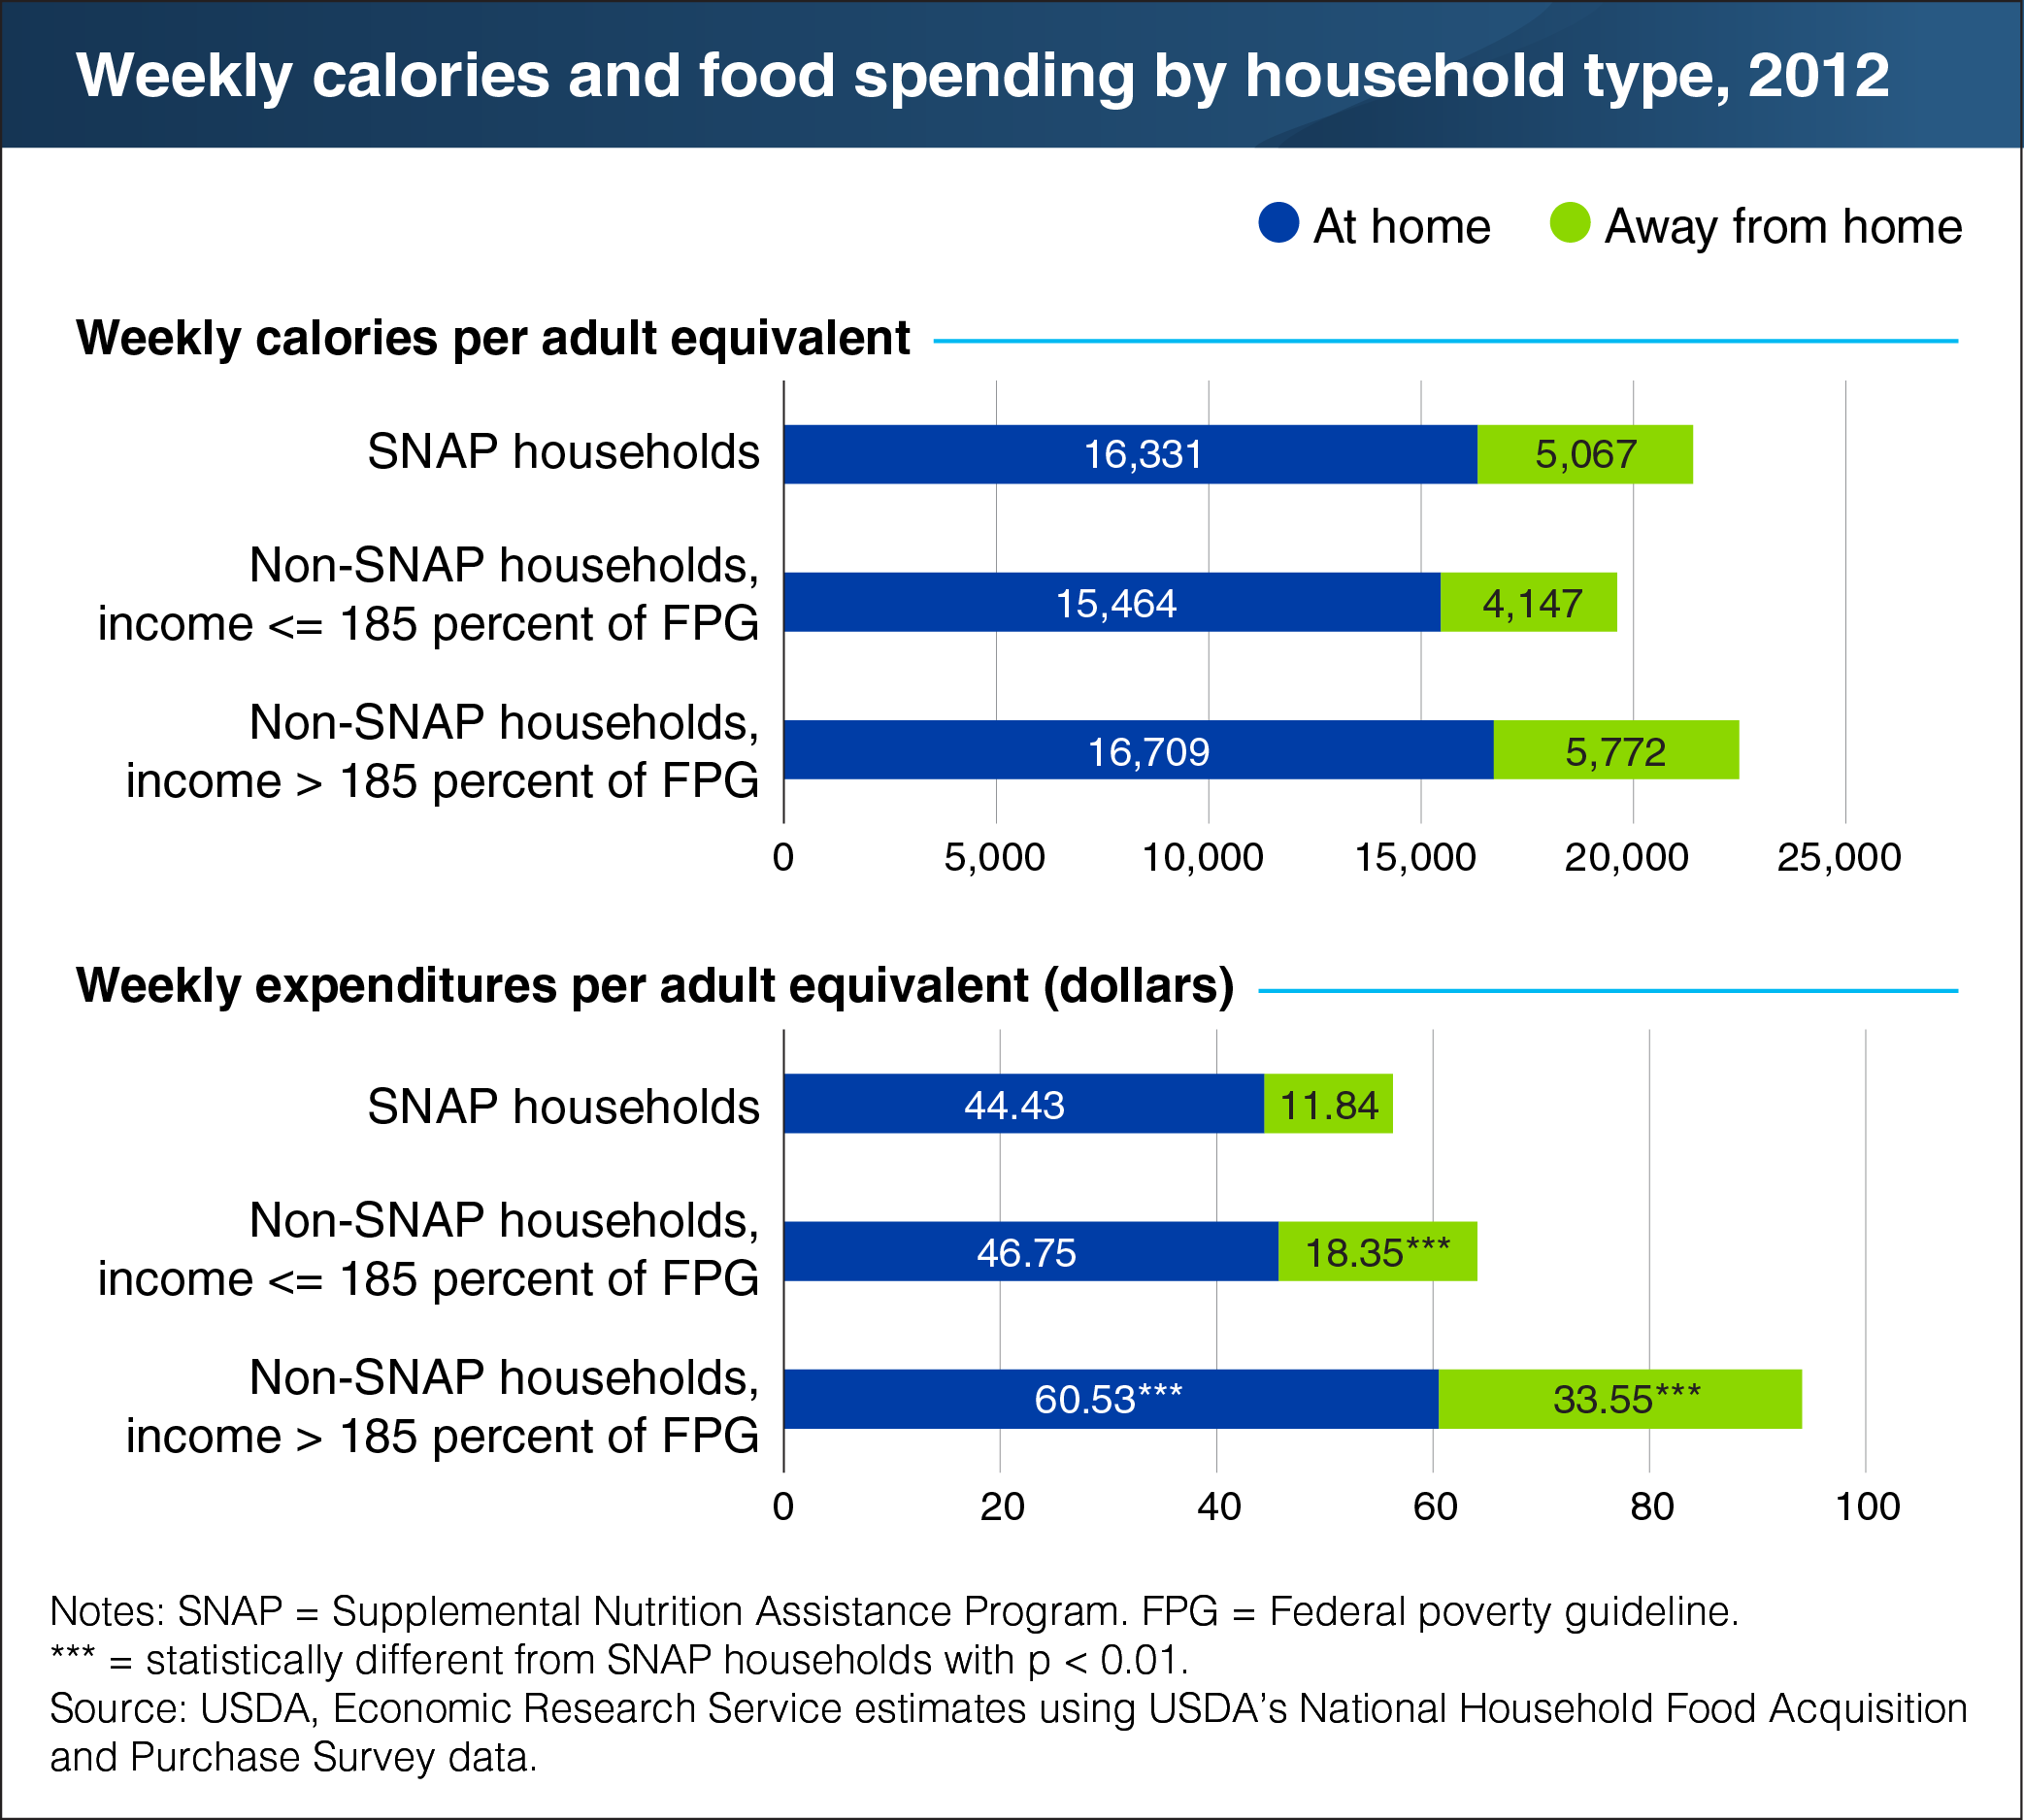
SNAP households acquire about as many calories as other households but spend less
Households may have similar food needs but different budgets with which to meet them. Adjusting for age, gender, and number of household members, researchers created an adult equivalent measure for SNAP households, low-income non-SNAP households, and higher income non-SNAP households. Average acquired calories per adult equivalent were similar for all three groups, but food expenditures were not. SNAP households spent roughly $37 less per adult equivalent per week on food than higher income non-SNAP households. SNAP households devoted less of their food dollars to purchases from restaurants and other away-from-home sources, and instead relied more on school meals and family and friends.
Distance to grocery stores and vehicle access affect low-income shoppers’ food spending
Difficulty accessing large grocery stores may increase a household’s reliance on smaller stores and restaurants, possibly resulting in a diet of low-nutritional quality and related health issues. Among low-income households, researchers found that access-burdened households (4.7 percent of U.S. households) and sufficient-access households (26.4 percent of U.S. households) spent similar shares of their weekly food spending at grocery stores (57-58 percent) and at small grocery, ethnic, and specialty food stores (3-5 percent). Differences between the two low-income access groups did arise in spending; access-burdened households spent a higher share of their food expenditures at convenience, dollar, drug, and other small stores than sufficient-access households and a smaller share of their food budgets at eating places.

Additional findings and resources
- Households that buy directly from farmers spend more money on fruits and vegetables. See the ERS report, The Relationship Between Patronizing Direct-to-Consumer Outlets and a Household’s Demand for Fruits and Vegetables, January 2018.
- Households may acquire food for free from a variety of sources including meals at family gatherings, work-provided meals and snacks, and informal support from friends. See: "Nearly 30 percent of the Times That SNAP Households Acquire Food, the Food Is Free" in Amber Waves, November 2017.
- Distance to grocery stores and vehicle access influence where low-income households shop for food. See the ERS report, The Influence of Food Store Access on Grocery Shopping and Food Spending, October 2017.
- Households with obese children differ from those with no obese children. See the ERS report, The Differences in Characteristics Among Households With and Without Obese Children: Findings from USDA’s FoodAPS, September 2017.
- Food acquisition locations differ by household income and SNAP participation. See the ERS report, Where Households Get Food in a Typical Week: Findings from USDA’s FoodAPS, July 2016.
- WIC households favor supercenters for their primary grocery shopping. See: "Most U.S. Households Do Their Main Grocery Shopping at Supermarkets and Supercenters Regardless of Income" in Amber Waves, August 2015.
- Nearly one-third of SNAP participants use someone else's car, walk, bike, or take public transit for their grocery shopping. See the ERS report, Where Do Americans Usually Shop for Food and How Do They Travel To Get There? Initial Findings from the National Household Food Acquisition and Purchase Survey, March 2015.
- U.S. households are, on average, 2.2 miles from a supermarket, but report usually shopping at a store 3.8 miles away, on average. See the ERS report, Where Do Americans Usually Shop for Food and How Do They Travel To Get There? Initial Findings from the National Household Food Acquisition and Purchase Survey, March 2015.